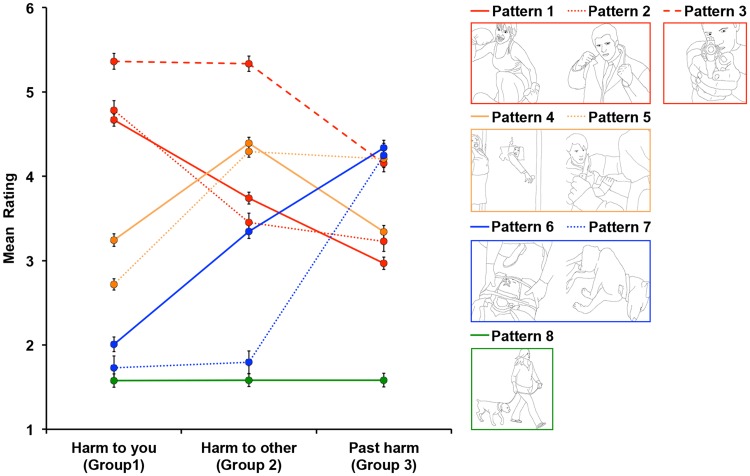
Figure 2.
Eight unique patterns capturing 500 images in our stimulus set based on trend analysis. Patterns 1 (n = 85), 2 (n = 34), and 3 (n = 51) all captured images that depicted scenes posing high threat to the observer, receiving high ratings from Harm to you group. Both Patterns 4 (n = 80) and 5 (n = 97) captured images depicting scenes posing high threat to someone else, receiving highest ratings from Harm to other group. Patterns 6 (n = 59) and 7 (n = 23) both captured images depicting scenes where harm (physical, psychological, or both) has already happened, receiving highest ratings from Past harm group. Finally, Pattern 8 (n = 71) captured images depicting low level of threat either to the observer or someone else that were rated equally low by all three groups.

