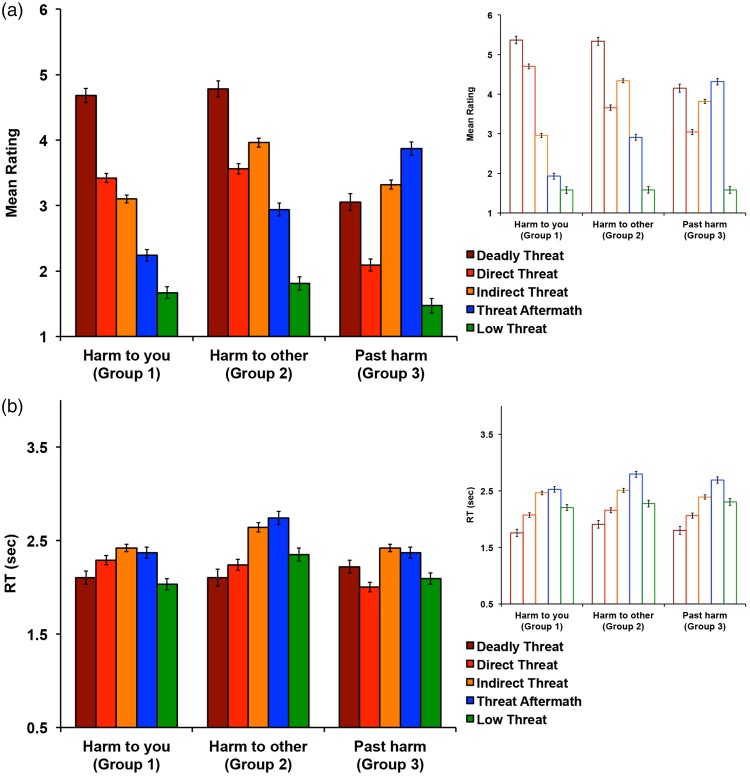
Figure 6.
Study 1 validation results. (a) Results of the color photographic scene ratings (left). The three panels show the results from the three rating groups. Participants in Group 1 (left panel) were asked to rate all images in terms of potential harm to them personally; participants in Group 2 (middle panel) were asked to rate all images in terms of potential harm to someone else; participants in Group 3 (right panel) were asked to rate all images in terms of past harm, but no present harm. 500 images were presented in a randomized mixed sequence. Results of the line drawings of the matching scenes (Study 1) are presented on the right for the comparison. (b) Results of the RT. The error bars indicate standard error of the mean.

