

Abstract
Background:
A key approach in enabling people with diabetes to better manage their condition is through self-monitoring of blood glucose (SMBG). Any functional SMBG system should demonstrate clinical accuracy across a broad glucose range and be insensitive to hematocrit. Furthermore, it should be incumbent on the manufacturer to demonstrate that their product continues to meet clinical accuracy claims during product lifetime.
Methods:
Test strips from a globally distributed SMBG product were sampled from randomly selected production batches as part of the manufacturer’s routine product evaluation process. Clinical accuracy was assessed within diabetes patients at 3 clinic sites against a standard reference method and evaluated against system accuracy in accordance with the ISO 15197:2015 standard (unchanged from ISO 15197:2013 in terms of performance specifications). Data were collected over 7 years (2010-2016) and comprised 73,600 individual glucose results. Overall clinic performance was assessed, as was accuracy at low and high glucose levels and extremes of hematocrit.
Results:
Across the 7-year surveillance period, overall test strip clinical accuracy was 97.8% versus the 95% ISO-defined minimum criterion with by-year values of 97.0-98.6%. Accuracy at the lowest (≤50 mg/dL) and highest (>400 mg/dL) ranges of glucose was 97.0% and 98.3% respectively. Within these low/high blood glucose subpopulations, accuracy at the lower and upper first percentile hematocrit ranges, was 98.9%, and 97.1% respectively.
Conclusions:
This 7-year surveillance program showed the test strips to have excellent clinical accuracy at the outer ranges of subject blood glucose and hematocrit, based on assessment against the ISO 15197:2015 clinical accuracy criterion.
Keywords: accuracy, clinic, extreme, glucose, hematocrit, surveillance
There is a recognized need for improved blood glucose measurement system (BGMS) performance in certain clinical settings and for specific patient subgroups which has driven more rigorous accuracy and precision requirements for these diagnostic devices.1,2 Numerous reports have highlighted a clinical need for improved meter accuracy3,4 with respect to the adjustment of insulin dosing, minimizing glucose result outliers and minimizing the impact of underlying medical conditions, such as anemia, on the true glucose result.5 An important factor that can influence blood glucose meter performance is the level of sample hematocrit (Hct), especially in association with extremes of low or high blood glucose. Variations of Hct are particularly evident in specific patient subgroups. The performance of selected blood glucose meters has recently been evaluated in neonatal blood samples where Hct levels ranged from 18-75%6 and in an antenatal clinic setting where Hct levels ranged from 31-43%.7 We previously reported the accuracy of blood glucose test strips at hypoglycemic glucose levels8 in subjects with Hct levels of 25.0-56.5% and more recently described how BGMS systems using this test strip met precision, accuracy, Hct and interferences criteria in clinical testing according to ISO15197:2015.9,10
In addition to patient specific-considerations, there is a growing call amongst experts for routine postmarket surveillance to safeguard patients with diabetes from consumer products that do not routinely meet their labeled accuracy performance in the field. The Diabetes Technology Society (DTS) has created a clinical surveillance protocol containing performance targets and analytical testing studies, to be conducted by qualified clinical and laboratory sites.11 It is intended that results from this initiative be made available to professionals, payers and regulatory agencies to allow informed decisions in selecting, prescribing, financing and regulating in-market BGMS products. This company-sponsored surveillance analysis describes the performance of OneTouch© Verio™ test strips, both overall and at the limits of Hct and blood glucose distributions, based on a unique and extensive dataset of 73,600 individual glucose results generated from routine clinical testing of randomly selected test strip production batches released to the market over a 7-year surveillance period.
Methods
Test Strips
The blood glucose test strips comprise a “lower” thin palladium (Pd) film, a spacer of controlled thickness and an “upper” gold (Au) electrode (Figure 1). Removal of a rectangular portion of the spacer exposes and defines 2 electrodes co-facially opposed across the sensing chamber and separated by a distance equal to the spacer width. The glucose sensing reagent chemistry is formulated from buffer salts, surfactants, potassium ferricyanide mediator and flavoprotein glucose dehydrogenase (FAD-GDH) and is deposited and dried onto the lower palladium electrode. FAD-GDH enzyme was chosen for its high substrate specificity, non-reactivity toward oxygen and minimal maltose interference. During the test, enzyme-catalyzed oxidation of glucose results in reduction of the FAD moiety within the GDH enzyme. Ferricyanide mediator, being able to diffuse rapidly to the active site of the enzyme, is able to accept the electron from the FAD structure. This reduced ferrocyanide form of the mediator further diffuses to the anode (the Au electrode in seconds (s) 1-4 of the assay; the Pd electrode from 4-5 s) where electron transfer occurs, thus generating a glucose concentration dependent signal that is processed by an on-meter algorithm. A number of systems based on this test strip are commercially available, but all use the same test strip design.12
Figure 1.
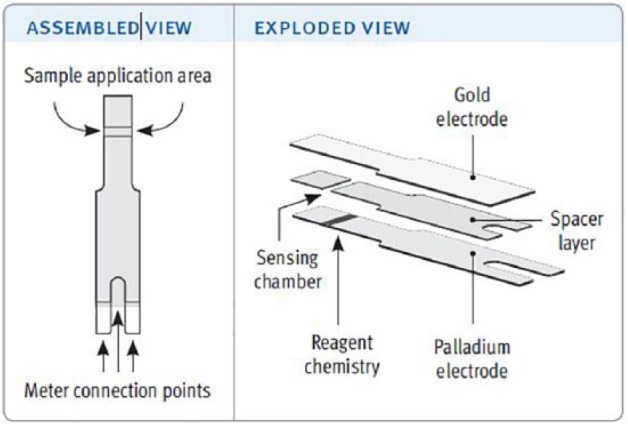
Assembled and exploded views of the test strip.12
Clinic Testing
These test strips have been manufactured by LifeScan Inc (Wayne, PA) since 2010 and all associated BGMS systems meet the ISO 15197:201513 clinical accuracy requirement for in vitro blood glucose monitoring systems for self-testing of blood glucose for managing diabetes, across the blood glucose range of 20-600 mg/dL and Hct of 20-60%. To continuously monitor product clinical performance, samples from randomly selected representative test strip production batches are subjected to clinical accuracy assessment at 3 National Health Service (NHS) UK clinic sites: (1) Highland Diabetes Institute, Inverness; (2) Department of Diabetes, Royal Infirmary of Edinburgh; (3) Birmingham Heartlands Hospital.
Studies were conducted under existing UK Scotland A Research Ethics Committee approval (10/S1103/2). Participant inclusion criteria required a diabetes diagnosis, informed consent and 20-60% Hct. Tests were performed using test strip dedicated meters, with results displayed as plasma-equivalent blood glucose values. Because patients may have visited the clinical sites on more than 1 occasion during the evaluation, and could be tested with more than 1 strip lot per visit, the clinical dataset is not entirely composed of unique donors.
For clinical assessment, a participant’s finger was prepared and lanced (fingersticked) according to product use instructions and blood applied to the test strip until the 0.4 µl sample chamber was filled. Testing was performed by trained technicians, thus is more reflective of a system accuracy evaluation as defined by the ISO standard with the associated system-specific errors that may occur, as opposed to a user performance evaluation where additional non-meter-related factors may also arise. Results were recorded, in mg/dL, after the 5 s test time. Non-numerical values (strip errors) were recorded and reviewed on a batch-by-batch basis, although an amalgamated record of all data was not kept. In addition, in routine manufacturing, all released batches of product are first sampled and evaluated in a laboratory setting to ensure the frequency of non-numerical errors are within acceptable quality limits. Furthermore, the manufacturer maintains both customer complaints and postmarket surveillance programs. Where multiple test strip batches were assessed in the same clinic, blood from the same fingerstick sample was applied to additional strips as required. A further sample of capillary blood was collected in a heparinized capillary tube for same-day Hct measurement using a Hettich Hematocrit 210 capillary centrifuge. The Hct level was recorded as the percentage volume of red blood cells (RBCs) as a proportion of the total sample volume. An additional minimum sample of 200 µl capillary blood was collected in a 300 µl Microvette Lithium Heparin blood collection tube and centrifuged, with the plasma fraction used for glucose determination by the independent reference method within 30 min of centrifugation. Test site temperature was maintained between 20-24°C, at ≤70% relative humidity. A maximum of 2 fingersticks were permitted to complete all testing procedures.
Reference Instrument
Test strip data were compared against a clinical laboratory standard instrument (YSI 2300 STAT PLUS™ blood glucose analyzer; Yellow Springs Instrument Co Inc, Yellow Springs, OH). Instruments were subject to routine maintenance and calibrated prior to all quality control and blood testing, linearity being assessed prior to each usage with standards of 50, 200, 500, 700 mg/dL glucose. Duplicate plasma glucose measurements were recorded on 2 separate instruments, with individual values and absolute difference values required to meet predefined acceptance criteria. The mean of the duplicate measurement values was used for clinical accuracy assessment.
Analysis
Minitab v16 (Minitab Inc, PA, USA) was used for statistical evaluations. A total of 100 qualifying (i.e., within the claimed Hct range of the product) sets of values were collected per batch, thus requiring a minimum of 100 participants per individual batch evaluation. Clinical accuracy was expressed in terms of bias to the reference method with analysis being evaluated above and below a threshold glucose value. Meter values below threshold were expressed as absolute bias (mg/dL) to reference, with results equal to, or above, being expressed as percent bias (pbias) to reference. Two different specifications were evaluated (Table 1) with specification 1 meeting ISO 15197:2015 and specification 2 describing a tighter accuracy requirement at low blood glucose (within ±12 mg/dL of reference at <80 mg/dL).
Table 1.
Specifications and Threshold Glucose Values Evaluated.
| Specification | Low glucose/High glucose | Glucose threshold |
|---|---|---|
| 1 | ±15 mg/dL / ±15% | 100 mg/dL |
| 2 | ±12 mg/dL / ±15% | 80 mg/dL |
Specification 1 defines the ISO 15197:2015 clinical accuracy specification.
Results
Overall Clinical Accuracy Performance
The total number of clinical glucose measurements obtained (N = 73,600) represents the entirety of the data obtained under this routine clinical surveillance assessment, with no batches or qualifying measurements excluded. The overall accuracy of all clinical glucose measurements was assessed against the ISO 15197:2015 system performance accuracy requirements: (1) 95% of measured glucose values to fall within either ±15 mg/dL of the average reference instrument measured values at glucose concentrations <100 mg/dL or within ±15 % at glucose concentrations ≥100 mg/dL and (2) 99% of individual glucose measured values to fall within zones A and B of the Consensus Error Grid (CEG) for type 1 diabetes.14 The pbias of the data relative to the reference method is also shown graphically as an empirical cumulative distribution (“Mountain”) plot,15 that aids visualization of data distribution relative to reference. System performance was also assessed against the tighter accuracy specification (Table 1). Data are shown in Table 2 and Figure 2.
Table 2.
Test Strip Clinical Accuracy by Year, Against a ±12 mg/dL / ±15% Specification (80 mg/dL Glucose Threshold) and Against ISO 15197:2015 Specification, and the Percentage and Number of Values Within the A, B, and C Zones of the Consensus Error Grid.
| Year | n | In spec ±12/±15 (%) | In spec ±15/±15 (%) | % in spec (n) |
|||
|---|---|---|---|---|---|---|---|
| A zone | B zone | A+B zone | C zone | ||||
| 2010 | 8,179 | 97.7 | 98.2 | 99.71 (8,155) | 0.27 (22) | 99.98 (8,177) | 0.02 (2) |
| 2011 | 16,432 | 96.8 | 97.3 | 99.62 (16,369) | 0.38 (63) | 100.00 (16,432) | 0.00 (0) |
| 2012 | 12,469 | 97.9 | 98.0 | 99.51 (12,408) | 0.49 (61) | 100.00 (12,469) | 0.00 (0) |
| 2013 | 14,053 | 97.7 | 98.0 | 99.59 (13,996) | 0.38 (53) | 99.97 (14,059) | 0.03 (4) |
| 2014 | 9,880 | 98.6 | 98.6 | 99.77 (9,857) | 0.23 (23) | 100.00 (9,880) | 0.00 (0) |
| 2015 | 5,818 | 97.3 | 97.7 | 99.95 (5,815) | 0.05 (3) | 100.00 (5,818) | 0.00 (0) |
| 2016 | 6,769 | 96.7 | 97.0 | 99.65 (6,745) | 0.35 (24) | 100.00 (6,769) | 0.00 (0) |
| All | 73,600 | 97.5 | 97.8 | 99.65 (73,345) | 0.34 (249) | 99.99 (73,594) | 0.01 (6) |
Figure 2.
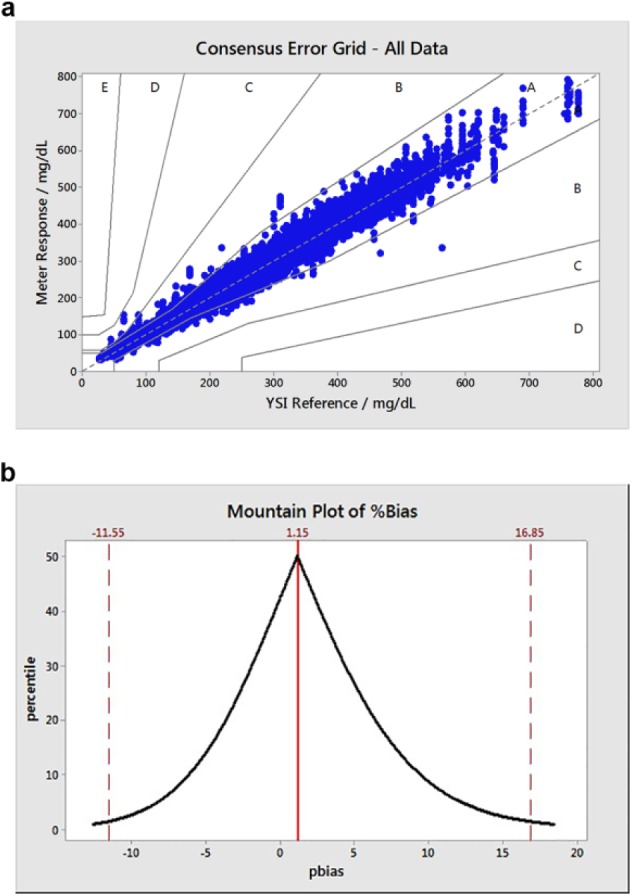
(a) Consensus error grid (type 1 diabetes) plot for all clinic data assessed (2010-2015; N = 73,600; 99.99% in A and B zones). (b) Associated folded empirical cumulative distribution (mountain) plot, excluding upper and lower 1 percentile pbias values (N = 72,130).
Across the 7-year surveillance period, overall clinical accuracy of the test strips against the ISO specification was 97.8% with by-year values of 97.0-98.6% (Table 2). When assessed against the tighter ±12 mg/dL / ±15% specification, a 7-year value of 97.7% was recorded with yearly values varying from 96.7-98.6%. CEG data (Figure 2a) showed that ≤99.97% of results were within the A and B zones (A: clinical accurate measurements with no effect on clinical action; B: altered clinical action with little or no effect on clinical outcome) for any given year (99.99% for the 7-year period, Table 2). Over this period, 6 values from 73,600 were in the C zone (altered clinical action, likely to affect clinical outcome) with no data points within zones D and E. The Mountain plot (Figure 2b) illustrates the distribution of the clinic data relative to reference, in terms of pbias for all values (for presentation purposes, the upper and lower 1 percentile values are not shown). Unlike the ISO-based evaluation, this analysis expresses all data points, irrespective of glucose levels, in terms of relative bias (pbias) as opposed to absolute bias for glucose values <100 mg/dL. The distribution appears to be continuous with no obvious anomalies with asymmetry in the direction of higher pbias. The upper and lower pbias values (16.85% and –11.55% respectively) correspond to the upper and lower 2.5% percentile values, that is, 95% of results occur within these pbias limits.
Clinical Accuracy by Glucose Concentration
The distribution of blood glucose values measured by the reference method is shown in Figure 3a. Values ranged from 27 to 829 mg/dL (mean = 201.2 mg/dL, SD = 93.1 mg/dL). ISO 15197:2015 stipulates that a given strip batch be tested across distributed glucose concentrations and defines 7 “buckets” spanning the range ≤50 to >400 mg/dL. ISO clinical accuracy was assessed across these buckets (Table 3). The American Diabetes Association (ADA) and Endocrine Society agree16 that patients should be alerted to the possibility of developing hypoglycemia at a self-monitored plasma glucose concentration of ≤70 mg/dL. Therefore, strip accuracy within this glucose range is also recorded. Table 3 shows accuracy to be maintained across all glucose ranges, with at least 96.0% of strips meeting the performance requirement within a given ISO bucket and at an overall amalgamated value of 98.0%. Values of 97.0% and 98.3% were obtained within ISO buckets 1 (lowest glucose) and 7 (highest glucose) respectively and 97.3% of results were accurate within the hypoglycemic range.
Figure 3.
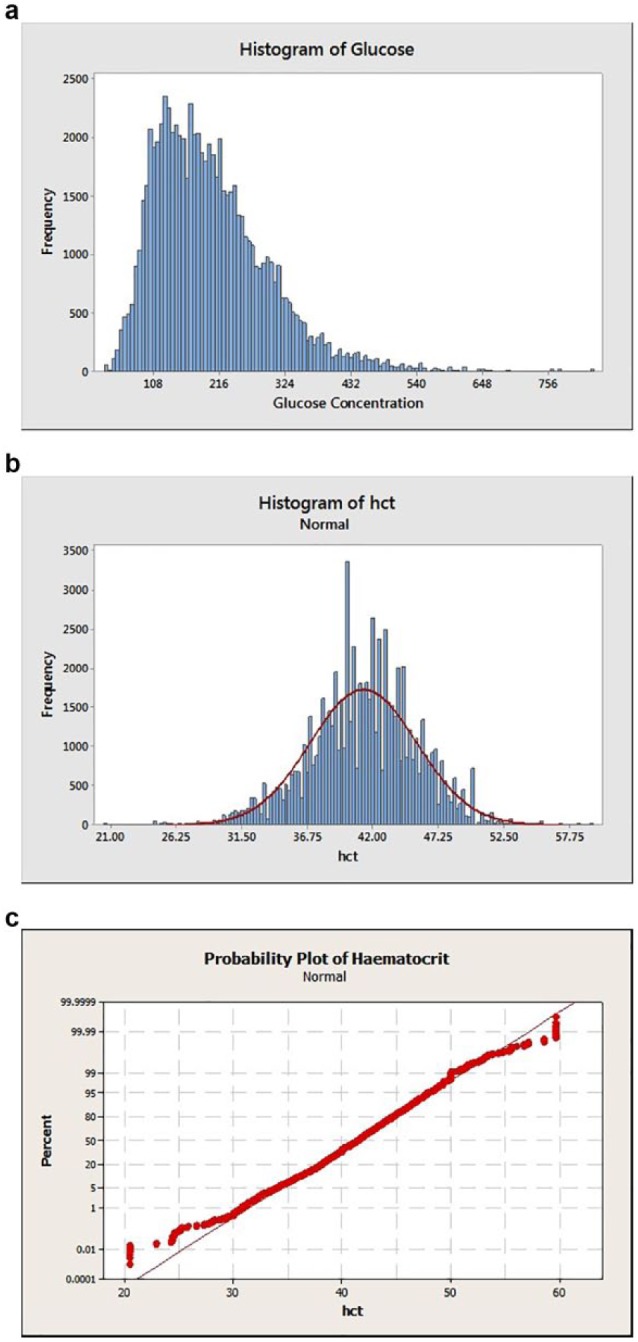
(a) Histograms of blood glucose distribution. (b) Hematocrit distribution. (c) Associated hematocrit distribution probability plot.
Table 3.
Clinical Accuracy Performance vs ISO 15197:2015 Specification Across Different Glucose Ranges (ISO “Buckets”).
| ISO bucket | Glucose range (mg/dL) | Accurate n | Total n | Accurate % |
|---|---|---|---|---|
| 1 | ≤50 | 321 | 331 | 97.0 |
| 2 | >50-80 | 2494 | 2597 | 96.0 |
| 3 | >80-120 | 10 804 | 11 166 | 96.8 |
| 4 | >120-200 | 26 625 | 27 204 | 97.9 |
| 5 | >200-300 | 21 752 | 22 095 | 98.5 |
| 6 | >300-400 | 7538 | 7692 | 98.0 |
| 7 | >400 | 2473 | 2515 | 98.3 |
| Hypoglycemic | ≤70 | 1676 | 1723 | 97.3 |
| Overall | ≤50->400 | 72 007 | 73 600 | 98.0 |
The hypoglycemic range is as defined by the Joint ADA and Endocrine Society statement.
Clinical Accuracy at Extremes of Hematocrit
The distribution of all 73,600 Hct measurements is shown in Figure 3b (Hct mean: 41.2%; SD: 4.3%). The distribution was tested for normality (Figure 3c) with the low and high values being shown to deviate from normality (P-value >0.005). Therefore, the Minitab PERCENTILE(Var, p) function was used to calculate the lower and upper 1% range with Var = Hct and P set to .01 and .99, respectively. This inverse empirical fit approach yielded the following Hct distribution ranges—lower 1 percentile: Hct 20.5-30.8%; upper 1 percentile: Hct 50-59.6%.
The dataset was then split into the ISO 15197:2015 recommended glucose ranges for system accuracy evaluation (“ISO bucket”) and also by proportion of values within the hypoglycemic range (≤70 mg/dL). Clinical accuracy data were then evaluated within the lower and upper 1 percentile Hct ranges (Tables 4a and 4b). For those subjects (n = 814; Table 4a) exhibiting the lowest 1 percentile of the clinical Hct distribution (20.5-30.8%), test strips met the ISO clinical accuracy performance in all applicable glucose buckets (at least 96.3% of values meeting specification by bucket and 96.0% of results [n = 25] accurate in the hypoglycemic range).
Table 4a.
Lower 1 Percentile Hct Range (20.5-30.8%): Clinical Accuracy Performance vs ISO 15197:2015 Specification.
| ISO Bucket | Glucose range (mg/dL) | Accurate n | Total n | Accurate % |
|---|---|---|---|---|
| 1 | ≤50 | NA | 0 | NA |
| 2 | >50-80 | 30 | 31 | 96.8 |
| 3 | >80-120 | 82 | 82 | 100.0 |
| 4 | >120-200 | 354 | 359 | 98.6 |
| 5 | >200-300 | 267 | 268 | 99.6 |
| 6 | >300-400 | 51 | 53 | 96.2 |
| 7 | >400 | 21 | 21 | 100.0 |
| Hypoglycemic | ≤70 | 24 | 25 | 96.0 |
| Overall | ≤50->400 | 805 | 814 | 98.9 |
Table 4b.
Upper 1 Percentile Hct Range (50.0-59.6%): Clinical Accuracy Performance vs ISO 15197:2015 Specification.
| ISO bucket | Glucose range (mg/dL) | Accurate n | Total n | Accurate % |
|---|---|---|---|---|
| 1 | ≤50 | NA | 0 | NA |
| 2 | >50-80 | 47 | 49 | 95.9 |
| 3 | >80-120 | 224 | 239 | 93.7 |
| 4 | >120-200 | 302 | 307 | 98.4 |
| 5 | >200-300 | 410 | 421 | 97.4 |
| 6 | >300-400 | 251 | 257 | 97.7 |
| 7 | >400 | 96 | 97 | 99.0 |
| Hypoglycemic | ≤70 | 32 | 32 | 100 |
| Overall | ≤50->400 | 1330 | 1370 | 97.1 |
Within the upper 1 percentile Hct range (50.0-59.6%; Table 4b; n = 1370), all values met specification (at least 95.9% by bucket) except in the >80-120 mg/dL range (93.7%). However, it should be noted that for ISO reporting purposes, the number of within specification values is expressed as a percentage of the total number of values and thus amalgamates results from across the full glucose range. Therefore, a system can meet the overall 95% accuracy criterion without necessarily meeting it within a given bucket. When expressed as amalgamated glucose performance (Table 5) at the lowest and highest Hct extremes, product accuracy met both the ISO specification (98.9% and 97.1%, respectively) and the ±12 mg/dL /±15% specification (98.9% and 96.1%, respectively). All results were accurate in the hypoglycemic range (n = 32).
Table 5.
Clinical Accuracy of Lower and Upper Hct Percentiles Against Two Accuracy Specifications With All Glucose Levels Pooled.
| Hct Range | Specification | Accurate n | Accurate % |
|---|---|---|---|
| Lower Hct | 1 | 805 | 98.9 |
| Percentile | 2 | 805 | 98.9 |
| Upper Hct | 1 | 1330 | 97.1 |
| Percentile | 2 | 1324 | 96.6 |
No data points were recorded within the lowest glucose range (≤50 mg/dL; bucket 1) at either the lower and upper 1 percentile Hct ranges. The data within buckets 2 and 7 reflect a set of conditions in which clinical accuracy is assessed within the combined outlying distributions of both blood glucose and Hct. In such cases, performance remains accurate with at least 95.9% of values meeting specification in these participant subgroups (n = 198). In the case of high >400 mg/dL) glucose within the upper 1 percentile of Hct, all values were accurate (n = 21).
Discussion
Clinical Accuracy Performance
This ongoing, long-term (7-year) manufacturer-led surveillance evaluation demonstrates the sustained clinical accuracy of the manufactured test strips and represents the performance of multiple test strip lots and a total of 73,600 individual meter results. By year, across all glucose levels, ISO system accuracy requirements were consistently met. This evaluation allowed the collection of a large number of capillary blood samples with abnormally high and low glucose concentrations, including 2515 results at very high glucose >400 mg/dL) and 1723 results within the clinically important hypoglycemic range (≤70 mg/dL).
Evaluation of ISO system performance accuracy for BGMS products is a formal design validation procedure, requiring a minimum of 100 different patients conducted under actual conditions of use over at least 10 days. Given the size of this type of test (n = 100), there will be a rarity of patients with very low (≤50 mg/dL; bucket 1) or very high (>400 mg/dL; bucket 7) glucose. Correspondingly, ISO permits the substitution of modified capillary blood samples, in which glucose concentrations are artificially elevated or lowered, to allow these 2 buckets to be filled. The data in this analysis were collected using unmanipulated capillary blood samples, direct from fingerstick blood, that is, without recourse to manipulation of blood samples in the higher and lower ISO buckets, thereby presenting a rare indication of test strip performance directly from the lanced finger of patients with diabetes. In effect, it is the duration of the analysis and size of the clinic database that has provided the large number of qualifying values within these outlying glucose ranges, thereby providing a measure of product performance with unmanipulated capillary blood samples.
The clinic performance discussed above is a measure of system performance and thus include all sources of potential inaccuracy, such as system-related factors, patient specific factors and environmental conditions. As an ISO 15197:2015 compliant product, design of the test strip component of the system was verified to meet the standard with regard to analytical performance including linearity, measurement repeatability, intermediate measurement precision, interferences, temperature, humidity, altitude, and Hct. With regard to the latter patient-specific factor, the size of the clinic database also allowed test strip performance to be assessed at Hct extremes, but also in combination with high and low glucose, again with unmanipulated samples. This data evaluation tests the “limits” of strip performance by considering clinical accuracy for that subset of patients who have abnormally low and high Hct. There were no instances of low glucose within the extreme Hct populations, but the test strips were found to maintain ISO clinic accuracy performance within these populations at high glucose thus demonstrating test strip capability in the generation of clinically accurate blood glucose values to support appropriate treatment choices.
Clinical Relevance
Ensuring accuracy of strip performance is important given the variations seen in general patient populations and is especially important in specific populations that demonstrate wider Hct variations. A WHO report on iron deficiency anemia17 found the majority of pregnant women assessed had Hct >30% but below the normal range. Another report has shown that Hct of pregnant women averaged 35%, equivalent to a similar group of women with gestational diabetes.18 Providing consistent accuracy across the glucose range at these lower Hct levels is therefore important throughout pregnancy. Within a hospital diabetes outpatient population Hct levels of 26-52%19 and 35-52%20 have been reported (both these studies reported an average Hct of 43%, compared to 41.2% in this current evaluation, N = 73,600). Our data confirm that the test strips reliably measure blood glucose at both the lowest (≤50 mg/dL) and the highest (>400 mg/dL) glucose levels over a Hct range that is inclusive of the majority of patients with diabetes testing their blood glucose at home. Our extensive dataset reflects a broad patient population who, by the very nature of their condition, are on multiple medications and have a variety of underlying health conditions common to people with diabetes. Accuracy across a wide glucose and Hct range is important to enable patients and health care professionals to confidently make treatment decisions (eg, basal or bolus insulin dose adjustments) and to ensure patients have access to accurate results especially when experiencing episodes of hyper- and hypoglycemia.
Strip Design and Hematocrit Performance
The fact that the test system demonstrates accuracy at extremes of Hct at high and low glucose values demonstrates the capability of this BGMS system with respect to Hct. This capability has been created through careful strip design and includes a 3-step potential waveform and corrective algorithm21 as will now be described.
The Hct level of a blood sample is a measure of the red blood cells (RBCs) present. These cells act as impermeable barriers to the free diffusion of mediator, resulting in longer diffusion paths according to Fricke’s “obstruction” principles.22 For example, under the condition of the upper 1 percentile of Hct (50.0-59.6%), the increased diffusional pathways of ferricyanide to the enzyme and ferrocyanide (reduced mediator) to the anode will result in a significant decrease in the subsequent Faradaic response of the strip. In addition, as the RBC count increases, so there is a disproportionate increase in viscosity further influencing the sample’s hydrodynamic properties and effective diffusion coefficient of the mediator, resulting in a further attenuation of system response. In the test strip, the reagent layer is applied only to the bottom Pd electrode. Over seconds 1-4 of the assay, the Au electrode acts as the anode and enzyme reacts with glucose at the Pd electrode, generating a local increase in the concentration of ferrocyanide mediator. A proportion of this reduced mediator will diffuse to the Au electrode and be oxidised, the magnitude of which will be related to blood glucose concentration, enzymatic turnover and sample hydrodynamic properties. Thus this portion of the current/time response can be used to indicate the diffusional properties of the ferrocyanide anion and hence Hct properties of the sample. In the final 1 s of the assay, the Pd electrode serves as the anode and provides a measure of glucose in the sample, due to the localized enzyme reaction and concomitant accumulation of reduced mediator in the vicinity of the electrode. By evaluating the current response across the 5 s of the assay, an accurate Hct and interference adjusted glucose response is obtained, as demonstrated by the clinical accuracy performance reported here.
Conclusions
This proactive and ongoing surveillance program describes the clinical accuracy of a globally commercially available test strip, representing a unique and extensive database of the clinical accuracy of this product across a broad demographic of patients with diabetes within three hospital outpatient clinics over a seven-year period. The test strips met their intended and labeled ISO 15197:2015 clinical accuracy requirements across the claimed Hct and glucose range, including under the combined conditions of both high and low glucose and Hct.
Acknowledgments
The authors would like to thank the staff at each clinic location for performing the required clinical procedures and Brian Levy, MD, FACE, Larry Katz, PhD, and David Shearer, MD, for manuscript review and suggestions.
Footnotes
Abbreviations: ADA, American Diabetes Association; Au, gold; BGMS, blood glucose measurement system; CEG, consensus error grid for type 1 diabetes; DTS, Diabetes Technology Society; FAD-GDH, flavoprotein glucose dehydrogenase; Hct, hematocrit; ISO, International Organization for Standardization; NHS, National Health Service; pbias, percentage bias; Pd, palladium; RBC, red blood cell; s, second; WHO, World Health Organization; YSI, Yellow Springs Instruments
Declaration of Conflicting Interests: The author(s) declared the following potential conflicts of interest with respect to the research, authorship, and/or publication of this article: SS, MG, SP, SM, HC, and KC are full-time employees of LifeScan Scotland Ltd. LM is a full-time employee of LifeScan Inc.
Funding: The author(s) disclosed receipt of the following financial support for the research, authorship, and/or publication of this article: This work was funded by LifeScan Scotland Ltd.
References
- 1. Klonoff DC. Regulatory controversies surround blood glucose monitoring devices. J Diabetes Sci Technol. 2010;4:231-235. [DOI] [PMC free article] [PubMed] [Google Scholar]
- 2. Klonoff DC. FDA is now preparing to establish tighter performance standards for blood glucose monitors. J Diabetes Sci Technol. 2010;4:499-504. [DOI] [PMC free article] [PubMed] [Google Scholar]
- 3. Boyd JC, Bruns DE. Quality specifications for glucose meters: assessment by simulation modeling of errors in insulin dose. Clin Chem. 2001;47(2):209-214. [PubMed] [Google Scholar]
- 4. Krouwer JS, Cembrowski GS. A review of standards and statistics used to describe blood glucose monitor performance. J Diabetes Sci Technol. 2010;4(1):75-83. [DOI] [PMC free article] [PubMed] [Google Scholar]
- 5. Hellman R. Proceedings of the First International Congress of the Bildirici Diabetes Center, Laniado Hospital, Netanya, Israel, December 21-23, 2009, part 3. Diabetes Metab Res Rev. 2012;28:207-209. [DOI] [PubMed] [Google Scholar]
- 6. Dietzen DJ, Denise A, Nenninger DA, Simmons DA. Analytic characteristics of three Bayer Contour blood glucose monitoring systems in neonates. J Diabetes Sci Technol. 2015;9(2):257-261. [DOI] [PMC free article] [PubMed] [Google Scholar]
- 7. McGrath RT, Donnelly VC, Glastras SJ, et al. Evaluation of blood glucose meter efficacy in an antenatal diabetes clinic. Diabetes Technol Ther. 2016;18(2):68-74. [DOI] [PubMed] [Google Scholar]
- 8. Bellary S, Cameron H, MacLeod K, et al. Clinical evaluation of a novel test strip technology for blood glucose monitoring: accuracy at hypoglycaemic glucose levels. Diabetes Res Clin Pract. 2012;98(3):430-435. [DOI] [PubMed] [Google Scholar]
- 9. Katz LB, MacLeod K, Grady M, Cameron H, Pfutzner A, Setford S. A comprehensive evaluation of strip performance in multiple blood glucose monitoring systems. Expert Rev Med Devices. 2015;12(3):263-271. [DOI] [PubMed] [Google Scholar]
- 10. Bailey T, Chang A, Rosenblit PD, et al. A comprehensive evaluation of the performance of the test strip technology for OneTouch© Verio™ Glucose Meter Systems. Diabetes Technol Ther. 2012;14(8):701-709. [DOI] [PubMed] [Google Scholar]
- 11. Klonoff DC, Lias C, Beck S, et al. Development of the Diabetes Technology Society blood glucose monitor system surveillance protocol. J Diabetes Sci Technol. 2016;10(3):697-707. [DOI] [PMC free article] [PubMed] [Google Scholar]
- 12. OneTouch© Verio™ IQ blood glucose monitoring system meets ISO 15197:2013 requirements. White paper, LFS-14-4051A. April 2014. Milpitas, CA: LifeScan Inc. [Google Scholar]
- 13. International Organization for Standardization. ISO 15197:2015, 30 June 2015. In vitro diagnostic test systems—requirements for blood-glucose monitoring systems for self-testing in managing diabetes mellitus. [Google Scholar]
- 14. Pfutzner A, Klonoff DC, Pardo S, Parkes JL. Technical aspects of the Parkes error grid. J Diabetes Sci Technol. 2013;7(5);1275-1281. [DOI] [PMC free article] [PubMed] [Google Scholar]
- 15. Krouwer JS, Monti KL. A simple, graphical method to evaluate laboratory assays. Eur J Clin Biochem. 1995;33:525-527. [PubMed] [Google Scholar]
- 16. Seaquist ER, Anderson J, Childs B, et al. Hypoglycemia and diabetes: a report of a workgroup of the American Diabetes Association and the Endocrine Society. Diabetes Care. 2013;36(5):1384-1395. [DOI] [PMC free article] [PubMed] [Google Scholar]
- 17. World Health Organization. Iron deficiency anaemia. assessment, prevention, and control. A guide for programme managers. WHO/NHD/01.3 2001. [Google Scholar]
- 18. Lao TT, Chan PL, Tam KF. Gestational diabetes mellitus in the last trimester—a feature of maternal iron excess? Diabetes Med. 2001;18:218-223. [DOI] [PubMed] [Google Scholar]
- 19. Robinson CS, Sharp P. Tighter accuracy standards within point-of-care blood glucose monitoring: how six commonly used systems compare. J Diabetes Sci Technol. 2012;6(3):547-554. [DOI] [PMC free article] [PubMed] [Google Scholar]
- 20. Salazar-Vazquez BY, Intaglietta M, Rodriguez-Moran M, Guerro-Romero F. Blood pressure and hematocrit in diabetes and the role of endothelial responses in the variability of blood viscosity. Diabetes Care. 2006;29:1523-1528. [DOI] [PubMed] [Google Scholar]
- 21. Teodorczyk M, Cardosi M, Setford S. Hematocrit compensation in electrochemical blood glucose monitoring systems. J Diabetes Sci Technol. 2012;6(3):648-655. [DOI] [PMC free article] [PubMed] [Google Scholar]
- 22. Fricke H. The electric capacity of suspensions of red corpuscles of a dog. Phys Rev. 1925;26(5):682-687. [Google Scholar]