Abstract
Identification of intracellular signal transduction pathways plays an important role in understanding the mechanisms of how cells respond to external stimuli. The availability of high throughput microarray expression data and accumulating knowledge of protein-protein interactions have provided us with useful information to infer condition-specific signal transduction pathways. We propose a novel method called Gibbs sampler to Infer Signal Transduction pathways (GIST) to search dys-regulated pathways from large-scale protein-protein interaction networks. GIST incorporates different knowledge sources to extract paths that are highly associated with biological phenotypes or clinical information. One of the most attractive features of GIST is that the algorithm will not only provide the single optimal path according to the defined cost function but also reveal multiple suboptimal paths as alternative solutions, which can be utilized to study the pathway crosstalk. As a proof-of-concept, we test our GIST algorithm on yeast PPI networks and the identified MAPK signaling pathways are well supported by existing biological knowledge. We also apply the GIST algorithm onto a breast cancer patient dataset to show its feasibility of identifying potential pathways for further biological validation.
I. Introduction
Signal transduction is a chain of processes triggered by external stimuli which result in a series of cellular responses such as change in post-transcriptional expression, cell proliferation or apoptosis, etc. Uncovering of signal transduction pathways in a living cell is essential to understand the mechanism of how different proteins interact with each other to form cascades of biochemical reactions. Typical pathway databases such as Kyoto Encyclopedia of Genes and Genomes (KEGG) contain a collection of pathway maps comprising of genomic and biochemical interactions. However, knowledge from databases such as KEGG is usually generic and without any biological context, which makes it hard to be interpreted in biological or clinical studies. Recently, the fast development of biotechnology has provided researchers with high throughput expression data and protein-protein interaction (PPI) data, which can be utilized for the inference of condition-specific signal transduction pathways.
Several methods have been proposed to identify signal transduction pathways using PPI data including Netsearch[1], random color coding[2], integer linear programming[3], etc. However these existing methods have some inherent limitations as follows: 1. Current methods are very sensitive to the pathway length and users need to try multiple experiments for selecting an appropriate length. This limits the application of these methods for inferring de novo signal transduction pathways where ground truth knowledge is lacking, such as in human cancer researches. 2. None of the existing methods addresses the problem of identifying potential alternative pathways or cross talk between two or more pathways.
In this paper, we propose a novel method, namely GIST, to infer signal transduction pathways using a Gibbs sampling strategy. From a sampling point of view, we convert the cost function, which is the aggregated evidence for all molecules in the path that starts from the membrane receptors to nuclear receptors (e.g. transcription factors), to a probability distribution. GIST is an effective method, which can extract multiple pathways and examine their interconnections using integrated data sources, including expression data, protein-protein data, clinical information and cellular locations of the proteins. Compared with the existing pathway identification methods, GIST has several advantages: 1. GIST is a computationally efficient method for pathway identification in large-scale PPI network. By using a Gibbs sampling strategy, GIST can identify a path of length 8 from yeast PPI data within several minutes, while it takes hours for methods such as random color coding; 2. GIST is not sensitive to the pathway length selection; 3. GIST can identify multiple distinct pathways between the selected membrane protein and transcription factor, which makes it possible to study alternative pathways or pathway cross talk. We demonstrate the success of the GIST algorithm by recovering the well-known MAPK signaling pathways using yeast PPI data. We also apply GIST onto a public breast cancer dataset to show the feasibility of the proposed algorithm for clinical cancer research.
The paper is organized as follows: in Section 2 we present the pathway model that incorporates multiple data sources and introduce the sampling framework using a Gibbs strategy. In Section 3 we show some case studies on yeast MAPK signaling pathways and further apply our algorithm to study a breast cancer patient dataset. Finally, in Section 4, we summarize the advantages of the proposed GIST algorithm in comparison to the existing methods and draw conclusions that the proposed algorithm can serve as a useful tool to infer signal transduction pathways for biological or clinical studies.
II. A Gibbs Sampler for inferring Signal Transduction Pathways
A. Solving the Pathway Identification Problem Using Gibbs Sampling
We define a pathway as a chain of molecules (genes or proteins) that starts at the membrane receptors and ends at nuclear transcription factors through which signal is transmitted in response to external stimulus or specific cellular condition. PPI data reflect the affinity of two protein molecules that bind together as protein complex to perform certain biological function. Based on PPI data, the inference of pathway can be naturally interpreted as looking for potential paths with strong evidence of signaling transduction from PPI network, given some membrane proteins and transcription factors.
We denote the PPI network as a weighted undirected graph as G(V,E,W) where vertex vi ∈ V is the i-th and ei, j ∈ E represents the edge between protein i and j. If protein i and j are connected in the PPI network, e i, j = 1; otherwise, ei,j = 0. wi, j ∈ W,i ≠ j is the weight of the edge connecting protein i and j; Specially for i = j, wi,j □ wi is defined as node weight for protein i. We define a pathway of length L as a directed path consisting L proteins denoted as ΘL = [θ1,…,θl,…, θL],1≤l≤L where θ1 is a membrane protein which we referred to as the “source” and θL is some transcription factor that we referred to as the “sink”. For 1<l<L, θl can only be connected to θ l−1 and θ l+1 where θ l−1 is the upstream protein of θl and θ l+1 is the downstream. Unlike protein-protein interactions without direction, signal transduction interactions between pathway members are directional, starting from the membrane to the nuclear. To impose this “directed path” concept on our algorithm, we use the cellular location information ui of protein i as the constraint. Hence the cost function of one pathway of length L is defined as:
| (1) |
and eθl,θl+1 = 1,1 ≤l<L.
In equation (1), the cost associated with a pathway is jointly determined by the selection of all proteins in the path. Hence, the pathway identification problem is equivalent to the searching of optimal ΘL that yields the maximum value of the cost function. Note that there could be multiple solutions of ΘL, for example denoted as and , where , which satisfy: . This suggests that there are multiple distinct pathways from the given source to the sink. Hence in order to get a comprehensive view of the signal transduction across the PPI network, we need to traverse the high dimensional solution space. However, as L increases, brute force searching becomes infeasible. To solve this problem, we propose a Gibbs strategy to efficiently sample the pathways from the solution space.
By normalizing function f(ΘL) using a constant K we can convert the cost function to a probability distribution as follows:
| (2) |
Searching ΘL that maximizes the cost function in equation (1) is equivalent to finding samples with the highest probability density as in equation (2). Instead of directly sampling the vector ΘL from the joint distribution p(ΘL), we utilize a Gibbs strategy [4, 5] to sample the value of θl from the conditional distribution of θl based on the current value of all other nodes θm, m ≠ l. The Gibbs sampling technique is drawing samples according to the following manner:
| (3) |
where t is the number of the iteration. The empirical distribution constructed by samples from the Gibbs sampler well approximates the joint distribution p(ΘL) when the number of iterations is large enough. Based on the estimated p(ΘL), we can determine the most likely signal transduction pathways inferred from the integrated data.
B. Avoiding Local Optima by Increasing Step-size of the Sampler
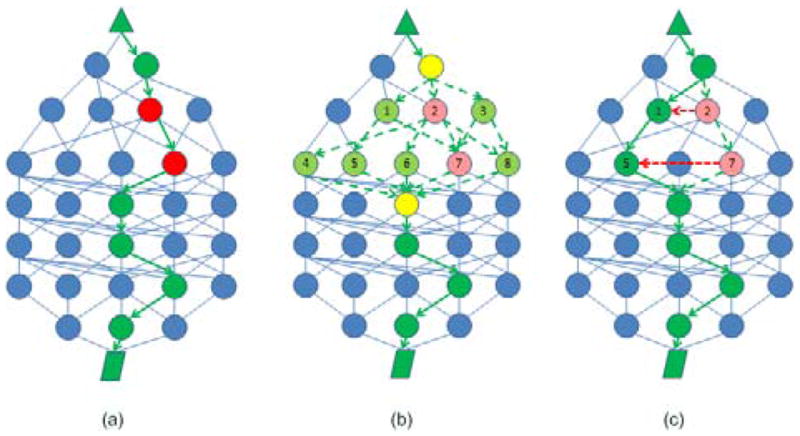
The proposed sampling process draws one sample for each node in the path according to the conditional distribution with the following constraints: the newly selected node should be connected to its direct upstream and downstream nodes in the protein-protein interaction network. We define the above Gibbs sampler has a unit step-size of 1 considering that each time it only updates one node in the path. However, if the cost function is very complicated with many local dents, the searching algorithm may be trapped into local optima when starting from an inappropriate initialization. To prevent the proposed sampler from being trapped in the local optima, we increase the step-size to 2 by sampling a pair of connected nodes in the path conditioned on the rest of the nodes in the current path as is shown in Fig. 1.
Fig. 1.

Sampling a pair of nodes in the pathway using a Gibbs sampler of step-size 2. Fig. 1(a) shows the selection of the current path between the source and sink. In Fig. 1(b), one pair of nodes is selected from all possible pairs. Fig. 1(c) shows the path is updated using the newly sampled nodes.
Fig. 1(a). illustrates a protein-protein network with the selected source (triangle) and sink (diamond). The current pathway is highlighted using green color and we need to update two connected nodes (marked red, corresponding to node 2 and 7 in Fig. 1(b)) in the current path. Fig. 1(b). shows that based on the PPI network structure between the nearest neighbors (marked yellow) of node 2 and 7, we have in total 8 possible pairs for selection which are (1,5), (1,7), (2,4), (2,6), (2,7), (2,8), (3,7) and (3,8). By sampling from the conditional distribution of the 8 pairs of nodes, we select one (e.g. nodes 1 and 5), to update the current pair (2,7) as is shown in Fig. 1(c). By increasing the step-size, we make it easier for the searching algorithm to jump out of local optima.
III. Experiments and Results
A. Yeast Protein-Protein Interaction Data
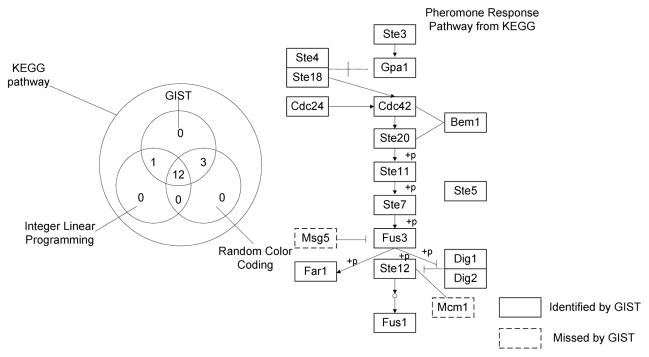
We tested our GIST algorithm on yeast PPI data set to validate its efficacy of extracting biological meaningful signal transduction pathways. The protein-protein interaction network was obtained from the Database of Interacting Protein (DIP) which contained 4389 proteins with 14,319 interactions[6]. We took the MAPK signaling pathways inference as a case study and compared GIST to the integer linear programming (ILP) and random color coding method with regard to their performance in detecting known yeast pathways. We first tested the GIST algorithm on pheromone response pathway using Ste3 as the source and Ste12 as the sink. From the Venn diagram shown in Fig. 2, the identified pathway from GIST is the most consistent with the canonical pathway from KEGG database. GIST detected all 12 proteins in the KEGG pathway that were also detected by the other two methods. Meanwhile GIST was able to identify proteins which were supported by the KEGG database but was not detected by ILP (Gpa1, Dig1 and Dig2) or random color coding (Ste20).
Fig. 2.
Computational results for identifying pheromone response pathway. The left panel is a Venn diagram comparing the identified molecules that are included in KEGG database from the three methods. The right panel shows the entire pheromone response pathway extracted from KEGG database.
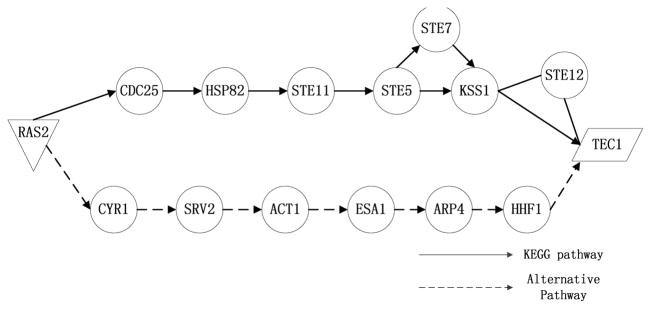
We further demonstrate how GIST identifies multiple pathways in yeast PPI data. We used GIST to detect yeast filamentation growth pathway between membrane protein Ras2 and transcription factor Ste12. Fig. 3 shows the identified pathways between the source and sink.
Fig. 3.
Multiple pathways are identified for yeast filamentation growth pathway using GIST. The pathway connected by solid arrow is overlapped with the canonical yeast filamentation pathway from KEGG. The pathway connected by dashed arrow is the alternative pathway that was identified by GIST algorithm.
From Fig. 3 we see that GIST found two distinct pathways between protein Ras2 and Tec1. The upper path which includes Ste5, Ste7, Kss1 and Ste12 can be well supported by KEGG database and was also detected by ILP and random color coding. In addition to the above path that was discovered by all three methods, GIST was able to detect one unique path that was missed by both competing methods: RAS2 -> CYR1 -> SRV2 -> ACT1 -> ESA1 -> ARP4 -> HHF1. It has been studied that RAS2, CYR1 and SRV2 are associated with cAMP-protein kinase A (PKA) pathway, which is known to be important for cell growth and stress resistance [7]. Moreover, it is also studied that both MAP kinase and cAMP can affect filamentation process of yeast cells, as mutations of either pathway will affect a cell surface protein [8], which again supports the cross-talk between two pathways. Several enriched function items (shown in Table. 1) such as stress response, cell growth and filamentation growth further suggests the relevance of discovered pathway.
Table 1.
Functional Analysis of The Alternative Path for Filamentation Growth
| GO Term Name | p-value |
|---|---|
| filamentous growth of a population of unicellular organisms | 0.00981 |
| cellular response to stimulus | 0.00286 |
| Ras protein signal transduction | 0.00155 |
| growth | 0.00129 |
| histone modification | 0.00032 |
Finally, to test GIST for pathway inference on clinical research, we applied our method to a public breast cancer dataset [9] which had samples from two conditions: early relapse patients and late relapse patients. For each gene or protein in the network, we calculated its t-test p-value between two conditions and converted the p-value to z-score as the node score. The edge z-score was calculated from the p-value of the correlation coefficient between the expressions of the two proteins in the network. Instead of using solely protein-protein interaction data from HRPD database, we also downloaded binary pathway interaction data from 3 databases: Reactome, NCI/Nature Pathway Interaction Database and MSKCC Cancer Cellmap. The entire PPI/Pathway network contains 9,264 proteins and 68,111 interactions. Moreover, we also collected the cellular location information of each protein using Ingenuity Pathway Analysis software. We heuristically set the maximum length of the pathway to be 10 and ran the Gibbs sampler for 5,000 iterations.
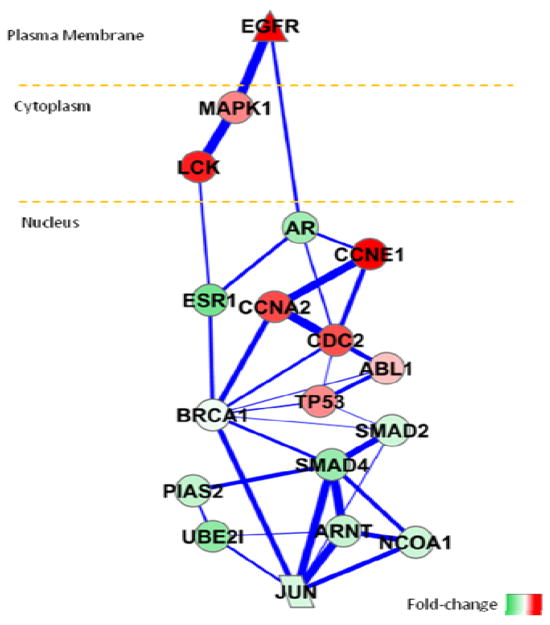
Even with the skeleton pathway inferred by proposed method (shown in Fig. 4.), functional activities related with cancer is highly enriched in KEGG database (Pathways in cancer, FDR=2.48E-06%). The collection of red nodes, which indicate up-regulated genes in early relapse patients, mainly consists of genes responsible for cell-cycle and DNA-damage processes, such as CCNE1, CCNA2 and TP53 (Cell cycle, FDR = 8.25E-04%). By checking the genes up-regulated in late relapse patients, which have green color, some signaling relationships are enriched (ErbB signaling pathway, FDR=1.9%). Furthermore, the recurrence of breast cancer has been associated with the up-regulation of epidermal growth factor receptor (EGFR) and activation of mitogen activated protein kinase (MAPK) pathway [10]. Possible anti-estrogen mechanism is also explained by cross-talk between EGFR and ESR1 (estrogen-receptor alpha) signaling pathways through experimental study [11]. From the inferred pathway, it is also interesting to observe that ESR1 and androgen receptor (AR) can potentially interact with each other, and both of them are over-expressed in late relapse patients. Our computational results are well supported by a recent patient study that AR in estrogen receptor (ER)-positive breast tumors is a prognostic maker, associated with better clinical outcome and lower proliferation activities [12].
Fig. 4.
The identified pathway between EGFR and JUN for Loi’s breast cancer dataset. The color of the node reflects log2 fold-change between early and late relapse patients. The line width is proportional to the sampling frequency of the specific edge by GIST algorithm. The pathway components are laid out according to their cellular locations.
IV. Conclusions
In this paper, we propose a novel method to infer intracellular signal transduction pathways using Gibbs sampling. Our method, namely GIST, has effectively revealed MAPK signaling pathways in yeast data and can be utilized to study pathway cross-talk. We have demonstrated the feasibility of GIST on a breast cancer dataset and we plan to carry out more experiments for a comprehensive study of breast cancer datasets.
Acknowledgments
This research was supported in part by NIH grants (CA139246, CA149653, CA149147 and NS29525-18A).
Contributor Information
Jinghua Gu, Department of Electrical and Computer Engineering in Virginia Polytechnic Institute and State University. Now working in Computational Bioinformatics and Bio-imaging Laboratory, Arlington, VA 22203.
Chen Wang, Department of Electrical and Computer Engineering in Virginia Polytechnic Institute and State University. Now working in Computational Bioinformatics and Bio-imaging Laboratory, Arlington, VA 22203.
Ie-Ming Shih, Department of Pathology at John Hopkins University. Now working in Laboratory of Molecular Genetics of Female Reproductive Cancer, Baltimore, MD 21231.
Tian-Li Wang, Department of Pathology at John Hopkins University. Now working in Laboratory of Molecular Genetics of Female Reproductive Cancer, Baltimore, MD 21231.
Yue Wang, Department of Electrical and Computer Engineering in Virginia Polytechnic Institute and State University. Now working in Computational Bioinformatics and Bio-imaging Laboratory, Arlington, VA 22203.
Robert Clarke, Department of Oncology at Georgetown University. He is now working in Clarke Lab, Washington DC, 20057.
Jianhua Xuan, Department of Electrical and Computer Engineering in Virginia Polytechnic Institute and State University. Now working in Computational Bioinformatics and Bio-imaging Laboratory, Arlington, VA 22203.
References
- 1.Steffen M, et al. Automated modelling of signal transduction networks. BMC Bioinformatics. 2002 Nov 1;3:34. doi: 10.1186/1471-2105-3-34. [DOI] [PMC free article] [PubMed] [Google Scholar]
- 2.Scott J, et al. Efficient algorithms for detecting signaling pathways in protein interaction networks. J Comput Biol. 2006 Mar;13:133–44. doi: 10.1089/cmb.2006.13.133. [DOI] [PubMed] [Google Scholar]
- 3.Zhao XM, et al. Uncovering signal transduction networks from high-throughput data by integer linear programming. Nucleic Acids Res. 2008 May;36:e48. doi: 10.1093/nar/gkn145. [DOI] [PMC free article] [PubMed] [Google Scholar]
- 4.Casella GaG, EI Explaining the Gibbs sampler. The American Statistician. 1992;46:167–174. [Google Scholar]
- 5.Lawrence CE, et al. Detecting subtle sequence signals: a Gibbs sampling strategy for multiple alignment. Science. 1993 Oct 8;262:208–14. doi: 10.1126/science.8211139. [DOI] [PubMed] [Google Scholar]
- 6.Deane CM, et al. Protein interactions: two methods for assessment of the reliability of high throughput observations. Mol Cell Proteomics. 2002 May;1:349–56. doi: 10.1074/mcp.m100037-mcp200. [DOI] [PubMed] [Google Scholar]
- 7.Tamaki H. Glucose-stimulated cAMP-protein kinase A pathway in yeast Saccharomyces cerevisiae. J Biosci Bioeng. 2007 Oct;104:245–50. doi: 10.1263/jbb.104.245. [DOI] [PubMed] [Google Scholar]
- 8.Rupp S, et al. MAP kinase and cAMP filamentation signaling pathways converge on the unusually large promoter of the yeast FLO11 gene. EMBO J. 1999 Mar 1;18:1257–69. doi: 10.1093/emboj/18.5.1257. [DOI] [PMC free article] [PubMed] [Google Scholar]
- 9.Loi S, et al. Definition of clinically distinct molecular subtypes in estrogen receptor-positive breast carcinomas through genomic grade. J Clin Oncol. 2007 Apr 1;25:1239–46. doi: 10.1200/JCO.2006.07.1522. [DOI] [PubMed] [Google Scholar]
- 10.Hutcheson IR, et al. Oestrogen receptor-mediated modulation of the EGFR/MAPK pathway in tamoxifen-resistant MCF-7 cells. Breast Cancer Res Treat. 2003 Sep;81:81–93. doi: 10.1023/A:1025484908380. [DOI] [PubMed] [Google Scholar]
- 11.Shin A, et al. Population attributable fraction of infection-related cancers in Korea. Ann Oncol. 2011 Mar 8; doi: 10.1093/annonc/mdq592. [DOI] [PubMed] [Google Scholar]
- 12.Park S, et al. Androgen receptor expression is significantly associated with better outcomes in estrogen receptor-positive breast cancers. Ann Oncol. 2011 Mar 11; doi: 10.1093/annonc/mdq678. [DOI] [PubMed] [Google Scholar]


