Abstract
Cryo-electron microscopy is a fast emerging biophysical technique for structural determination of large protein complexes. While more atomic structures are being determined using this technique, it is still challenging to derive atomic structures from density maps produced at medium resolution when no suitable templates are available. A critical step in structure determination is how a protein chain threads through the 3-dimensional density map. A dynamic programming method was previously developed to generate K best matches of secondary structures between the density map and its protein sequence using shortest paths in a related weighted graph. We discuss challenges associated with the creation of the weighted graph and explore heuristic methods to solve the problem of matching secondary structures.
Keywords: protein, algorithms, cryo-electron microscopy, graph, secondary structure, topology, heuristic
I. INTRODUCTION
A biophysical technique with great potential to derive the three-dimensional structure of large protein complexes is known as cryo-electron microscopy (cryo-EM) [1]. Although many atomic structures have been determined from cryo-EM density maps (also referred as 3D images), it is still challenging to obtain atomic structure for those density maps with medium resolutions. At medium resolutions such as 5–10 Å range, the backbone of the protein is not resolved, it is difficult to determine the atomic structure directly from such cryo-EM density maps. At medium resolutions, the most visible characteristic features are secondary structures such as α-helices and β-sheets. Various computational methods have been developed to detect secondary structures [2–9]. We recently showed that it is possible to predict the orientation of β-strands once a β-sheet is identified [10]. In addition to secondary structures, possible connections among secondary structures can be predicted from skeleton of the 3D image [11, 12]. On the other hand, various methods and online servers exist to predict secondary structure segments from a protein sequence [13, 14].
Unlike a high-resolution cryo-EM density map, a density map at a medium resolution contain many errors in the density and ambiguous spots. A detected α-helix or a β-sheet may be shifted and/or could be smaller/larger than expected. Some spots in a 3D image are not resolved at medium resolutions, and it is expected that the skeleton will contain wrong connections. The accuracy of secondary structure prediction from a protein sequence is about 80% [15]. In order to derive the structure from such data, potential errors need to be modeled in the computational methods. However this means significant increase in computational time.
Since secondary structures are major components of a protein, a natural way to trace a protein chain through 3D cryo-EM image is to utilize secondary structures. By matching the secondary structures that are detected in the 3D image with those predicted from the amino acid sequence, one may follow the backbone trace in the image. Two computational methods have been previously developed using the concept of graph. One method, implemented in Gorgon, uses graph matching and A* search to find the optimal matches [16]. Another method, implemented in DP-TOSS, find constrained shortest paths from a topology graph. DP-TOSS uses a dynamic programming algorithm and K-shortest path algorithm to find K best matches [17, 18]. We recently developed Multi-DP-TOSS to take consideration of potential error from the secondary structure detections [19, 20].
Deterministic approaches such as those using dynamic programming guarantee finding optimal solutions but may not be effective enough in a large system. We explore some heuristic approaches in this paper and discuss the challenges in the secondary structure matching problem. We hope our analysis will benefit future design of a more effective approach.
2. METHODOLOGY
A. The topology graph for matching secondary structures
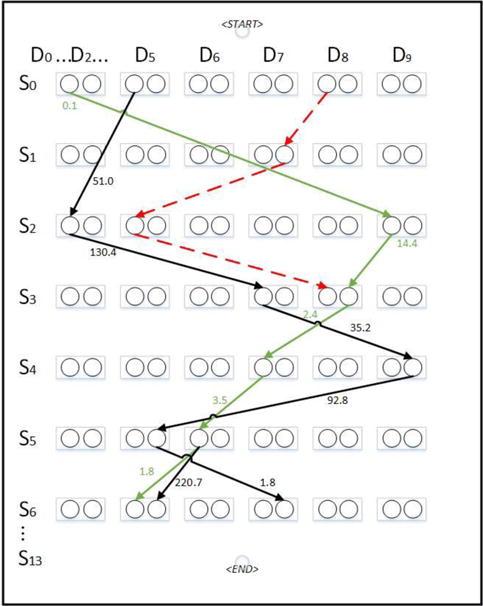
The secondary structure matching problem can be formulated using a topology graph [17, 18]. Although the graph applies to both helices and β-strands, we focus on helices in this paper for simplicity of discussion. Let S = (S1, S2, …, SM) be a tuple of secondary structure segments on the protein sequence. Let D = {D1, D2, …, DN} be a set of the secondary structure traces detected from the 3D image. The matching between the protein sequence and the 3D image at the secondary structural level can be formulated into a graph problem. Let G = (V, E, w) be a weighted directed graph. A regular node in the graph (i, j, t) represents an assignment of sequence segment Si to stick Dj in t direction. As an example, node (5, 5, 1) represents the situation when helix S5 on the protein sequence is assigned to helix stick D5 in direction 1. Note there are only two directions to thread a protein sequence through a helix stick. An edge from node (i, j, t) to (i′, j′, t′) represents the assignment of Si, to Dj, in direction t′ right after the assignment of Si to Dj in direction t [18]. There are two special nodes START and END. The problem of finding the best match is to find a shortest path that satisfies constraints and has the minimum score. The major constraint is that each column can be visited at most once, and each row can be visited at most once (Figure 1). The edge weight represents the difference between two geometric distances, one calculated from two consecutive helices in the 3D image using skeleton, one estimated from the protein sequence (see Section C in Results and Discussions). A low weight represents that an edge is likely a correct mapping between two helix sticks in the image and two consecutive helices on the sequence.
Fig. 1.

An illustration of the weighted graph of protein 1BJ7 (PDB ID). Selected rows and columns of the graph are shown. Although each node often has multiple outgoing edges, only a few are shown for clarity of viewing. Edges on the optimal path are shown in green. Edges in an invalid path is shown in red dashed line.
B. Low-weight set heuristic method
To analyze the nature of the space of all potential matches which are Hamiltonian paths in the topology graph, one can generate random paths in the topology graph. A simple way to do that is to repeatedly pick edges randomly from row i to row i′ to maintain a valid partial path. Naturally the method will not successfully produce Hamiltonian path always, but if the graph has sufficient Hamiltonian paths it would likely find some.
Low-weight edges are important in the graph, since a low-weight edge suggests a locally good match between the geometry in the 3D image and that in the protein sequence. The intuition is that an optimal path is consist of multiple locally good matches. A set of edges with weights lower than a threshold was constructed. Paths are randomly constructed from the top to bottom of the graph using edges from the set. After creating a number of low-weight paths, we can compare the weight of each path to rank the best match of the image and sequence.
Although the idea is simple, the size of the set is an important parameter. Ideally enough low-weight edges need to be included in the set so that many paths can be completed from the top to the bottom of the graph. However, having too many edges will increase the overhead of computing. We implemented a heuristic way to generate a small number of paths randomly and evaluate the usage of edges. Having the same path generated multiple times is an indication that the size of the set is too small. On the other hand, in order to prevent the set from growing too large, we check the weights of the paths being generated. If high-weight paths are being generated, this is a sign that the set is too large. Using this information, a relatively good size for the low weight set can be estimated.
3. RESULTS AND DISCUSSIONS
The heuristic approach using low-weight set was tested on seven cases. Each test case has an atomic structure downloaded from the Protein Data bank (PDB) and its corresponding 3D image. The 3D image was simulated to 8Å in Chimera [21] using the PDB structure for six cases (PDB ID: 3LTJ, 1BJ7, 1FLP, 1ICX, 1HZ4, and 3ODS). A 3D image was downloaded from Electron Microscopy Data Bank (EMDB) [22] and extracted for a single chain in one case (EMDB ID: 5030). SSETracer was applied to detect the secondary structures in the 3D image [7]. Since this paper focuses on computational aspects of the approaches, only chains or a segment of a chain that has only helices (no beta-strands) were used in the dataset. The number of helices in the dataset range from seven to 21. Gorgon was used to derive the skeleton from the 3D image [23]. Multi-DP-TOSS was used as the deterministic method to derive K best matches of secondary structures between the 3D image and the protein sequence [19, 20]. Although Multi-DP-TOSS is capable to take sequence-based secondary structure predictions from multiple prediction servers, only the sequence segments based on the PDB structure was used in the work of this paper.
A. Low-weight edges along an optimal path
We explored the performance of a heuristic method using a set of low-weight edges. We noticed that a simple heuristic method can perform well for some proteins. As an example for 1FLP (Table 1), both Multi-DP-TOSS and the low-weight set methods rank the correct match of the secondary structures at the 2nd on their own list. Multi-DP-TOSS is a dynamic programming method to find the K best matches. Note that both Multi-DP-TOSS and Low-weight Set use the same scoring method in evaluating a match. In this test, K is100. Similar results are obtained for the four other proteins. It is possible that these proteins have clear connectivity between secondary structures, and the correct match can be distinguished either from a heuristic method or a dynamic programming method. Since the heuristic method uses a simple idea to utilize those edges with low edge weights, the success in these cases indicates that the low-weight edges often represent the correct relationship among secondary structures. In these five cases, all the edges in the correct path are low-weight edges and are included in the low-weight set. Our test suggests that if the low-weight edges have good accuracy, a simple heuristic method can achieve the task as a dynamic programming method, but possibly in less time (Table 1).
Table 1.
Comparison between Multi-DP-TOSS and the Low-weight Set approach.
| IDa | Helicesb | Sticksc | Topd | TimeDe | TimeHf | RankingHg | RankingDh |
|---|---|---|---|---|---|---|---|
| 3LTJ | 16 | 12 | 40/100 | 94.3 s | 1.35 s | 2 | 2 |
| 1BJ7 | 14 | 10 | 97/100 | 7.9 s | 0.16 s | 6 | 6 |
| 1FLP | 7 | 7 | 100/100 | 4.2 s | 0.03 s | 2 | 2 |
| 1ICX | 12 | 10 | 81/100 | 1.1 s | 26.27 s | 2 | 2 |
| 5030 | 7 | 7 | 100/100 | 18.2 s | .13 s | 1 | 1 |
| 1HZ4 | 21 | 19 | 0/100 | 1625 s | N/A | N/A | 15 |
| 3ODS | 21 | 16 | 2/100 | 215.5 s | N/A | N/A | >100 |
The PDB ID with chain;
The number of detected helices in the sequence;
The number of detected helices (sticks) in the image;
The number paths found that are in the top 100 best paths determined using Multi-DP-TOSS;
The time taken in seconds to find the paths displayed in column fourd;
The time needed to find the true path by the heuristic method in seconds; N/A: not found
The ranking of the true path by the heuristic method; N/A: the true path not ranked within top 100.
The ranking of the true path by the deterministic method using Multi-DP-TOSS [20];
B. Challenges with high-weight edges
In principle, an optimal path should have all low-weight edges. However, when the 3D image has ambiguity in inter-connection between secondary structures, it is possible that the correct connection does not have low-edge weight. If a critical high weight edge is not among the set of low edges, the correct path will never be found using the low-edge set method. We observed that this is the main reason for the low-weight set method to fail on the two cases. (Table 1). Note that the mistake in edge weight assignment is a challenge for both the heuristic method and deterministic method. In the case of 1HZ4 and 3ODS for which the low-weight set did not rank the correct path among top 100, the correct path is ranked the 15th and beyond 100 when the deterministic method Multi-DP-TOSS was used. Enhanced edge weight assignment is needed for a faster and more accurate method in secondary structure matching problem.
C. Gap penalty, skeleton image, and missed helices
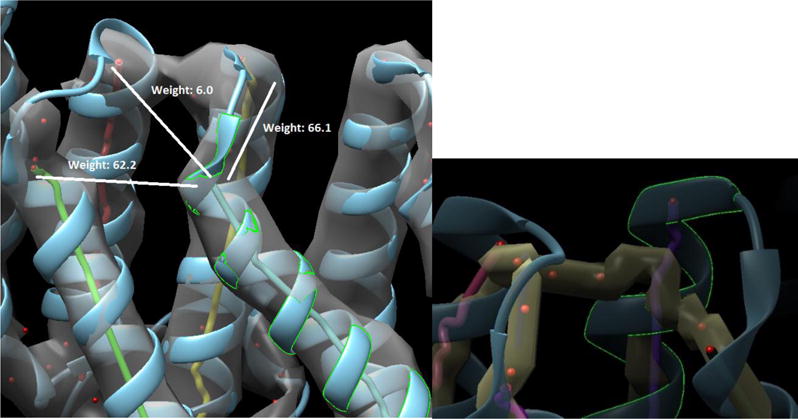
The main idea in weight assignment of the graph is to use the skeleton derived from the 3D image as an estimation of the distance between two secondary structures. It also uses the loop-length, in terms of the number of amino acids, as an estimation of the distance between two secondary structures on the protein sequence. The edge weight is primarily based on the difference between such two distances estimated. In cases where the skeleton image does not connect two sticks within a threshold distance, a “gap penalty” is assigned to the edge weight to indicate that the edge is not an ideal candidate. Unfortunately, due to the poor resolution of the density image, sometimes an edge in the correct path will not be represented by the skeleton. In Figure 2, a problem with the gap penalty assignment can be observed. In this case, the correct path is given a weight of 66.1 while an incorrect edge is weighted 6.0, since there is a gap in skeleton for the correct connection and there is no gap in the wrong connection. This vast difference in weight makes the true path very difficult to find. Although the gap penalty logic works in many cases, the weighting system needs to be more robust to account for various situations.
Fig. 2.

An example of high-weight edge, wrong connection in the 3D image, and short skeleton in protein 3ODS (PDB ID). Top: Superposition of the 3D image (gray), the atomic structure (ribbon), the helices detected using SSETracer (lines of different colors), and the connection trace points (red points). Edge weights are labeled for three possible connections out of the selected helix (highlighted in green). Bottom: A zoom-in view from a different perspective for the same region showing the skeleton (yellow) has a wrong connection and a gap in the true connection. The skeleton is shorter than the chain path at a turn.
Another problem we observed is that skeleton does not always span the entire length of a helix. One can observe that the helix highlighted in green extends much higher than the skeleton image in yellow (Figure 2 bottom panel). This “shorter skeleton” problem tends to happen at the turn of a chain where high-density voxels exist in an extended region near the turn. Due to the fact that the skeleton image is not as long as the detected helix stick (purple in Figure 2 bottom panel), a gap penalty is assigned to the edge of correct connection.
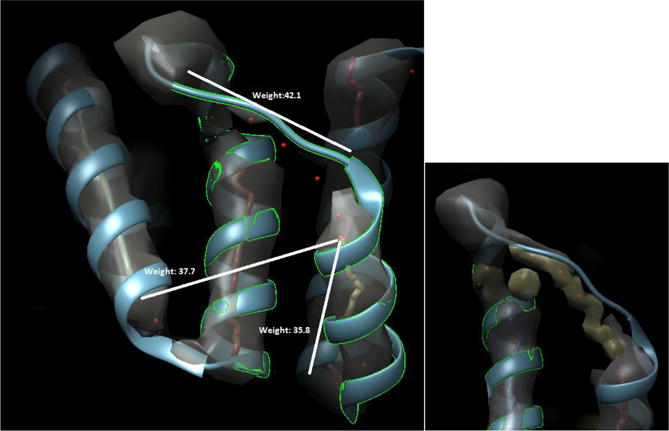
An incorrect gap penalty can be assigned for multiple reasons. In Figure 2, the gap penalty can be attributed to the incorrect skeleton. In Figure 3 however, an incorrect gap penalty was assigned due to a miss-detected short helix. The helix of length 3 (247–249) in 1HZ4 was not detected from the 3D image.
Fig. 3.

An example of an undetected short helix and the assignment of gap penalty for protein 1HZ4. The detected helix (middle red line in top panel) is shorter than the helix ribbon because a length 3 helix (amino acid 247 to 249) is missed. A gap penalty is assigned to the true edge because the skeleton image (yellow in bottom panel) does not connect the two helix sticks. Figure 3 uses same color scheme as Figure 2.
D. Alternative heuristic methods
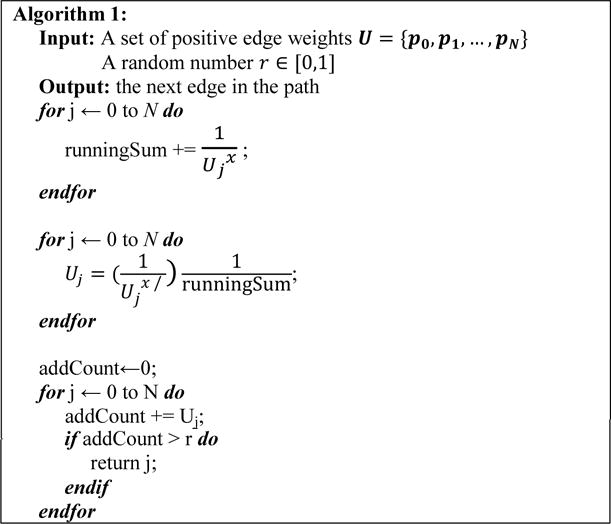
Although the low-weight set is the best performing heuristic methods among the three we have tried, we would like to discuss two other alternatives by associating a probability for each edge. In these methods, edges with low weights were given a higher probability to be used when creating paths. Creating a path one edge at a time from beginning to end. Each next valid edge is first placed in a set, and an edge is selected based on the probability in (1).
| (1) |
In (1), wi is the weight of the i-th valid edge, N is the number of valid edges, and x is a parameter decided by the user. When x is a large number, low edges are very likely to be chosen. The pseudo code found in Figure 4 describes the logic when assigning probability to edges. If the chosen edge results in no next edges being valid, then the path generation will restart from the beginning. Alternatively, the probability of an edge can be assigned using (2).
| (2) |
In this case, Wmax is equal to the highest next valid weight, Wi is the current weight, Δ is a very small constant, and N is the number of valid edges.
Fig. 4.

Pseudo code for selecting an edge based on associated probability in (1).
4. CONCLUSION
Matching secondary structures between a 3D cryo-EM image and its protein sequence is an important step in de novo modeling in which no suitable template structure is available. The matching problem can be formulated as a constraint shortest path problem in a topology graph. One purpose of this paper is to illustrate challenges in accurate representation of the matching problem. Although the correct matching was ranked high on the list for five of the seven cases tested in this paper, certain edge weights were not correctly assigned in two cases due to the quality of the 3D image. Current computation methods in detecting skeleton and secondary structures are not robust enough for the ambiguous regions in the 3D image. More robust methods are needed in edge weight assignment. Finding best matches in realistic situations involves modeling potential inaccuracy in the secondary structures either detected from the 3D image or from the protein sequence. However, this brings significant computational overhead. We have explored three heuristic approaches. We show that a simple idea using low-weight set is capable of finding best matches for those proteins that do not have significant problems in edge weight assignment. Our exploration in heuristic methods and the investigation of the edge weight assignment will benefit future design of more accurate methods in secondary structure matching.
Acknowledgments
This work is partially supported by NSF DBI-1356621, NIH R01-GM062968, and Undergraduate Research Fellowship to Devin Haslam from the Honors College of Old Dominion University.
References
- 1.Hryc CF, Chen DH, Chiu W. Near-Atomic-Resolution Cryo-EM for Molecular Virology. Curr Opin Virol. 2011 Aug 1;1:110–117. doi: 10.1016/j.coviro.2011.05.019. [DOI] [PMC free article] [PubMed] [Google Scholar]
- 2.Jiang W, Baker ML, Ludtke SJ, Chiu W. Bridging the information gap: computational tools for intermediate resolution structure interpretation. J Mol Biol. 2001 May;308:1033–44. doi: 10.1006/jmbi.2001.4633. [DOI] [PubMed] [Google Scholar]
- 3.Dal Palu A, He J, Pontelli E, Lu Y. Identification of Alpha-Helices from Low Resolution Protein Density Maps. Proceeding of Computational Systems Bioinformatics Conference(CSB) 2006:89–98. [PubMed] [Google Scholar]
- 4.Baker ML, Ju T, Chiu W. Identification of secondary structure elements in intermediate-resolution density maps. Structure. 2007 Jan;15:7–19. doi: 10.1016/j.str.2006.11.008. [DOI] [PMC free article] [PubMed] [Google Scholar]
- 5.Zeyun Y, Bajaj C. Computational Approaches for Automatic Structural Analysis of Large Biomolecular Complexes. IEEE/ACM Transactions on Computational Biology and Bioinformatics. 2008;5:568–582. doi: 10.1109/TCBB.2007.70226. [DOI] [PubMed] [Google Scholar]
- 6.Kong Y, Ma J. A structural-informatics approach for mining beta-sheets: locating sheets in intermediate-resolution density maps. J Mol Biol. 2003 Sep 12;332:399–413. doi: 10.1016/s0022-2836(03)00859-3. [DOI] [PubMed] [Google Scholar]
- 7.Si D, He J. BCB’13: Proceedings of ACM Conference on Bioinformatics. Computational Biology and Biomedical Informatics; Washington, D.C.: 2013. Beta-sheet Detection and Representation from Medium Resolution Cryo-EM Density Maps; pp. 764–70. [Google Scholar]
- 8.Si D, Ji S, Nasr K Al, He J. A machine learning approach for the identification of protein secondary structure elements from electron cryo-microscopy density maps. Biopolymers. 2012 Sep;97:698–708. doi: 10.1002/bip.22063. [DOI] [PubMed] [Google Scholar]
- 9.Rusu M, Wriggers W. Evolutionary bidirectional expansion for the tracing of alpha helices in cryo-electron microscopy reconstructions. J Struct Biol. 2012 Feb;177:410–9. doi: 10.1016/j.jsb.2011.11.029. [DOI] [PMC free article] [PubMed] [Google Scholar]
- 10.Si D, He J. Tracing beta-strands using strandtwister from cryo-EM density maps at medium resolutions. Structure. 2014;22(11):1665–76. doi: 10.1016/j.str.2014.08.017. [DOI] [PubMed] [Google Scholar]
- 11.Ju T, Baker ML, Chiu W. Computing a family of skeletons of volumetric models for shape description. Comput Aided Des. 2007 May;39:352–360. doi: 10.1016/j.cad.2007.02.006. [DOI] [PMC free article] [PubMed] [Google Scholar]
- 12.Al Nasr K, Liu C, Rwebangira M, Burge L, He J. Intensity-based skeletonization of CryoEM gray-scale images using a true segmentation-free algorithm. IEEE/ACM Trans Comput Biol Bioinform. 2013 Sep-Oct;10:1289–98. doi: 10.1109/TCBB.2013.121. [DOI] [PMC free article] [PubMed] [Google Scholar]
- 13.Jones DT. Protein secondary structure prediction based on position-specific scoring matrices. J Mol Biol. 1999 Sep;292:195–202. doi: 10.1006/jmbi.1999.3091. [DOI] [PubMed] [Google Scholar]
- 14.Cheng J, Randall AZ, Sweredoski MJ, Baldi P. SCRATCH: a protein structure and structural feature prediction server. Nucleic Acids Res. 2005 Jul 1;33:W72–6. doi: 10.1093/nar/gki396. [DOI] [PMC free article] [PubMed] [Google Scholar]
- 15.McGuffin LJ, Bryson K, Jones DT. The PSIPRED protein structure prediction server. Bioinformatics. 2000 Apr;16:404–5. doi: 10.1093/bioinformatics/16.4.404. [DOI] [PubMed] [Google Scholar]
- 16.Abeysinghe S, Ju T. Shape modeling and matching in identifying protein structure from low resolution images. Proceedings of the 2007 ACM symposium on Solid and physical modeling Beijing, China. 2007:223–32. [Google Scholar]
- 17.Al Nasr K, Ranjan D, Zubair M, He J. Ranking valid topologies of the secondary structure elements using a constraint graph. J Bioinform Comput Biol. 2011 Jun;9:415–30. doi: 10.1142/s0219720011005604. [DOI] [PubMed] [Google Scholar]
- 18.Al Nasr K, Ranjan D, Zubair M, Chen L, He J. Sovling the secondary structure matching problem in cryo-EM de novo modeling using a constrained K-shortest path graph algorithm. IEEE/ACM Trans Comput Biol Bioinform. 2014;11:419–29. doi: 10.1109/TCBB.2014.2302803. [DOI] [PubMed] [Google Scholar]
- 19.Biswas A, Ranjan D, Zubair M, He J. A Dynamic Programming Algorithm for Finding the Optimal Placement of a Secondary Structure Topology in Cryo-EM Data. Journal of Computational Biology. 2015;22:837–843. doi: 10.1089/cmb.2015.0120. 2015/09/01. [DOI] [PubMed] [Google Scholar]
- 20.Biswas A, Ranjan D, Zubair M, Zeil S, Nasr KA, He J. An Effective Computational Method Incorporating Multiple Secondary Structure Predictions in Topology Determination for Cryo-EM Images. IEEE/ACM Transactions on Computational Biology and Bioinformatics. 2016;PP:1–1. doi: 10.1109/TCBB.2016.2543721. [DOI] [PMC free article] [PubMed] [Google Scholar]
- 21.Pettersen EF, Goddard TD, Huang CC, Couch GS, Greenblatt DM, Meng EC, et al. UCSF Chimera—A visualization system for exploratory research and analysis. Journal of Computational Chemistry. 2004;25:1605–1612. doi: 10.1002/jcc.20084. [DOI] [PubMed] [Google Scholar]
- 22.Lawson CL, Baker ML, Best C, Bi C, Dougherty M, Feng P, et al. EMDataBank.org: unified data resource for CryoEM. Nucleic Acids Res. 2011 Jan;39:D456–64. doi: 10.1093/nar/gkq880. [DOI] [PMC free article] [PubMed] [Google Scholar]
- 23.Baker ML, Abeysinghe SS, Schuh S, Coleman RA, Abrams A, Marsh MP, et al. Modeling protein structure at near atomic resolutions with Gorgon. Journal of Structural Biology. 2011;174:360–373. doi: 10.1016/j.jsb.2011.01.015. [DOI] [PMC free article] [PubMed] [Google Scholar]


