

Abstract
The endogenous retrovirus, intracisternal A-particle (IAP), is expressed at unique stages during murine embryogenesis and is also activated during the in vitro differentiation of F9 cells. We have examined the DNA elements and protein factors that control IAP expression during F9 differentiation. In the present study an IAP upstream enhancer (IUE) is identified by transient transfection assays and found to be active in both undifferentiated and differentiated cells. Further analyses reveal that a ubiquitous 65 kDa protein factor, the IUE binding protein (IUEB), binds with the IUE. Site-specific methylation within the IUEB binding site strongly inhibits both IUEB binding and IUE transcriptional activity, suggesting that methylation may regulate IUE function and IAP expression.
Intracisternal A-particles (IAP) are endogenous retroviruses found in the endoplasmic reticulum of early mouse embryos and many mouse tumors (reviewed in Kuff and Lueders, 1988). Present in about 1000 copies per haploid genome in Mus musculus, IAP genes contain many features characteristic of retroviruses, including long terminal repeats (LTR) that control transcription, and are uniquely regulated during early mouse development. IAP expression is turned on at the four- to eight-cell stage of mouse development and remains high until the mid- to late-blastocyst stage, when expression drops to basal levels. Thereafter, expression levels remain low in the developing embryo and for most of the adult life of the mouse. IAP are, however, expressed in extraembryonic tissues which contain significant amounts of parietal endoderm, most notably, parietal yolk sac (C. C. Howe, unpublished data).
This in vivo regulation is closely mimicked by the in vitro regulation seen during the differentiation of the nullipotent embryonal carcinoma cell line, F9. F9 cells resemble early embryonic cells and, upon treatment with retinoic acid (RA) and dibutyryl cyclic AMP (dbcAMP), differentiate into cells that resemble parietal endoderm (Strickland et al., 1980). IAP expression is restricted in F9 cells, but activated in the parietal endoderm-like RA/dbcAMP-treated F9 and teratocarcinoma-derived PYS-2 cells. This activation is exerted for the most part at the level of transcription (Howe and Overton, 1986). Many other genes are similarly regulated, including type IV collagen and other basement membrane components (Howe et al., 1988; Killen et al., 1988; Ogawa et al., 1988; Nomura et al., 1989), the papovaviruses, SV40 and polyomavirus (Herbomel et al., 1984; Gorman et al., 1985; Sleigh and Lockett, 1985), the retrovirus Moloney murine leukemia virus (Gorman et al., 1985), and the class I major histocompatibility genes (Miyazaki et al., 1986). Although some of these genes are regulated by the modulation of enhancer activity by stage-specific transcription factors (Flamant et al., 1987; Shirayoshi et al., 1987; Wasylyk et al., 1988; Tsukiyama et al., 1989), studies on Moloney murine leukemia virus and type IV collagen suggest stage-specific methylation may also alter enhancer activity and thus direct differential gene expression (Stewart et al., 1982; Burbelo et al., 1990). In the present study, we analyze the mechanisms by which the IAP gene, a member of the coordinately regulated group of genes, is transcriptionally regulated during differentiation. We report that stage-specific transcriptional regulation of IAP gene expression is mediated in part by an upstream enhancer element that is active in both undifferentiated and differentiated cells, but whose activity is inhibited by site-specific methylation within a ubiquitous transcription factor binding site. We propose that changes in the methylation state of the upstream enhancer contribute to the stage-specific regulation of IAP gene expression.
Materials and methods
Plasmid constructs
IAP LTR 5′ deletion mutants were generated by digesting the plasmid pIAP.l (Howe and Overton, 1986) with novel restriction enzymes (−307/RsaI, −157/DdeI, −134/FspI, and −73/HaeIII; see Fig. 1), followed by subcloning the fragments generated into the HindIII site of pSVO chloramphenicol acetyltransferase (CAT)—a promoterless CAT expression vector in a pBR322 background (Gorman et al., 1982)–by filling the overhangs (if any) with the Klenow fragment of DNA polymerase I, and ligating to HindIII linkers. The −67/+78 5′ deletion mutant was constructed by releasing this fragment from pIAP.l by digestion with PstI, and cloning into the PstI site of pGEM3Z (Promega), followed by release of the fragment with HindIII and cloning into the HindIII site of pSV0CAT.
Figure 1.
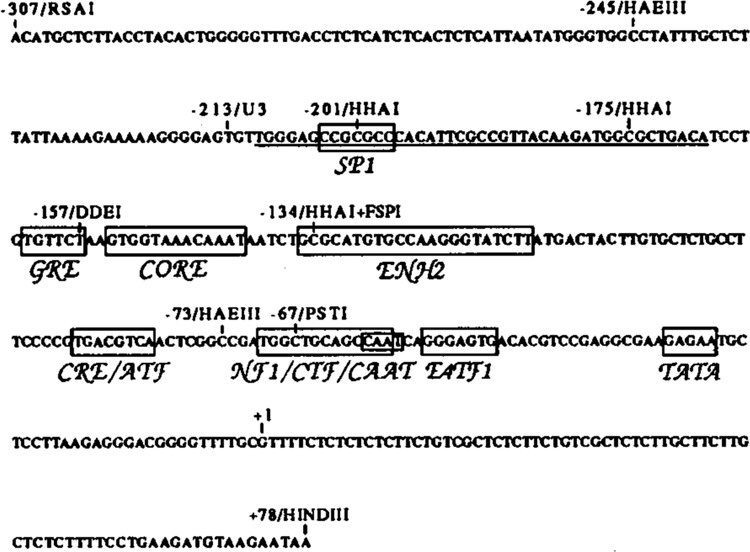
Nucleotide sequence of the IAP LTR from the pIAP.l sequence (Howe and Overton, 1986). Shown above the sequence are various restriction enzymes sites, the beginning of the LTR (−213), and the transcriptional start site (+1). Boxed with abbreviations below the sequence are transcriptional elements, most of which were identified on the basis of homology to known transcriptional elements, including: an Sp1 binding site (Sp1) (Briggs et al., 1986); a glucocorticoid response element (Scheidereit and Beato, 1984); an SV40 core enhancer sequence (Weiher et al., 1983); a cAMP response element or the homologous ATF binding site (CRE/ATF) (Montminy et al., 1986; Lin and Green, 1988); a nuclear factor 1 or the homologous CCAAT transcription factor binding site (NF1/CTF/CAAT) (Jones et al., 1987); an E4TF1 binding site (E4TF1) (Watanabe et al., 1988); and a non-consensus TATA box. Also boxed is an enhancer element identified on the basis of function that binds protein factor EBP80 (Falzon and Kuff, 1990). The underlined sequence represents the DNAse I footprinted region from −210 to −168 (see Fig. 4).
The −307/−157 fragment was cloned upstream of the herpes simplex virus thymidine kinase (TK) promoter by digesting pIAP.l with RsaI and DdeI, adding BamHI linkers, and cloning into the BamHI site of pBLCAT2 (a construct with the TK promoter from −105 to +51 driving CAT expression in a pUC18 background; Luckow and Schutz, 1987). The −213/−167 and −187/−167 oligonuleotides and the PyFl0l enhancer (generously provided by Dr. Elwood Linney, Duke University; Linney and Donerly, 1983), all of which contain BamHI or BgIII ends, were also cloned into the BamHI site of pBLCAT2. Both pBLCAT2 and pBLCAT3 (a pro-moterless CAT expression vector in a pUC18 background [Luckow and Schutz, 1987]) were gifts of Dr. David Hall (Thomas Jefferson University). Copy number and orientation of the TK constructs were determined either by restriction enzyme analysis (−307/−157 constructs) or by nucleotide sequence analysis (−213/−167, −186/−167, and PyF101 constructs) using the dideoxy-chain termination method (Sequenase, United States Biochemical).
Cell culture, transfections, and growth hormone and CAT assays
F9, PYS-2, and HeLa cells were maintained in Dulbecco’s modified Eagle’s medium containing 10% fetal bovine serum. In vitro differentiation of F9 cells was induced with RA (l0−6 M) and dbcAMP (10−3 M) as described (Howe and Overton, 1986). Differentiation was monitored by the disappearance of SSEA-1 (Solter and Knowles, 1978) on the cell surface in a fluorescence-activated cell sorter assay. For transfection of F9 and RA/dbcAMP-treated F9 cells and for the preparation of F9 nuclear extracts, tissue culture plates were first coated with 0.1% gelatin. Transfections were performed by the standard calcium phosphate precipitation technique essentially as described (Maniatis et al., 1989, pp. 16.33–16.36). Cells (4–7 × 10⁶) in 10-cm dishes were cotransfected with 20 μg of CAT plasmid DNA, 8 μg of pTKGH control plasmid (a construct with the TK promoter driving growth hormone expression; Nichols Institute Diagnostics), and 2 μg of pUC18. For RA/dbcAMP-treated F9 cells, transfections were carried out on days 6–8 after addition of RA/dbcAMP. The calcium phosphate precipitate was added directly to cells on plates drained of medium and gently rocked at room temperature. Fresh medium was added after 20 minutes and again after 16–20 hours in an incubator. Forty-eight hours after the transfections, the medium was isolated for the growth hormone assay, and cells were harvested for the CAT assay.
The growth hormone assay was carried out according to the supplier’s instructions (Nichols Institute Diagnostics), and the levels of growth hormone were used to determine relative transfection efficiency within a cell type and to adjust the amount of cell extract used for the individual CAT assays. CAT activity was assayed by thin-layer chromatography as described (Maniatis et al., 1989, pp. 16.60–16.62). Harvested cells were lysed on ice by sonication with two 10-second bursts (sonicator model W375, Heat Systems Ultrasonics). Incubation times for the CAT assay varied from 1.5 to 6 hours, depending upon cell type and growth hormone levels, and a fresh aliquot of acetyl CoA was added every 90 minutes of incubation. CAT activity was quantitated by placing the chromatography plates directly onto a computer-driven radio-analytic imaging system. To normalize between cell types, cells were transfected with pBLCAT2, and for background controls, cells were transfected with either pSV0CAT or pBLCAT3. Relative CAT activity was calculated by first subtracting the activity of the background controls and then normalizing to pBLCAT2 activity.
Nuclear extracts
Nuclear extracts were prepared as described by Shapiro et al. (1988). The protease inhibitors phenylmethylsulfonyl fluoride (0.5 mM), leupeptin (0.5 μg/ml), and pepstatin (0.7 μg/ml) were added at all steps of extract preparation (Boehringer Mannheim). Protein concentrations were determined by a dye-binding assay (Bio-Rad).
Band shift, DNAse I footprinting, methylation interference, and UV crosslinking assays
Band-shift assays were performed as described (Caceres et al., 1990) by incubating mixtures containing 6 μg of nuclear extract, 2 μg of double-stranded poly(dI-dC) (Pharmacia), and 50,000 cpm of probe (approximately 0.2 ng). DNA-protein complexes were resolved on 5% polyacrylamide gels, run at 120 V for 120 minutes. The probe, −213/−167 oligonucleotide, was end-labeled before annealing using T4 poly-nucleotide kinase (Boehringer/Mannheim) and [γ-32P]ATP by conventional procedures (Maniatis et al., 1989, pp. 11.31–11.33). The Sp1 oligonucleotide (a gift from Dr. Roberto Weinmann, The Wistar Institute) contains the sequence 5′-TCCCGCCCCTAACTCCGCCCAT-3′ from the human metallothionein-IIA promoter. DNAse I footprinting was carried out by end-labeling the −307/−67 restriction fragment from pIAP.l by filling recessed 3′ termini as described (Maniatis et al., 1989, pp. 10.50–10.52). The probe and extracts were incubated as in the band-shift assays and digested with DNAse I (20 μg/ml; Boehringer Mannheim) for 30 seconds. The products were run on a 6% sequencing gel, and the position of the footprint was determined by running the A + G Maxam-Gilbert sequencing reaction (Maniatis et al., 1989, pp. 13.78–13.94) in parallel lanes. Methylation interference was carried out as described (Ausubel et al., 1990, pp. 12.3.1–12.3.6) with modifications. End-labeled −213/−167 oligonucleotide was treated with dimethyl sulfate for 3 minutes at 20°C using 1 μg of non-specific plasmid DNA instead of tRNA. Binding reactions were scaled up 20-to 30-fold, and after gel electrophoresis, free and bound probes were isolated by electroelution into dialysis tubing, cleaved by piperidine, and run on a 12% sequencing gel.
The UV crosslinking protocol is a modification of that described by Ausubel et al. (1990, pp. 12.5.1–12.5.8). The −213/−167 oligonucleotide was nick-translated in the presence of [α-32P]dATP and 5′-bromo-2′-deoxyuridine tri-phosphate (Sigma) by incubating with pancreatic DNase I and Escherichia coli DNA polymerase I (Boehringer Mannheim). Binding reactions were scaled up 20- to 30-fold, UV cross-linked (305 nm) for 90 minutes (inverted UV transilluminator 4.5 cm from sample), and then electrophoresed. Bound probe was electroeluted into dialysis tubing and precipitated with 10 μg of tRNA and 2.5 volumes of ethanol. Unprotected DNA was digested with micrococcal nuclease (Pharmacia) and DNAse I in the presence of 10 mM CaCl2 for 30 minutes at 37°C. An equal volume of sample buffer (with SDS) was added, boiled for 10 minutes, and run on a 5% protein gel.
In vitro HhaI methylation
End-labeled oligonucleotide or plasmid was incubated with HhaI methylase according to the manufacturer’s instructions (New England Bio-labs), followed by heat-inactivation at 68°C for 10 minutes, phenol-chloroform extraction, and precipitation. Unmethylated samples were run in parallel. To test for completeness of methylation, oligonucleotides or plasmids were digested with HhaI restriction enzyme for 60 minutes at 37°C in the prescribed buffer (New England Biolabs), and electrophoresed on a 12% sequencing gel or 1% agarose gel, respectively.
Results
IAP LTR deletion analysis
We constructed a series of 5′ deletion mutants to analyze the DNA sequences within the IAP LTR important for transcription in undifferentiated (F9) and differentiated (RA/dbcAMP-treated F9 or PYS-2) cells. Figure 1 shows the nucleotide sequence of the IAP LTR. The mutants, covering the sequences from −307 to +78 (Fig. 2), were placed in front of the CAT reporter gene and transfected into F9, RA/dbcAMP-treated F9, PYS-2, and HeLa cells. The results shown are for F9 and PYS-2 cells only, as transfection of RA/dbcAMP-treated F9 and HeLa cells gave results similar to those using PYS-2 cells (data not shown), and subsequent experiments in this paper utilize PYS-2 cells as the differentiated parietal endoderm-like cell type.
Figure 2.

Transcriptional activity of IAP LTR 5′ deletion mutants. The various 5′ deletion constructs (schematically represented below) were transfected into either PYS-2 (hatched box) or F9 (stippled box) cells. CAT activity is expressed relative to the full-length −307/+78 deletion construct in PYS-2 cells set to 100% activity. The number of independent transfection experiments with each construct is shown in parentheses, with the standard deviation shown as error bars. Transfection of RA/dbcAMP-treated F9 (F9/RA) and HeLa cells gave results similar to PYS-2 cells (+/−10%). Features of the schematic diagram of the IAP LTR are described in Figure 1.
In both undifferentiated (F9) and differentiated (PYS-2) cells, transcriptional activity decreased in a stepwise manner with successive deletions from the 5′ end (Fig. 2). Deletion from −307 to −157 resulted in a reduction of transcriptional activity in both cell types to 50% of the full-length construct. On the other hand, a further deletion from −157 to −134 only slightly decreased transcriptional activity to 40% of full-length activity. Deletion from −134 to −73 drastically reduced transcriptional activity to 5% of full-length activity, while deletion from −73 to −67 decreased transcriptional activity only slightly. These results suggest that, similar to the regulatory regions of other genes, the IAP LTR contains multiple transcriptional elements that direct different levels of transcription. In addition, the transcriptional activity of all deletion constructs was 7- to 8-fold lower in F9 than in PYS-2 cells, suggesting the presence of differentiation-specific elements within some of the transcriptional domains.
Definition of an IAP upstream enhancer
To begin to characterize individual transcriptional elements within the IAP LTR, we examined the furthermost upstream region (−307/−157). We tested the ability of this region to drive the developmentally neutral TK promoter by cloning this region upstream of the TK promoter in different orientations and copy numbers. Transfection assays showed an 8-fold stimulation of transcription in both F9 and PYS-2 cells (Fig. 3A and C). These results suggest that the −307/−157 region contains an enhancer element(s) active in both cell types and that the differentiation-specific elements) lies somewhere downstream from this element.
Figure 3.

Transcriptional activity of the IAP LTR upstream elements. CAT constructs containing either the IAP −307/−157 fragment (A) or the −213/−167 oligonucleotide covering the footprinted region (B) cloned upstream of the TK promoter in different orientations and copy number (arrows indicate orientation of the elements) were transfected into F9 and PYS-2 cells. CAT activity is expressed relative to the activity of the TK promoter driving CAT expression (pBLCAT2), with each plus sign representing either 2- (A) or 3-fold (B) activation above pBLCAT2 activity. The number of independent transfection experiments with each construct is shown in parentheses. The relative error between independent experiments varied from 2 to 15 %. C. Schematic representation of the IAP upstream elements tested for transcriptional activity with the features of the IAP LTR described in Figure 1.
DNAse I footprinting assays revealed a footprint, from −210 to −168 on both the non-coding and coding strands, made by proteins from both F9 and PYS-2 cells (Fig. 4A and B, respectively), indicating the presence of a protein(s) binding within this region. Transfection assays with plasmids containing a synthetic oligonucleotide (−213/−167) that covered the foot-printed region cloned in different orientations and copy numbers upstream of the TK promoter revealed a stimulation of transcription independent of orientation and with greater activity upon multimerization in both F9 and PYS-2 cells (Fig. 3B and C) and in HeLa cells (data not shown). Thus, the IAP footprinted sequence −213/−167 acts as a strong enhancer in all the cell types tested, suggesting that a common protein factor(s) shared by these cell types binds to this element and stimulates transcription.
Figure 4.

DNAse I footprint analysis of the IAP LTR upstream region. An IAP fragment from −307 to −67 was end-labeled either on the non-coding strand (A) or coding strand (B), incubated with 0, 6, 17, and 42 μg of nuclear extract from PYS-2 (A, and B, lanes 1–4) and F9 (A and B, lanes 5–8) cells, and digested with DNAse I. Position of the footprint (−210 to −168) is indicated.
Characterization of protein factors binding within −213/−167
Band-shift assays revealed binding of the end-labeled −213/−167 oligonucleotide to a protein factor(s) present in both PYS-2 and F9 nuclear extracts (Fig. 5A), as well as in HeLa (data not shown), to form a major, slowly migrating complex and two other minor complexes. Unlabeled −213/−167 oligonucleotide effectively competed for binding (Fig. 5A, lanes 3–5), while another IAP oligonucleotide (−50/+1; Fig. 5A, lanes 6–8) and an oligonucleotide containing an Sp1 binding site (Fig. 5A, lanes 9–11) did not compete, demonstrating the specificity of binding and suggesting that Sp1 is not the predominant factor binding within −213/−167. The major DNA-protein complex was further characterized for the bound protein and the binding site.
Figure 5.

A. Band-shift analysis of the IAP upstream −213 to −167 element. Upper panel: 32P-labeled −213/−167 oligonucleotide was incubated with either no extract (lane 1), 6 μg of PYS-2 (lanes 2–11), or 6 μg of F9 (lane 12) nuclear extracts. Competition analysis was performed with a 5-, 20- and 80-fold molar excess of unlabeled −213/−167 (lanes 3–5), IAP-50/+1 (lanes 6–8), and Sp1 oligonucleotide (lanes 9–11). The free (F) and bound (B) forms of the probe are indicated. Lower panel: 32P-labeled oligonucleotide was incubated with either no extract (lane 1), 6 μg of F9 (lanes 2–11), or 6 μg of PYS-2 (lane 12) nuclear extracts, with competition as described in the upper panel. B. UV crosslinking of nuclear proteins to the IAP −213 to −167 element. Nuclear proteins from PYS-2 (lane 1) or F9 (lane 2) cells were UV crosslinked to 32P-labeled bromodeoxyuri-dine-substituted −213/−167 oligonucleotide. Protein molecular weight markers are shown on the left and the size of the major polypeptide species (65 kDa) is indicated.
UV crosslinking experiments, consisting of crosslinking 32P-labeled bromodeoxyuridine-substituted −213/−167 oligonucleotide to nuclear proteins from F9 or PYS-2 cells and isolating the major complex from a band-shift assay (labeled as B in Fig. 5A), indicated that the major polypeptide binding within −213/−167 has a molecular weight of 65 kDa in both cell types (Fig. 5B). This major polypeptide was not detectable when the corresponding region was isolated from an experiment included with specific competitor. The minor bands probably represent background non-specific complexes because the bands varied from experiment to experiment. The exact binding site of the factor(s) was then determined by methylation interference. This assay determines the base-specific contacts of DNA-binding protein factors through interference of binding to methylated guanine (G) residues. Analysis of the isolated major complex showed that methylation of four G residues on the non-coding strand and two G residues on the coding strand was found to interfere with binding in both PYS-2 and F9 extracts (Fig. 6A and B, respectively). These results define the binding site of the factor as GATGGCGC (Fig. 7), from −180 to −173, and rule out Sp1 as the predominant factor binding within −213/−167.
Figure 6.

Methylation interference analysis of the IAP upstream −213 to −167 element with PYS-2 (A) and F9 (B) nuclear extracts. The patterns for both non-coding (lanes 1–3) and coding (lanes 4–6) strands and the piperidine cleavage patterns for the probe not incubated with extract (G, lanes 1 and 4), and the free (F, lanes 2 and 5) and bound (B, lanes 3 and 6) forms of probe are shown. The IAP sequences surrounding the interfered regions, from −180 to −171, are shown with the G residues that diminish binding when methylated (denoted by dashes).
Figure 7.

Nucleotide sequence of the IUEB and related binding sites: the IUEB binding site within the IAP LTR; the E1 element of the immunoglobulin heavy chain enhancer (Ephrussi et al., 1985; Weinberger et al., 1986); the Nir box in the insulin enhancer (Moss et al., 1988); the downstream (D) and upstream (U) binding sites in the tyrosine aminotransferase (TAT) regulatory region; and the binding sites for transcription factors BF-H in the polyomavirus enhancer and LBP in the Moloney murine leukemia virus enhancer. Methylation of G residues that intefered with protein binding by in vitro methylation interference or G residues that were protected by protein binding by in vivo methylation protection are indicated by asterisks, while G residues that are enhanced by in vivo methylation protection are indicated by ovals. Asterisks and ovals underneath C residues in the nucleotides sequences correspond to G residues in the complementary strand of DNA. Dashes in sequences represent nucleotides not present in the respective binding sites. The methylation-sensitive HhaI restriction enzyme site within the IUEB binding site is also indicated.
Transfection assays with a plasmid containing four copies of the oligonucleotide encompassing the protein binding site (−186/−167) cloned upstream of the TK promoter driving the CAT gene revealed the stimulation of expression from the TK promoter in both F9 and PYS-2 cells (Fig. 8). Thus, the protein factor binding site we identified contains a functional enhancer element. The enhancer element (−186/−167) is designated herein as the IUE, and the protein factor that binds the IUE as the IUEB.
Figure 8.

Transcriptional activity of the IAP upstream −186 to −167 element. A. Schematic representation of CAT constructs with the TK promoter alone, or with four copies of the −186/−167 oligonucleotide cloned upstream of the TK promoter (arrows indicate orientation of oligonucleotide). B. CAT assay of constructs 1 and 2 shown in A transfected into either F9 (lanes 1 and 2, respectively) or PYS-2 (lanes 3 and 4, respectively) cells. The number of independent transfection experiments with each construct that yielded similar results is shown in parentheses in A. C. Schematic representation of the IAP −186 to −167 region, with features of the IAP LTR as described in Figure 1. The boxed IUE sequence represents the IUE as described in the text.
Methylation of HhaI site inhibits IUEB binding and IUE activity
In mammalian DNA, cytosine residues of CpG dinucleotides are the preferential sites for methylation. The IUEB binding site contains a methylation-sensitive HhaI restriction enzyme site (GCGC; see Fig. 7). To examine the effect of cytosine methylation of the CpG dinucleotide within the Hha site on IUEB binding, the −213/−167 oligonucleotide was treated with HhaI methylase. As a control, untreated −213/−167 oligonucleotide was run in parallel. Digestion of the methylated and unmethylated oligonucleotides with HhaI restriction enzyme followed by analysis on a sequencing gel revealed the expected 14 bp fragment for the unmethylated oligonucleotide but only a full-length 53 bp fragment for the methylated oligonucleotide (Fig. 9A), confirming that methylation at the HhaI site was virtually complete. Band-shift assays revealed that the unmethylated −213/−167 oligonucleotide bound to IUEB, while the methylated oligonucleotide demonstrated almost no binding to IUEB (Fig. 9A) in F9 or PYS-2 extracts. Thus, IUEB binding is strongly inhibited by methylation within the IUEB binding site.
Figure 9.
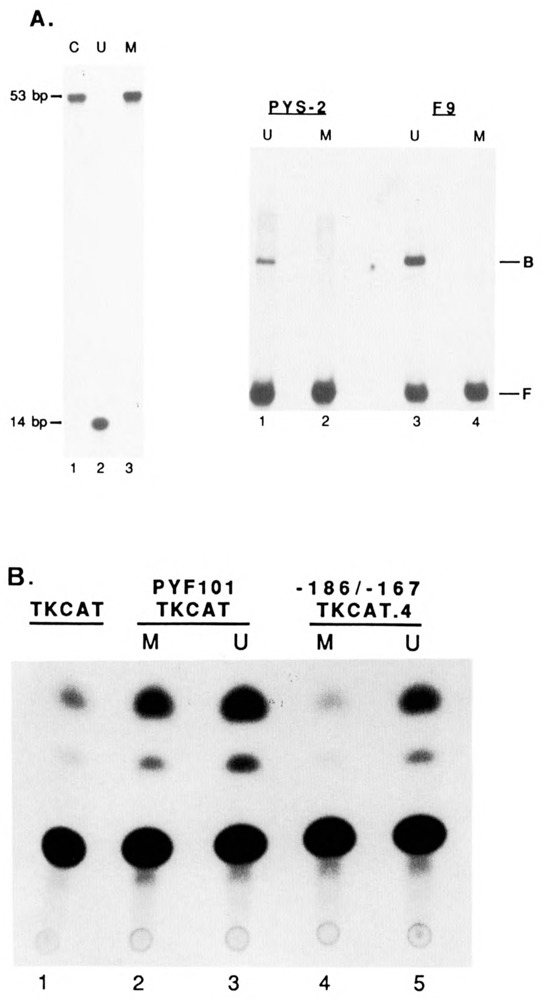
A. Left panel: effect of HhaI methylation on IUEB binding. Sequence gel analysis of end-labeled −213/−167 oligonucleotide that was either methylated (M, lane 3) or unmethylated (U, lane 2) by HhaI methylase and cut with HhaI restriction enzyme. As a control (C, lane 1), −213/−167 oligonucleotide was analyzed in parallel. The size of the full-length (53 bp) and HhaI cleaved (14 bp) oligonucleotide is indicated. Right panel: band-shift analysis of unmethylated (U) and methylated (M) end-labeled −213/−167 oligonucleotide with either PYS-2 (lanes 1 and 2, respectively) or F9 (lanes 3 and 4. respectively) nuclear extracts. The free (F) and bound (B) forms of the probe are indicated. B. Effect of HhaI methylation on IUE transcriptional activity. CAT activity of constructs containing either the TK promoter alone (lane 1), the PyFl0l enhancer cloned upstream of the TK promoter methylated (M, lane 2) or unmethylated (U, lane 3) by HhaI methylase, and four copies of the −186/−167 oligonucleotide cloned upstream of the TK promoter methylated (M, lane 4) or unmethylated (U, lane 5) by HhaI methylase, and transfected into PYS-2 cells. Three independent transfection experiments yielded similar results.
Transfection assays in PYS-2 cells with HhaI methylated plasmid containing four copies of the IUE (−186/−167) driving the TK promoter (see Fig. 8A) revealed a strong repression of transcription relative to an unmethylated control (compare lanes 4 and 5 of Fig. 9B). However, the inhibition was not complete, indicating that partial demethylation had occurred, in contrast to an earlier report that demethylation does not occur between 24 to 48 hours post-transfection (Paroush et al., 1990). In a control experiment, HhaI methylation of a plasmid with a mutant polyoma enhancer (PyF101; Linney and Donerly, 1983) driving the TK promoter had little effect on transcriptional activity (compare lanes 2 and 3 of Fig. 9B), indicating that the transcriptional repression by methylation is specific for the IUEB binding site. Thus, IUEB binding is essential in vivo for transcription directed by the IUE, and is inhibited by site-specific methylation.
Discussion
We have demonstrated by transient transfection assays the presence of multiple transcriptional domains within the IAP LTR that direct distinct levels of expression. One of these, IUE, a novel enhancer element located between −186 and −167 of the IAP LTR, is functional in both undifferentiated (F9) and differentiated (PYS-2) cells. Deletion of the IUE by removal of the first 56 bp of the LTR, from −213 to −157, resulted in a 50% loss of transcriptional activity in the undifferentiated and differentiated cells analyzed. We also identified a 65 kDa transcription factor, IUEB, that binds to the sequence GATGGCGC within the IUE and is present in F9 and PYS-2 cells. Methylation of the IUE blocks IUEB binding and eliminates the ability of IUE to activate transcription of a receptor gene in vivo.
Specific methylation of cytosine residues at CpG sites in mammalian DNA is thought to play a role in tissue- and developmental-specific gene expression (reviewed in Adams, 1990, and Cedar and Razin, 1990). Thus, even though the IUE elicits similar transcriptional activity in undifferentiated and differentiated cell types in a transient transfection assay and binds to the ubiquitous IUEB in vitro, the fact that the IUE is sensitive to cytosine methylation at the CpG site within the IUEB binding site has led us to hypothesize that changes in the methylation state of the IUE contribute to the stage-specific regulation of IAP expression during differentiation. This view is consistent with several previous observations: (1) IAP are expressed at high levels in oocytes, cleavage stage embryos, and certain extraembryonic tissues, all of which contain relatively hypomethylated DNA, while IAP are not expressed in sperm and later stage embryos, which contain hypermethylated DNA (Kuff and Lueders, 1988; Sanford et al., 1987; Monk et al., 1987); (2) like other genes activated during F9 differentiation (Stewart et al., 1982; Young and Tilghman, 1984; Burbelo et al., 1990), IAP are generally hypermethylated in undifferentiated and hypomethylated in differentiated F9 cells (Morgan and Huang, 1987); (3) IAP are activated by treatment with the potent inhibitor of methylation, 5-azacytidine (Davis et al., 1989); and (4) most significantly, the three HhaI sites within the IAP LTR (see Fig. 1) are generally hypomethylated in IAP-expressing myelomas, neuroblastomas, and plasmacytomas, and hypermethylated in non-expressing adult liver cells (Morgan and Huang, 1984; Feenstra et al., 1986), and in nitro methylation of all three HhaI sites reduces IAP transcriptional activity in both COS7 and 293 cells (Feenstra et al., 1986; Falzon and Ruff, 1989). Falzon and Kuff (1991) found that this regulation is in part due to the methylation of the HhaI site within a transcriptional element termed ENH2 (Fig. 1), which prevents the 80 kDa transcription factor EBP80 from binding, and in part to methylation of an ill-defined HhaI upstream site. We have now defined this HhaI as lying within the IUE and the methylation of which prevents the 65 kDa IUEB protein from binding.
Like IUEB, site-specific methylation within several transcription factor binding sites has been shown to directly interrupt their binding and activity. For example, CpG methylation inhibits the binding of certain ubiquitous factors to the IUEB-like sequences in the tyrosine amino-transferase promoter (see Fig. 7; Becker et al., 1987); the DNA binding and transcriptional activity of transcription factors E2F, CREB, and USF (Kovesdi et al., 1987; Watt and Molloy, 1988; Iguchi-Ariga and Schaffner, 1989; Molloy and Watt, 1990); and the binding of myc/myn transcription factor dimers (Prendergast et al., 1991). In contrast, other transcription factors, such as Sp1, are unaffected by methylation (Harrington et al., 1988; Holler et al., 1988). As most of these studies examined the impact of methylation on DNA binding and transcriptional activity in vitro, analysis of the methylation states of endogenous genes, including the IAP gene, will be needed to determine the role of methylation in controlling gene expression in vivo.
Despite substantial sequence variation among different IAP cDNA and genomic clones that have been described (Christy et al., 1985), the IUEB binding site is 100% conserved. In addition, deletion of this region resulted in a greater than 50% loss of transcriptional activity in several different cell types (Christy and Huang, 1988; Falzon and Kuff, 1989). These results suggest that the IUE is critical for IAP expression. The IUEB binding site resembles a series of transcription factor binding sites termed E boxes, as shown in Figure 7. E boxes were originally defined as a series of protein factor binding sites in the immunoglobulin heavy chain and κ light chain enhancers, and similar sequences have since been identified in the regulatory regions of other tissue- and differentiation-specific genes, including the insulin I and many muscle-specific genes (reviewed in Olson, 1990). The IUEB binding site most closely resembles the E1 element of the immunoglobulin heavy chain enhancer, and in fact, an oligonucleotide containing the E1 site competed for IUEB binding, while an oligonucleotide containing the heavy chain E2 site did not (data not shown). The IUEB binding site also highly resembles the BF-H and LBP transcription factor binding sites in the polyoma and Moloney murine leukemia virus regulatory regions, respectively (see Fig. 7), and similar to IUEB, BF-H and LBP are transcriptional activators present in both undifferentiated F9 cells and differentiated cells (Tsukiyama et al., 1989; Hirano and Iwakura, 1990). Determination of the structural and functional relation of these factors to IUEB must await the cloning of these genes.
Acknowledgments
We thank K. Burgess, M. Q. Xu, and Y. B. Zhang for excellent technical assistance, and J. Caceres, A. Kralli, and I. Olave of Dr. R. Weinmann’s laboratory for providing oligonucleotides and some nuclear extracts, technical advice in preparing nuclear extracts, and for many helpful discussions We are grateful to Dr. R. Weinmann for his critical reading of the manuscript, and for many stimulating discussions, and to M. Hoffman and S. Peterson for editorial advice in preparing this manuscript.
This work was supported by Public Health Service grants HD17720, HD23291, and HD21355, NICHD grant HD25078, and NIGM grant GM37762. Oligonucleotide synthesis was supported by the National Institutes of Health core grant CA10815. B. T. L. was supported in part by the cell and molecular biology training grant GM7229 from the National Institutes of Health.
The costs of publishing this article were defrayed in part by the payment of page charges. This article must therefore be hereby marked “advertisement” in accordance with 18 USC Section 1734 solely to indicate this fact.
Bruce T. Lamb is currently at the Developmental Genetics Laboratory, Department of Physiology, Johns Hopkins University School of Medicine, Baltimore, Maryland 21205.
Davor Solter is currently at the Max-Planck Institute, P.O. Box 1169, Stubeweg 51, D-7800 Freiburg-Zahringen, Germany.
References
- Adams R. L. P. (1990), Biochem J 265, 309–320. [DOI] [PMC free article] [PubMed] [Google Scholar]
- Ausubel F. M., Brent R., Kingston R. E., Moore D. D., Seidman J. G., Smith J. A., and Struhl K., eds. (1990), in Current Protocols in Molecular Biology, Green Publishing Associates and Wiley Interscience, John Wiley and Sons, New York. [Google Scholar]
- Becker P. B., Ruppert S., and Schutz G. (1987), Cell 51, 435–443. [DOI] [PubMed] [Google Scholar]
- Briggs M. R., Kadonaga J. T., Bell S. P., and Tjian R. (1986), Science 234, 47–52. [DOI] [PubMed] [Google Scholar]
- Burbelo P. D., Horikoshi S., and Yamada Y. (1990), J Biol Chem 265, 4839–4843. [PubMed] [Google Scholar]
- Caceres J., Glikin G., Bravo R., and Weinmann R. (1990), Oncogene 5, 59–67. [PubMed] [Google Scholar]
- Cedar H. and Razin A. (1990), Biochim Biophys Acta 1049, 1–8. [DOI] [PubMed] [Google Scholar]
- Christy R. J., Brown A. R., Gourlie B. B., and Huang R. C. C. (1985), Nucl Acids Res 133, 289–302. [DOI] [PMC free article] [PubMed] [Google Scholar]
- Christy R. J. and Huang R. C. C. (1988), Mol Cell Biol 8, 1093–1102. [DOI] [PMC free article] [PubMed] [Google Scholar]
- Davis C. M., Constantinides P. G., Van der Riet F., Van Schalkwyk L., Gevers W., and Parker M. I. (1989), Cell Diff Dev 27, 83–93. [DOI] [PubMed] [Google Scholar]
- Ephrussi A., Church G. M., Tonegawa S., and Gilbert W. (1985), Science 227, 134–140. [DOI] [PubMed] [Google Scholar]
- Falzon M. and Kuff E. L. (1989), J Biol Chem 264, 21915–21922. [PubMed] [Google Scholar]
- Falzon M. and Kuff E. L. (1990), J Biol Chem 265, 13084–13090. [PubMed] [Google Scholar]
- Falzon M. and Kuff E. L. (1991), Mol Cell Biol 11, 117–125. [DOI] [PMC free article] [PubMed] [Google Scholar]
- Feenstra A., Fewell J., Luederss K. and Kuff E. (1986), Nucl Acids Res 14, 4343–4352. [DOI] [PMC free article] [PubMed] [Google Scholar]
- Flamant F., Gurin C. C., and Sorge J. A. (1987), Mol Cell Biol 7, 3548–3553. [DOI] [PMC free article] [PubMed] [Google Scholar]
- Gorman C. M., Moffat L. F., and Howard B. H. (1982), Mol Cell Biol 2, 1044–1051. [DOI] [PMC free article] [PubMed] [Google Scholar]
- Gorman C. M., Rigby P. W. J., and Lane D. P. (1985), Cell 42, 519–526 [DOI] [PubMed] [Google Scholar]
- Harrington M. A., Jones P. A., Imagawa M., and Karin M. (1988), Proc Natl Acad Sci USA 85, 2066–2070. [DOI] [PMC free article] [PubMed] [Google Scholar]
- Herbomel P., Bourachot B., and Yaniv M. (1984), Cell 39, 653–662. [DOI] [PubMed] [Google Scholar]
- Hirano T. and Iwakura Y. (1990), Biochimie 72, 327–336. [DOI] [PubMed] [Google Scholar]
- Holler M., Westin G., Jiricny J., and Schaffner W. (1988), Genes Dev 2, 1127–1135. [DOI] [PubMed] [Google Scholar]
- Howe C. C. and Overton G. C. (1986), Mol Cell Biol 6, 150–157. [DOI] [PMC free article] [PubMed] [Google Scholar]
- Howe C. C., Overton G. C., Sawicki J., Solter D., Stein P., and Strickland S. (1988), Differentiation 37, 20–25. [DOI] [PubMed] [Google Scholar]
- Iguchi-Ariga S. M. M. and Schaffner W. (1989), Genes Dev 3, 612–619. [DOI] [PubMed] [Google Scholar]
- Jones K. A., Kadonaga J. T., Rosenfeld P. J., Kelly T. J., and Tjian R. (1987), Cell 48, 79–89. [DOI] [PubMed] [Google Scholar]
- Killen P. D., Burbelo P. D., Martin G. R., and Yamada Y. (1988), J Biol Chem 263, 12310–12314. [PubMed] [Google Scholar]
- Kovesdi I., Reichel R., and Nevins J. R. (1987), Proc Natl Acad Sci USA 84, 2180–2184. [DOI] [PMC free article] [PubMed] [Google Scholar]
- Kuff E. L. and Lueders K. K. (1988), Adv Cancer Res 51, 183–275. [DOI] [PubMed] [Google Scholar]
- Lin Y.-S. and Green M. R. (1988), Proc Natl Acad Sci USA 85, 3396–3400. [DOI] [PMC free article] [PubMed] [Google Scholar]
- Linney E. and Donerly S. (1983), Cell 35, 693–699. [DOI] [PubMed] [Google Scholar]
- Luckow B. and Schutz G. (1987), Nucl Acids Res 15, 5490. [DOI] [PMC free article] [PubMed] [Google Scholar]
- Maniatis T., Fritsch E. F., and Sambrook J. (1989), Molecular Cloning: A Laboratory Manual, 2nd ed., Cold Spring Harbor Laboratory Press, Cold Spring Harbor NY. [Google Scholar]
- Miyazaki J.-I., Appella E., and Ozato K. (1986), Proc Natl Acad Sci USA 83, 9537–9541. [DOI] [PMC free article] [PubMed] [Google Scholar]
- Molloy P. L. and Watt F. (1990), Philos Trans R Soc Lond 326, 267–275. [DOI] [PubMed] [Google Scholar]
- Monk M., Boubelik M., and Lehnert S. (1987), Development 99, 371–382. [DOI] [PubMed] [Google Scholar]
- Montminy M. R., Sevarino K. A., Wagner J. A., Mandel G., and Goodman R. H. (1986), Proc Natl Acad Sci USA 83, 6682–6686. [DOI] [PMC free article] [PubMed] [Google Scholar]
- Morgan R. A. and Huang R. C. C. (1984), Cancer Res 44, 5234–5241. [PubMed] [Google Scholar]
- Morgan R. A. and Huang R. C. C. (1987), Dev Genet 8, 125–133. [DOI] [PubMed] [Google Scholar]
- Moss L. G., Moss J. B., and Rutter W. J. (1988), Mol Cell Biol 8, 2620–2627. [DOI] [PMC free article] [PubMed] [Google Scholar]
- Nomura S., Hashmi S., McVey J. H., Ham J., Parker M., and Hogan B. L. M. (1989), J Biol Chem 264, 12201–12207. [PubMed] [Google Scholar]
- Ogawa K., Burbelo P. D., Sasaki M., and Yamada Y. (1988), J Biol Chem 263, 8384–8389. [PubMed] [Google Scholar]
- Olson E. N. (1990), Genes Dev 4, 1454–1461. [DOI] [PubMed] [Google Scholar]
- Paroush Z., Yisraeli I., and Cedar H. (1990), Cell 63, 1229–1237. [DOI] [PubMed] [Google Scholar]
- Prendergast G. C., Lawe D., and Ziff E. B. (1991), Cell 65, 395–407. [DOI] [PubMed] [Google Scholar]
- Sanford J. P., Clark H. J., Chapmann V. M., and Rossant J. (1987), Genes Dev 1, 1039–1046. [DOI] [PubMed] [Google Scholar]
- Scheidereit C. and Beato M. (1984), Proc Natl Acad Sci USA 81, 3029–3033. [DOI] [PMC free article] [PubMed] [Google Scholar]
- Shapiro D. J., Sharp P. A., Wahli W. W., and Keller M. J. (1988), DNA 7, 47–55. [DOI] [PubMed] [Google Scholar]
- Shirayoshi Y., Mirazaki J.-I., Burke P. A., Hamada K., Appella E., and Ozato K. (1987), Mol Cell Biol 7, 4542–4548. [DOI] [PMC free article] [PubMed] [Google Scholar]
- Sleigh M. J. and Lockett T. J. (1985), EMBO J 4, 3831–3837. [DOI] [PMC free article] [PubMed] [Google Scholar]
- Solter D. and Knowles B. B. (1978), Proc Natl Acad Sci USA 75, 5565–5569. [DOI] [PMC free article] [PubMed] [Google Scholar]
- Stewart C., Stuhlmann H., Jahner D., and Jaenisch R. (1982), Proc Natl Acad Sci USA 79, 4098–4102. [DOI] [PMC free article] [PubMed] [Google Scholar]
- Strickland S., Smith K. K., and Marotti K. R. (1980), Cell 21, 347–355. [DOI] [PubMed] [Google Scholar]
- Tsukiyama T., Niwa O., and Yokoro K. (1989), Mol Cell Biol 9, 4670–4676. [DOI] [PMC free article] [PubMed] [Google Scholar]
- Wasylyk B., Imler T. L., Chatton B., Schatz C., and Wasylyk C. (1988), Proc Natl Acad Sci USA 85, 7952–7956. [DOI] [PMC free article] [PubMed] [Google Scholar]
- Watanabe H., Imai T., Sharp P. A., and Handa H. (1988), Mol Cell Biol 8, 1290–1300. [DOI] [PMC free article] [PubMed] [Google Scholar]
- Watt F. and Molloy P. L. (1988), Genes Dev 2, 1136–1143. [DOI] [PubMed] [Google Scholar]
- Weiher H., Konig M., and Gruss P. (1983), Science 219, 626–631. [DOI] [PubMed] [Google Scholar]
- Weinberger J., Baltimore D., and Sharp P. A. (1986), Nature 322, 846–848. [DOI] [PubMed] [Google Scholar]
- Young P. R. and Tilghman S. M. (1984), Mol Cell Biol 4, 898–907. [DOI] [PMC free article] [PubMed] [Google Scholar]