Abstract
Background:
Neuroblastoma is the most common extracranial solid tumor in children younger than 5 years old. Optimal management of neuroblastic tumors depends on many factors including histopathological classification. The gold standard for classification of neuroblastoma histological images is visual microscopic assessment. In this study, we propose and evaluate a deep learning approach to classify high-resolution digital images of neuroblastoma histology into five different classes determined by the Shimada classification.
Subjects and Methods:
We apply a combination of convolutional deep belief network (CDBN) with feature encoding algorithm that automatically classifies digital images of neuroblastoma histology into five different classes. We design a three-layer CDBN to extract high-level features from neuroblastoma histological images and combine with a feature encoding model to extract features that are highly discriminative in the classification task. The extracted features are classified into five different classes using a support vector machine classifier.
Data:
We constructed a dataset of 1043 neuroblastoma histological images derived from Aperio scanner from 125 patients representing different classes of neuroblastoma tumors.
Results:
The weighted average F-measure of 86.01% was obtained from the selected high-level features, outperforming state-of-the-art methods.
Conclusion:
The proposed computer-aided classification system, which uses the combination of deep architecture and feature encoding to learn high-level features, is highly effective in the classification of neuroblastoma histological images.
Keywords: Convolutional deep belief network, feature encoding, histological images, neuroblastoma
INTRODUCTION
Neuroblastoma is the most common extracranial malignancy in childhood. More than 15% of childhood cancer deaths are the result of neuroblastoma which is the second most frequent cause of cancer mortality in children.[1] As with most types of cancer, optimal management of neuroblastic tumors depends on many factors including histopathological classification. Human eyes classify neuroblastoma tumors by looking through optical microscopic. However, computer-aided diagnosis (CAD) systems have the capacity to extract many more features some of which may not be recognizable by human eyes.[2] Efforts have been made toward the development of CAD systems for tumor classification to improve diagnostic efficiency and consistency.[3]
There has been an interest in developing approaches for automated classification of neuroblastoma histological images. Kong et al.[4] classified neuroblastoma into three established categories; undifferentiated, poorly differentiated, and differentiating, using image segmentation techniques. Images at each resolution level were segmented into cellular, neuropil, and background elements and were classified by integrating different classifiers such as linear discriminative analysis, support vector machine (SVM), and k-Nearest Neighbor. Previous work in our group[5] classified neuroblastoma tumor images into undifferentiated and poorly differentiated categories using Otsu segmentation technique.[6] Images at each resolution level were segmented into cellular, neuropil, and background elements and were classified based on the Shimada et al. classification.[7] Previously, we[2] applied the completed local binary pattern (CLBP), based on three components (center pixel, sign, and magnitude patterns) extracted from the 8-neighborhoods to classify neuroblastoma tumor images. The center pixel was coded into a binary bit after global thresholding with the signs and magnitudes of derivatives within the 8-neighborhoods were coded into the binary format so that their histograms could be combined to form the final CLBP histograms. All these proposed methods use handcrafted features which are based on color, geometry, and texture to simulate the visual perception of a human in interpreting the tissue sections. These methods extract architectural features of different cells in the neuroblastoma histological images for tissue classification. However, a huge variation of shape and texture between neuroblast cells from images which belong to the same category make the classification based on handcrafted features more challenging.
Recent research shows that deep networks have an exciting potential for various applications in medical image pattern recognition and tissue classification including histopathology. Deep learning networks learn high-level features from a large amount of training data to discriminate between different classes of images. Zhu et al.[8] proposed a deep convolutional neural network (CNN) using convolutional information to segment images of prostate from magnetic resonance. They used 1 × 1 convolutional layers to improve the accuracy of the segmentation and reduce the dimension and number of parameters. Turkki et al.[9] quantified immune cell-rich areas in hematoxylin and eosin (H&E) stained samples of breast cancer using a pretrained CNN. They extracted high-level features of H&E images of breast cancer and classified them using SVM classifier. Abdel-Zaher and Eldeib[10] improved the accuracy of a CAD system using deep belief network which was followed by backpropagation. They applied their technique to classify the Wisconsin breast cancer dataset[11] into benign and malignant tumors.
Although deep algorithms are very effective in the classification of medical images, feature encoding is an adaptive approach which models the image structure in a robust way which is computationally efficient. Moreover, feature encoding approaches identify visual patterns that are relevant to the whole image collection. To the best of our best knowledge, there is no deep learning approach for classification of neuroblastoma histological images. Moreover, none of the existing methods have combined a feature encoding method with the deep networks in histological images. In this study, we propose a new computer-aided classification system based on convolutional deep belief networks (CDBNs) to extract high-level features which are difficult to spot by human eyes. We introduce a feature encoding approach using the bag of features algorithm[12] to refine discriminative features during the tissue image classification. To evaluate the proposed method, we have constructed a new dataset of neuroblastoma histological images. Our encouraging experimental results show the effectiveness of the proposed method compared to state-of-the-art methods including CLBP, patched CLBP (PCLBP), and CNN.
The contributions of this paper are to (a) extract high-level features from neuroblastoma histological images, (b) apply a feature encoding method to improve the classification performance, (c) construct a dataset containing 1043 images from 125 different patients, and therefore (d) compare the proposed approach with handcrafted features and standard CNN algorithms. This study demonstrates that combination of a deep network with feature encoding has the potential to increase the accuracy of the classification of neuroblastoma histological images compared to state-of-the-art methods.
The rest of the paper is organized as follows. The Subjects and Methods Section describes the constructed dataset and presents the proposed method. An experimental evaluation of the proposed method is presented in the Results and Discussions Section. The Conclusions are drawn in the last section.
SUBJECTS AND METHODS
Dataset construction
In analyzing the neuroblastic tumors, there is a lack of large and publicly available datasets. Therefore, we gathered a set of histological images of neuroblastic tumors from the Tumour Bank of the Kid's Research Institute at the Children's Hospital at Westmead, Sydney, Australia. Tumor access is compliant with local policy, national legislation, and ethical mandates to use the human tissue in research. All patient-specific details were removed, and a de-identified dataset was used for this research.
The initial dataset consisted of high-resolution images of H&E-stained tissue microarrays (TMAs) of neuroblastic tumors that were in svs format with resolution 0.2 μm. For viewing different types of histological structures, the tissue on the slides has been stained. Figure 1 shows a sample tissue array.
Figure 1.
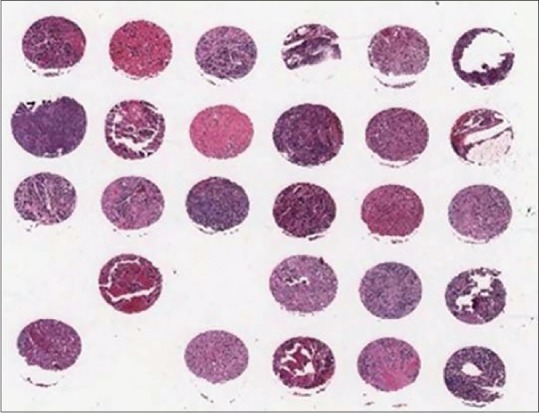
A sample tissue array. The collected dataset consists of tissue microarray images that are scanned by the Aperio ScanScope system. Most images belong to different patients, some of them are duplicate
Tissue samples range from 20 to 40 1.2 mm diameter cores of neuroblastic tumor, stained with H&E, and cut at 3 μm thickness. TMA images were generated by the Aperio ScanScope system; images were viewed and extracted using ImageScope software (Aperio, Leica, USA).[13] Although most images belong to different patients, some of them are duplicates. All tissue samples were classified according to the Shimada classification system as undifferentiated neuroblastoma, differentiating neuroblastoma, poorly differentiated neuroblastoma, ganglioneuroblastoma, and ganglioneuroma. Representative images in these categories are shown in Figure 2.
Figure 2.
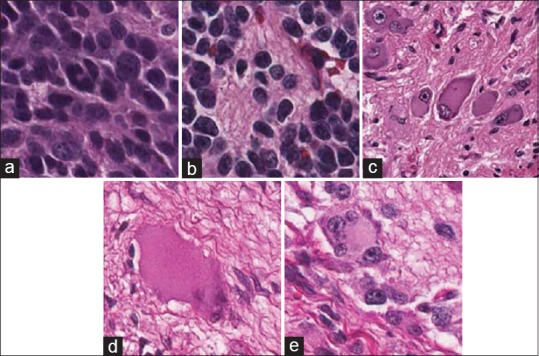
Representative images in neuroblastic tumor categories: (a) Undifferentiated neuroblastoma, (b) differentiating neuroblastoma, (c) poorly differentiated neuroblastoma, (d) ganglioneuroblastoma, and (e) ganglioneuroma. All collected tissue samples were classified according to the Shimada classification system into five different categories. (a-e) The representative images in each category
Areas best representative of each category, and devoid of artifacts, were selected from each tissue core by an expert histopathologist [AC]. At ×40 zoom magnification, the size of these cropped images was 300 × 300 pixels with real size 80 μm × 80 μm which is approximately one-third of the area of an optical microscope high power field of view. Figure 3 shows the quantitative actual size of tissue spots and cropped images.
Figure 3.
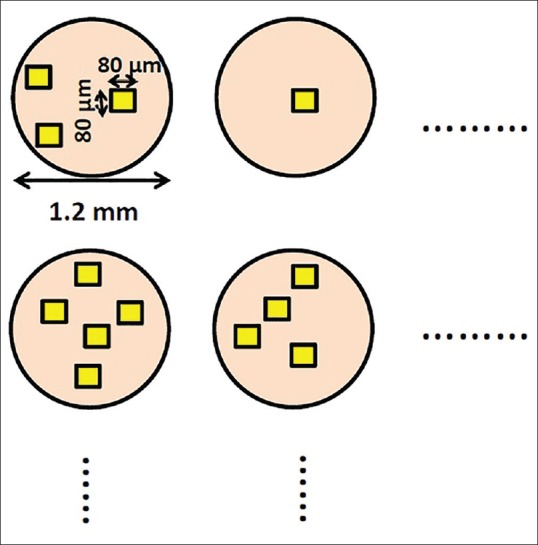
Quantitative actual size of tissue spots and cropped images. The areas which were the best representative of each category were cropped within each tissue core by an expert histopathologist. The cropped images were selected with different characteristics of each class
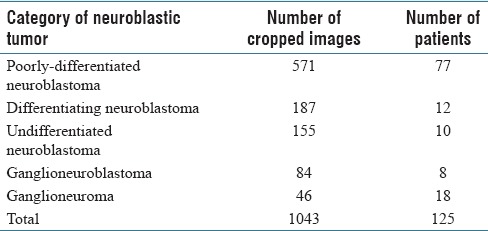
This size was chosen as a compromise between being large enough to capture diagnostic features of each category and small enough for the computational cost. Statistics about the images in our dataset are given in Table 1.
Table 1.
Number of different categories of neuroblastic tumor cropped images in constructed dataset
Methods
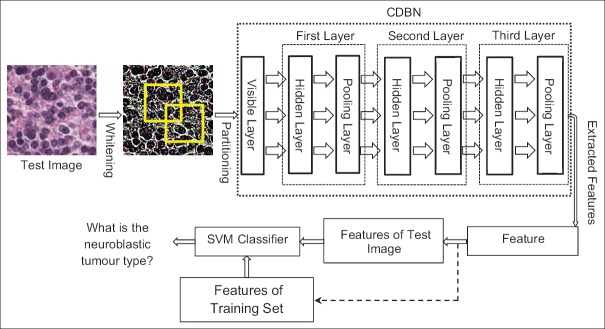
The overall framework of our approach is shown in Figure 4. First, the test (input) image is preprocessed by the whitening method.[14] Then, the preprocessed test image is divided into mini-batches and given to the input (visible) layer of the CDBN. The CDBN extracts high-level features from the test image and feeds them into the feature encoding block to yield new discriminative features. Finally, the SVM classifier is used to classify the test image by comparing the extracted feature with features of the training set images.
Figure 4.
The overall framework of the proposed method. The approach consists of whitening, partitioning, convolutional deep belief network, feature encoding, and support vector machine classifier
Convolutional deep belief network
As a preprocessing step, we apply the whitening method to the input images that makes the image intensity values to be uncorrelated with each other. Whitening projects the input image into the eigenvectors and normalizes them to have a variance of 1 for all intensity values.[14]
In the next step, the whitened image is divided randomly into overlapping mini-batches and given to the visible layer of the CDBN. Mini-batches divide the input images into small chunks and perform the learning for each chunk. They also decrease the noisy information when the sample is not a good representation of the whole data. The CDBN model extracts high-level features from the low-level ones using a hierarchical structure: lower layers extract low-level features and feed into the higher layers. The CDBNs are hierarchical generative models composed of stacked Convolutional Restricted Boltzmann Machines (CRBMs).[15] Each CRBM consists of a visible layer (V), a hidden layer (H), and a pooling layer [Figure 5]. The visible layer is a NV × Nv array of binary units. The hidden layer consists of k groups (or “bases”), where each group is a NH × NH array of binary units resulting in k × N2H hidden units. For each group, there is a dedicated NW × NW (NW = NV−× NH + 1) convolutional window in the visible layer. The symmetric connections between hidden and visible units are represented by a weight matrix W. We can interpret each weight matrix as a filter. The pooling layer also has k groups of units, and each group has Np × Np binary units. The pooling layer shrinks the representation of the hidden layer by a predefined constant factor C. For this purpose; the pooling layer selects the maximum values in the C × C windows of the hidden layer. Applying the max-pooling not only allows the higher layer outputs to be invariant to slight changes in the input but also reduces the overall computational cost.
Figure 5.
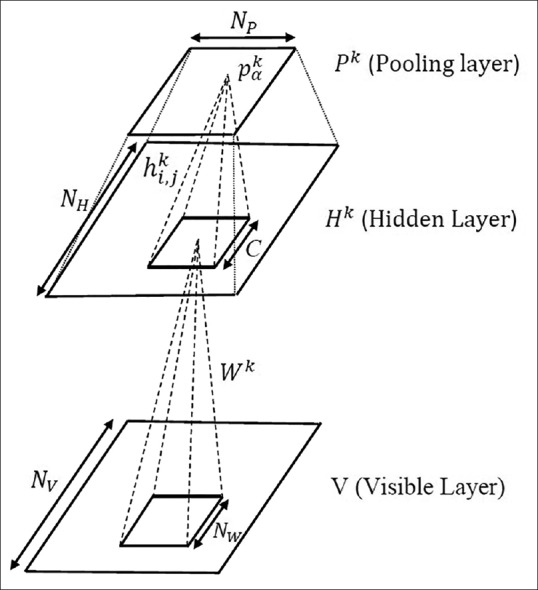
Construction of a Convolutional Restricted Boltzmann Machine with probabilistic max-pooling. The convolutional deep belief network is a hierarchical generative model composed of stacked Convolutional Restricted Boltzmann Machines. A Convolutional Restricted Boltzmann Machine consists of a visible layer, a hidden layer, and a pooling layer
We use a three-layer CDBN to extract features from neuroblastoma histological images. The proposed CDBN has free parameters which need to be determined. The first one is the number of hidden layers. Training a CDBN with fewer hidden layers takes less time but suppresses the performance because the network extracts low-level features from the input images. Increasing the number of hidden layers can improve the performance, but it may cause over-fitting, high computational rate, and slow learning time. The second free parameter is the number of groups in the hidden layers. There is no general theory for choosing this parameter. Like the number of hidden layers, more or fewer units result in slow learning time or low performance, respectively. The third free parameter is the number of mini-batches. Mini-batches can decrease the computational cost of the CDBN network.
Feature encoding
To achieve higher performance, the CDBN features are given to a feature encoding block which computes more discriminative representations. Here, we use the bag of features algorithm[16] as a feature encoding method. The scheme of the bag of features is shown in Figure 6. First, the codebook which is a set of code words is constructed; code words are the extracted CDBN features. Then, the input image is represented by a histogram showing the frequency of the code words in the image.
Figure 6.

The scheme of the feature encoding block. The approach consists of clustering, codebook construction, and representation by histogram of code words
The codebook is modeled using a clustering method. All the extracted CDBN features are clustered to find a set of centroids in the feature space. In this work, the k-means algorithm[17] is used for clustering. A key factor in the construction of the codebook is selection of the number of code words, i.e., codebook size. Csurka et al.[18] showed that the larger codebook size works better for natural image classification. However, Tatiana et al.[19] illustrated that the size of the codebook cannot affect noticeably the accuracy of the medical image classification. To select the best codebook size, we evaluate different codebook sizes in the classification of neuroblastoma histological images and choose the best one. Using the feature encoding block, the input image is represented by a histogram of code words. In the final stage, different categories of neuroblastoma histological images are modeled by training a SVM classifier which classifies the histograms of the feature encoding block.
RESULTS
In this section, we evaluate the performance of the proposed approach for classification of neuroblastoma histological images conducting experiments on the constructed neuroblastic tumor database. Since the first layer in the CDBN learns the common visual information such as edges, we use Kyoto natural image dataset[20] to train the first layer of the CDBN; these images contain a large number of low-level features including edges. The second and third layers are trained with neuroblastic tumor database. For this purpose, the database is divided randomly into three subsets: the first one for validation (211 images), the second one for training (623 images), and the third one for testing (209 images). We select the optimum values for free parameters using the validation set and evaluate the final system using training and testing sets.
Experimental setup
The applied algorithm has many parameters to be selected such as number of hidden layers, number of groups in each hidden layer, number of mini-batches, size of the codebook, and SVM parameters. We randomly divide the validation set into two subsets including 150 and 61 images. We train the algorithm using 150 images and compute the accuracy of the system using 61 images to tune the free parameters of the algorithm. To have a better estimation of the accuracy, we repeat the above procedure multiple times (10 times) and compute the average overall experiments.
We tested CDBN with one layer and increased it to two and three layers, while the number of mini-batches was 10. We stopped increasing the number of layers where the performance peaked. According to Table 2, the best accuracy was found for a three-layer network, while the number of groups in the first, second, and third layers was 24, 20, and 40, respectively. Hence, we considered a three-layer network in the next experiments.
Table 2.
Average classification accuracy of the convolutional deep belief network over constructed dataset using different number of hidden layers

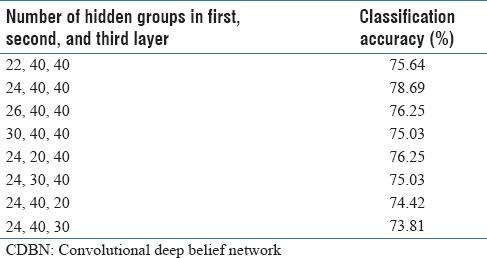
To choose the number of groups in the hidden layers, we computed the accuracy of the CDBN for a different number of groups in the first, second, and third layers, whereas the number of mini-batches was 10. According to Table 3, the best accuracy was found when the number of groups in the first, second, and third layers was 24, 40, and 40, respectively. These values were set in the next experiments.
Table 3.
Average classification accuracy of the convolutional deep belief network over neuroblastic tumor dataset using different number of groups in the hidden layers
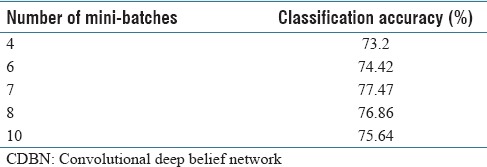
We completed another experiment to find the optimum number of mini-batches. Table 4 shows the accuracy of the classification for a different number of mini-batches, the size of the mini-batches was 70 × 70 pixels. The best accuracy was found when the number of mini-batches was seven.
Table 4.
Average classification accuracy of the convolutional deep belief network over constructed dataset for different number of mini-batches
Furthermore, we chose the optimum value of the codebook size for the bag of features algorithm. For this purpose, we tested five different codebook sizes, starting with 100 and following with 200, 300, 400, and 500. Figure 7 shows the weighted average F-measure versus size of the codebook. The best accuracy was found when the size of the codebook was 300. This value was considered in the next experiments.
Figure 7.
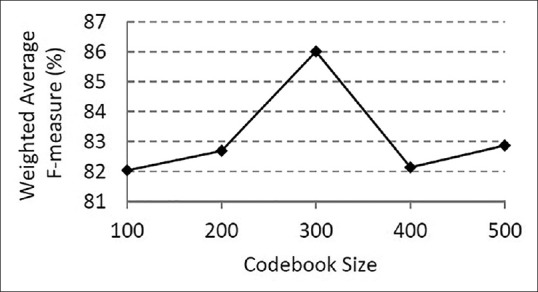
Weighted average F-measure versus codebook size. To select the best codebook size, we evaluated different codebook sizes in the classification of neuroblastoma histological images and chose the best one. The highest weighted average F-measure was found when the size of the codebook was 300
Finally, parameters of the SVM classifier were selected according to the work of Gheisari et al.[2] We used SVM with Radial Basis Function (RBF) kernel and γ value was considered as 0.004.
System evaluation
We train a CDBN with three hidden layers. The first layer consists of 24 bases of 10 × 10 pixel filter. The second and third layers contain 40 bases of 10 × 10 pixel filters. The pooling ratio of each layer is 2. The learned first layer bases [Figure 8a] are oriented edge filters which learned from natural images. Figure 8b shows the learned second layer bases which are visualized as a weighted linear combination of the first layer bases and many of them respond to contours, corners, and angles. The learned third layer bases which are the weighted linear combinations of the first and second layer bases are shown in Figure 8c.
Figure 8.
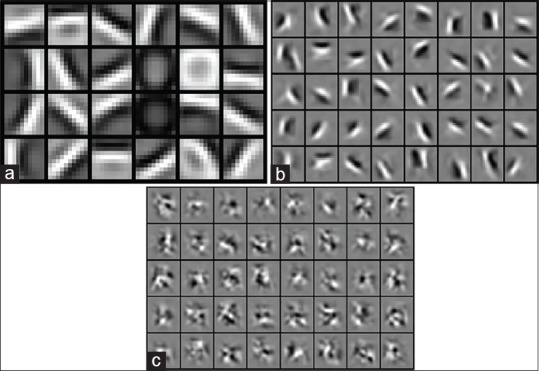
The learned first, second, and third layer bases of convolutional deep belief network (a-c). (a) First layer bases learned from natural images, (b) second layer bases learned from neuroblastic tumor images, (c) third layer bases learned from neuroblastic tumor images
To evaluate the proposed method, we use 80% of the dataset images which are not seen in the experimental setup. They are divided randomly into the training set (623 images) and testing set (209 images). We train the final model using the training set with the parameter values selected in experimental setup section and test using the testing set. We repeat this procedure multiple times (10 times) and report the average accuracy. We evaluate the proposed method (CDBN) with the standard bag of features and the pyramid bag of features'[12] algorithms as the feature encoding techniques. In each case, we used two kernel types for the SVM classifier: the first one is RBF kernel and the second one is histogram intersection kernel.[21] The performance of our algorithm measured by the weighted average (weighted by the number of samples in each class) F-measure, recall, and precision is reported in Table 5. For comparison, the performance of the PCLBP,[2] CLBP,[22] and CNNs is reported in Table 5 as the benchmarks. A CNN is a class of deep feedforward artificial neural networks which has been applied effectively to image classification tasks. Here, we compare our approach with three standard CNN structures: visual geometry group 16 (VGG-16), VGG-19, and AlexNet. VGG-16 contains 12 convolutional layers, 5 pooling layers, and 3 fully connected layers.[23] VGG-19 has 14 convolutional layers, 5 pooling layers, and 3 fully connected layers.[23] AlexNet consists of 5 convolutional layers, 3 pooling layers, and 3 fully connected layers.[24]
Table 5.
Weighted average precision, recall, and F-measure of the proposed method and the benchmarks

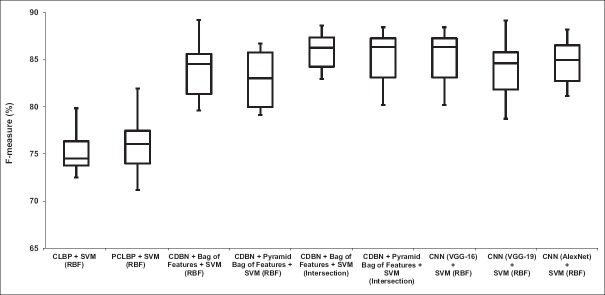
According to Table 5, the proposed method in the best case obtains 10.05% and 10.86% higher F-measure compared to PCLBP and CLBP, respectively. Furthermore, our proposed approach achieved 3.41%, 2%, and 1.21% higher F-measures compared to VGG-16, VGG-19, and AlexNet, respectively. The weighted average of precision, recall, and F-measure of our algorithm is better than PCLBP, CLBP, and CNNs.
Distribution of the computed F-measures for different approaches over the ten trials is presented in Figure 9. It shows that combination of CDBN with the bag of features works better than CLBP, PCLBP, and CNNs.
Figure 9.
Comparison between our algorithm (convolutional deep belief network + feature encoding) and benchmarks (completed local binary pattern, patched completed local binary pattern, convolutional neural network (visual geometry group-16), convolutional neural network (visual geometry group-19), and convolutional neural network (AlexNet). To compare the performance of our algorithm with the benchmarks, we computed the distribution of the weighted average F-measure for different approaches over the ten trials
To check if the proposed method was significantly better than the benchmarks, we completed a t-test (with significance level of α = 5%) for CLBP, PCLBP, VGG-16, VGG-19, and AlexNet [Table 6]. The results showed that the combination of CDBN with bag of features and histogram intersection kernel SVM significantly improved the classification accuracy compared to CLBP, PCLBP, and VGG-16. A representative confusion matrix has been shown in Table 7. As can be seen, the poorest computer performance was in discriminating between poorly differentiated and differentiating neuroblastoma, a distinction that human pathologists also find difficult in limited fields of view.
Table 6.
T-test for comparison of CLBP, PCLBP, CNN (VGG-16), CNN (VGG-19), and CNN (AlexNet) with CDBN, significance level is 0.05
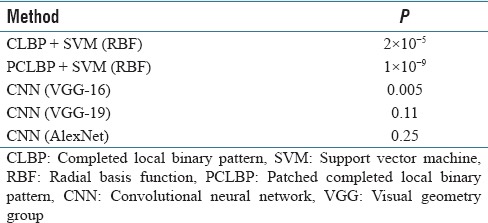
Table 7.
A representation confusion matrix

Figure 10a shows the examples of the differentiating type which are misclassified as poorly differentiated type. As can be seen, they are very similar to the actual poorly differentiated ones that are shown in Figure 10b.
Figure 10.
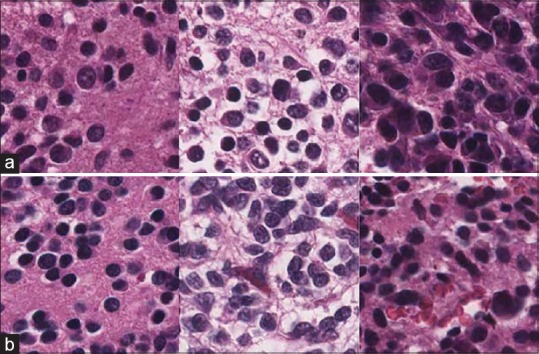
Examples of actual and predicted images (a and b). (a) The samples of differentiating type predicted as poorly differentiated, (b) the samples of actual poorly differentiated type. The poorest computer performance was in discriminating between poorly differentiated and differentiating neuroblstoma, a distinction that human pathologists also find difficult in limited fields of view
Sensitivity of test samples
As mentioned, we tested our algorithm with manually selected 300 × 300 pixels subimages that are the best representative of the neuroblastoma tissues. We evaluated whether the careful selection of the regions does not bias the proposed algorithm. To evaluate the proposed method, we use 623 manually selected subimages as the training set and 138 TMA cores as the testing set. Here, the method selects ten 300 × 300 pixels subimages randomly from each TMA core. The randomly selected subimages are likely to include common artifacts seen in TMA cores such as tissue holes, red blood cells, over-staining, and under-staining. A sample of randomly selected subregions of a TMA core is shown in Figure 11. The method classifies each randomly selected subimage using the proposed CDBN algorithm and assigns a class to the TMA core by the majority vote among ten classes corresponding to ten subimages. In cases with two or more equal majority votes, the algorithm assigns the class with the highest prior probability (the class with the highest number of samples in the training set) to the TMA core. The performance of the algorithm is measured by the weighted average of F-measure, precision, and recall over 138 TMA cores. We repeat this procedure 10 times and calculate the average accuracy of precision, recall, and F-measure as shown in Table 8. As can be seen, the accuracy of our system decreased when we applied it on the 138 TMA cores compared to 209 manually selected subimages, but this is not surprising because the morphological features are more concentrated on small regions. Investigating the results shows that the majority of misclassifications occur between poorly differentiated and differentiated types of neuroblastoma. As mentioned before, distinction between these two types is difficult even for pathologists.
Figure 11.
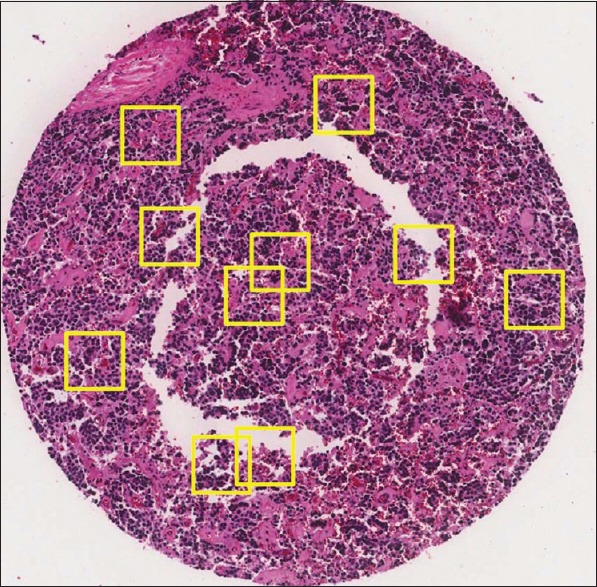
A sample of a tissue microarrays core with randomly selected subimages. The randomly selection of subimages is likely to include common artifacts seen in tissue microarrays cores
Table 8.
Weighted average precision, recall, and F-measure of the proposed method over 138 tissue microarray cores

DISCUSSION
CDBN is a new approach to classify neuroblastoma histological images into five different groups. Our approach has the following advantages over the existing methods:
Neuroblastoma tumor images have a complex texture with complicated features in comparison with other types of cancers. It is the first time that neuroblastoma histological images are classified using a deep learning approach
The previous methods for classification of neuroblastoma histological images used handcrafted features extracted from the color and the texture of the images. However, the proposed deep learning approach, unlike handcrafted feature approaches, is an end-to-end feature learning approach which learns high-level structural features from the training data
Previous works which use deep networks in histological image classification use the extracted deep features directly for classification. Here, we apply the bag of features’ algorithm for refining the CDBN features to improve the classification accuracy. Moreover, bag of features’ algorithm learns discriminative features from input images and analyses the relationship between local visual patterns and image classes
The proposed method extracts high-level features which are generally difficult to be detected by human eyes. However, these features can be recognized by computer efficiently.
Our experimental results showed that combination of CDBN with the bag of features outperforms existing approaches. Although results are promising, this study has a limitation too. As there is no public and available dataset of neuroblastoma histological images, our method is tested only on one dataset which has been gathered and consists of 1043 images.
CONCLUSION
In this article, we presented a combination of CDBN with feature encoding model to classify neuroblastic tumors into five different categories using extracted high-level feature vectors from histological images. CDBN uses a deep architecture to learn complex features from neuroblastoma histological images and combine them with the bag of features to yield new features which increased the classification accuracy. The evaluation was conducted on a gathered dataset with 1043 cropped images of five different categories. We compare the results obtained by our system with the CLBP, PCLBP, and CNNs. Results indicate that combination of CDBN with feature encoding has improved the average weighted F-measure compared to PCLBP, CLBP, and CNNs. In the future work, we will combine CNNs with the bag of features algorithm to classify histological images of neuroblastic tumors.
Financial support and sponsorship
Nil.
Conflicts of interest
There are no conflicts of interest.
Acknowledgment
The authors would like to thank Prof. Massimo Piccardi for his constructive comments and suggestions.
Footnotes
Available FREE in open access from: http://www.jpathinformatics.org/text.asp?2018/9/1/17/231765.
REFERENCES
- 1.Park JR, Eggert A, Caron H. Neuroblastoma: Biology, prognosis, and treatment. Hematol Oncol Clin North Am. 2008;55:97–120. doi: 10.1016/j.pcl.2007.10.014. [DOI] [PubMed] [Google Scholar]
- 2.Gheisari S, Catchpoole DR, Charlton A, Kennedy PJ. The 15th Australasian Data Mining Conference. Melbourne: 2017. Patched completed local binary pattern is an effective method for neuroblastoma histological image classification; p. 8. (In Press) [Google Scholar]
- 3.Hipp J, Flotte T, Monaco J, Cheng J, Madabhushi A, Yagi Y, et al. Computer aided diagnostic tools aim to empower rather than replace pathologists: Lessons learned from computational chess. J Pathol Inform. 2011;2:25. doi: 10.4103/2153-3539.82050. [DOI] [PMC free article] [PubMed] [Google Scholar]
- 4.Kong J, Sertel O, Shimada H, Boyer KL, Saltz JH, Gurcan MN, et al. Computer-aided evaluation of neuroblastoma on whole-slide histology images: Classifying grade of neuroblastic differentiation. Pattern Recognit. 2009;42:1080–92. doi: 10.1016/j.patcog.2008.10.035. [DOI] [PMC free article] [PubMed] [Google Scholar]
- 5.Tafavogh S, Meng Q, Catchpoole DR, Kennedy PJ. IASTED 11th International Conference on Biomedical Engineering (BioMed) Zurich: 2014. Automated quantitative and qualitative analysis of the whole slide images of neuroblastoma tumour for making a prognosis decision; pp. 244–51. [Google Scholar]
- 6.Otsu N. A threshold selection method from gray-level histograms. IEEE Trans Syst Man Cybern. 1979;9:62–6. [Google Scholar]
- 7.Shimada H, Ambros IM, Dehner LP, Hata J, Joshi VV, Roald B, et al. The international neuroblastoma pathology classification (the shimada system) Cancer. 1999;86:364–72. [PubMed] [Google Scholar]
- 8.Zhu Q, Du B, Turkbey B, Choyke PL, Yan P. Deeply-Supervised CNN for Prostate Segmentation. arXiv: 170307523. 2017:1–8. [Google Scholar]
- 9.Turkki R, Linder N, Kovanen PE, Pellinen T, Lundin J. Antibody-supervised deep learning for quantification of tumor-infiltrating immune cells in hematoxylin and eosin stained breast cancer samples. J Pathol Inform. 2016;7:38. doi: 10.4103/2153-3539.189703. [DOI] [PMC free article] [PubMed] [Google Scholar]
- 10.Abdel-Zaher AM, Eldeib AM. Breast cancer classification using deep belief networks. Exp Syst Appl. 2016;46:139–44. [Google Scholar]
- 11.Wisconsin Breast Cancer Dataset. University of California at Irvine Machine Learning Repository. 2014. [Last accessed on 2018 Apr 23]. Available from: https://archive.ics.uci.edu/ml/datasets/Breast+Cancer+Wisconsin+%28Original%29 .
- 12.Lazebnik S, Schmid C, Ponce J. Beyond bags of features: Spatial pyramid matching for recognizing natural scene categories. The Conference on Computer Vision and Pattern Recognition (CVPR) 2006:2169–78. [Google Scholar]
- 13.ImageScope. 2016. [Last accessed on 2018 Apr 23]. Available from: http://www2.leicabiosystems.com/l/48532/2014-11-18/35cqc .
- 14.Kessy A, Lewin A, Strimmer K. Optimal whitening and decorrelation. arXiv: 151200809. 2017:1–14. [Google Scholar]
- 15.Lee H, Grosse R, Ranganath R, Ng AY. Unsupervised learning of hierarchical representations with convolutional deep belief networks. Commun ACM. 2011;54:95–103. [Google Scholar]
- 16.O'Hara S, Draper BA. Introduction to the bag of features paradigm for image classification and retrieval computing research repository. arXiv: 1101 3354. 2011:1. [Google Scholar]
- 17.Kanungo T, Mount DM, Netanyahu NS, Piatko CD, Silverman R, Wu AY. An efficient k-means clustering algorithm: Analysis and implementation. IEEE Trans Pattern Anal Mach Intell. 2002;24:881–92. [Google Scholar]
- 18.Csurka G, Dance CR, Fan L, Willamowski J, Bray C. Visual Categorization with Bags of Keypoints. In Workshop on Statistical Learning in Computer Vision, ECCV. 2004:1–22. [Google Scholar]
- 19.Tatiana T, Francesco O, Barbara C. CLEF2007 image annotation task: An SVM-based cue integration approach. Proceedings of Image CLEF. 2007 [Google Scholar]
- 20.Lee H, Largman Y, Pham P, Lee H, Pham P, Largman Y. ACM. Vancouver, British Columbia, Canada: 2009. Unsupervised feature learning for audio classification using convolutional deep belief networks. 22nd International Conference on Neural Information Processing Systems; pp. 1096–104. [Google Scholar]
- 21.Maji S, Berg AC, Malik J. Classification using intersection kernel support vector machines is efficient. The Conference on Computer Vision and Pattern Recognition (CVPR) 2008:1–8. [Google Scholar]
- 22.Guo Z, Zhang L, Zhang D. A completed modeling of local binary pattern operator for texture classification. IEEE Trans Image Process. 2010;19:1657–63. doi: 10.1109/TIP.2010.2044957. [DOI] [PubMed] [Google Scholar]
- 23.Simonyan K, Zisserman A. Very deep convolutional networks for large-scale image recognition. arXiv: 1409.1556 [Google Scholar]
- 24.Krizhevsky A, Sutskever I, Hinton GE. Proceedings of the 25th International Conference on Neural Information Processing Systems. Lake Tahoe, Nevada: Curran Associates Inc; 2012. ImageNet classification with deep convolutional neural networks; pp. 1097–105. [Google Scholar]


