

Abstract
Uric acid is the end product of purine metabolism in humans and is an alternative physiological substrate for myeloperoxidase. Oxidation of uric acid by this enzyme generates uric acid free radical and urate hydroperoxide, a strong oxidant and potentially bactericide agent. In this study, we investigated whether the oxidation of uric acid and production of urate hydroperoxide would affect the killing activity of HL-60 cells differentiated into neutrophil-like cells (dHL-60) against a highly virulent strain (PA14) of the opportunistic pathogen Pseudomonas aeruginosa. While bacterial cell counts decrease due to dHL-60 killing, incubation with uric acid inhibits this activity, also decreasing the release of the inflammatory cytokines interleukin-1β (IL-1β) and tumor necrosis factor-α (TNF- α). In a myeloperoxidase/Cl-/H2O2 cell-free system, uric acid inhibited the production of HOCl and bacterial killing. Fluorescence microscopy showed that uric acid also decreased the levels of HOCl produced by dHL-60 cells, while significantly increased superoxide production. Uric acid did not alter the overall oxidative status of dHL-60 cells as measured by the ratio of reduced (GSH) and oxidized (GSSG) glutathione. Our data show that uric acid impairs the killing activity of dHL-60 cells likely by competing with chloride by myeloperoxidase catalysis, decreasing HOCl production. Despite diminishing HOCl, uric acid probably stimulates the formation of other oxidants, maintaining the overall oxidative status of the cells. Altogether, our results demonstrated that HOCl is, indeed, the main relevant oxidant against bacteria and deviation of myeloperoxidase activity to produce other oxidants hampers dHL-60 killing activity.
Abbreviations: ABAH, 4-aminobenzoic acid hydrazide; CFU, colony-forming units; DAPI, 4',6-diamidino-2-phenylindole; GSH, glutathione; GSSG, glutathione disulfide; dHL-60, differentiated human promyelocytic leukemia cells; HL-60, human promyelocytic leukemia cells; IL-1β, interleukin 1β; LDH, lactate desidrogenase; PA14, Pseudomonas aeruginosa UCBPP-PA14; PI, propidium iodide; TNF-α, tumor necrosis factor α; UA, uric acid
Keywords: Uric acid, Myeloperoxidase, Hypochlorous acid, dHL-60, Pseudomonas aeruginosa, Microbicidal
Graphical abstract

Highlights
-
•
Uric acid decreased microbicide activity and release of cytokines by dHL-60 cells.
-
•
Uric acid decreased HOCl in cells and in the myeloperoxidase/Cl-/H2O2 system.
-
•
Uric acid induces a pro-oxidant redox imbalance.
-
•
HOCl is crucial for Pseudomonas aeruginosa killing by dHL-60.
1. Introduction
Neutrophils are the first cells to be recruited in the defense against microbial invasion in mammalians. Microbe recognition by specific receptors at neutrophil surface induces phagocytosis, release of cytoplasmic granules into the phagosome and generation of oxidants by a process called neutrophil oxidative burst. Granule proteins discharged into the phagosome digest microorganisms and act synergistically with oxidants to kill them [1], [2], [3], [4]. The neutrophil oxidative burst starts by the reduction of oxygen to the anion radical superoxide by NADPH oxidase (Nox) [5]. Superoxide dismutates to hydrogen peroxide in the acidic intraphagosomal environment [6] and this is the main source of hydrogen peroxide, that in turn oxidizes chloride to hypochlorous acid (HOCl), the strongest microbicide in neutrophils [2], [7], [8]. Oxidation of chloride to HOCl is catalyzed by myeloperoxidase, denoting the essential role of this enzyme against microorganisms [7], [9]. However, myeloperoxidase has multiple substrates and the oxidation of chloride to HOCl is not the solely killing mechanism of the enzyme [2], [10]. Substrates that donate two electrons to the intermediate myeloperoxidase-Compound I include chloride, bromide and thiocyanate [11]. Still, chloride is the most abundant substrate in the phagosome [12], [13].
Myeloperoxidase also functions as a classical peroxidase where Compound I and Compound II oxidize substrates by removing a single electron; it yields a free radical and returns the enzyme to the ferric state. An important physiological substrate of myeloperoxidase-Compound I and Compound II is uric acid. Uric acid (7,9-dihydro-1H-purine-2,6,8(3 H)-trione) is the end product of purines catabolism in humans and accumulates in plasma in a range of 50–420 µM in healthy individuals, achieving millimolar concentration in hyperuricemia [14]. The high concentration of uric acid in body fluids and the fast reaction with both myeloperoxidase-Compound I and Compound II make it a relevant substrate for myeloperoxidase [15]. Uric acid has been extensively studied by its antioxidant properties (one-electron reduction potential = 0.59 V, pH 7.0) [16], being able to react with hydroxyl radical, singlet oxygen, hypochlorous acid, to chelate transition metal ions and to repair free radicals in proteins [17], [18], [19], [20]. Despite its antioxidant ability, uric acid and its monoanion urate increase oxidative damage and inactivate enzymes sensitive to oxidative stress [21], [22], [23], [24]. Products of uric acid oxidation react with glutathione, methionine and thiol-peroxidases [25], [26]. Therefore, the predominant effect of uric acid as pro or antioxidant is still a matter of debate [27].
The oxidation of uric acid by myeloperoxidase and other peroxidases generates the unstable urate free radical, which reacts at diffusion-controlled rate with superoxide [28] to form urate hydroperoxide [15], [25], [29]. This reaction is of particular relevance into the phagosome where there are plentiful amounts of superoxide, hydrogen peroxide and myeloperoxidase. Urate hydroperoxide is a strong oxidant [25], [26] and potentially bactericide. Therefore, the oxidation of uric acid and production of urate hydroperoxide in neutrophils could contribute to the bactericidal effect of these cells.
In addition to the pro-oxidant effect, uric acid has been widely described by its pro-inflammatory properties. It can precipitate as monosodium urate crystals and activate the NLRP3 inflammasome to release IL-1β [30], [31]. Soluble uric acid released from dying cells initiates inflammatory response by recruiting neutrophils [32], [33]. Uric acid activates NADPH oxidase to produce superoxide [34], activates MAP kinases and the nuclear factor kappa-B (NF-kB) increasing the expression of monocyte chemoattractant protein-1 (MCP-1) [35], [36], primes mononuclear immune cells enhancing the pro-inflammatory effect of toll-like receptors ligands [37] and induces formation of neutrophils extracellular traps (NETs) [38]. All this pro-inflammatory capacity could also stimulate immune cells and increase their bactericidal effect.
Therefore, we designed this study to address the question of whether uric acid would indeed improve the killing activity of neutrophil-like cells. We differentiated HL-60 cells into neutrophils (dHL-60) and incubated them with the opportunistic Gram-negative pathogen Pseudomonas aeruginosa, a major cause of hospital acquired infections, microbial keratitis and chronic lung infections in cystic fibrosis [39], [40], [41]. Surprisingly, we found that uric acid decreased the killing activity of dHL-60 cells. This effect was likely related to the disruption in HOCl production by uric acid. Therefore, the decrease of HOCl levels is severely detrimental to the killing potential of dHL-60 cells and the production of other oxidants like urate free radical and urate hydroperoxide is not sufficed to overcome HOCl deprivation.
2. Material and methods
2.1. Materials
Human leukocyte MPO (EC 1.7.1.11) was purchased from Planta Natural Products (Vienna, Austria). Fetal bovine serum was from VitroCell (Campinas, Brazil). R19-S probe was from FutureChem (Seoul, Korea). Xanthine oxidase was purchased from Calbiochem – Merck Millipore (Darmstadt, Germany). dihydrorhodamine 123 (DHR) was purchased from Life Technologies (Carlsbad, CA, USA). All other reagents including cell culture materials RPMI 1648, penicillin and streptomycin, uric acid, 5,5'-dithiobis-(2-nitrobenzoic acid) (DTNB), taurine, catalase, cytochrome c, propidium iodide (PI), 4’,6-diamidino-2-phenylindole dye (DAPI), phorbol myristate acetate (PMA), staurosporin and acetaldehyde were purchased from Sigma-Aldrich (Darmstadt, Germany).
2.2. Human cell culture and differentiation
Human leukemic cell line (HL-60) (BCRJ, RJ, Brazil) was maintained in RPMI 1648 growth medium supplemented with 20% fetal bovine serum (FBS), streptomycin (100 µg/mL) and penicillin (100 U/mL) at 5% CO2 and 37 °C. HL-60 cells were differentiated into neutrophils (dHL-60) by the presence of 1.3% dimethyl sulfoxide (DMSO) in growth medium supplemented with 10% FBS. After five days, dHL-60 were centrifuged at 350g for 10 min and washed twice with sterile saline (0.9% NaCl). Cell pellet was then ressuspended into phosphate buffer saline supplemented with glucose (PBS glucose: 10 mM Na2HPO4; 2 mM KH2PO4; 137 mM NaCl, 1 mM CaCl2, 0.5 mM MgCl2 and 1 g/L glucose) or in growth medium without antibiotics. The differentiation was confirmed by superoxide production using the cytochrome c assay. dHL-60 (1 × 10⁶ cells) were incubated with taurine (5 mM) and cytochrome c (40 µM) in 300 µL PBS/glucose. Cells were activated with PMA (100 ng/mL) and samples were red at 550 nm in a Synergy H1 Hybrid Reader (Biotek, USA). A flux of 2–4 µM/min was expected in differentiated cells.
2.3. Bacterial culture
Pseudomonas aeruginosa UCBPP-PA14 (PA14) [42] was grown in Luria-Bertani medium (LB) overnight under shaking at 200 rpm and 37 °C. The day after, cells were diluted to OD600 nm = 0.1 and incubated again until OD600 nm = 0.4 or OD600 nm = 2 for initial or late exponential phase of growth, respectively.
2.4. Bacterial killing assay
dHL-60 cells (2 × 10⁶) were challenged with PA14, OD600 nm = 2, multiplicity of infection (MOI) 1:10 in absence or presence of 0.2; 0.5 or 2 mM uric acid and incubated at 37 °C for 1, 2 or 3 h in antibiotic-free RPMI medium. After incubation, samples were collected and diluted in series so they contained 102–106 bacteria/mL. Ten microliters of these dilutions were spread on LB agar, incubated for 14–16 h at 37 °C and the colony-forming units (CFU) were counted.
To test the bacterial killing by purified myeloperoxidase, we first incubated 100 nM myeloperoxidase, 150 mM NaCl in minimum medium (70 mM phosphate buffer, 18 mM (NH4)2SO4, 100 µM CaCl2, 2 mM MgSO4 and 2% glucose, pH 7.1) in the absence or presence of 0.5 mM uric acid. The production of HOCl was initiated by addition of 100 µM H2O2 and allowed to react for 30 min at room temperature. The reaction was stopped by adding 50 µg/mL catalase for 5 min. This ensured that all remaining H2O2 was removed to avoid any unspecific effect upon bacterial killing. Alternatively to the above, 0.5 mM uric acid was added only 30 min after myeloperoxidase/Cl-/H2O2 reacting. Uric acid was allowed to react for 0, 10 or 30 min for evaluating the scavenger effect of uric acid upon HOCl rather than the competition by myeloperoxidase and inhibition of HOCl formation. After this pre-incubation the PA14 (1 × 10⁶ cells/mL) was added to the system and incubated for 2 h at 37 °C with constant shaking (200 rpm). Serial dilutions were immediately spread on agar plates, and the colony-forming units were determined after overnight incubation at 37 °C.
2.5. Quantification of hypochlorous acid
Measurement of hypochlorous acid production by purified myeloperoxidase and by dHL-60 was performed by 2-nitro-5-thiobenzoate (TNB) [43]. dHL-60 cells (5 × 10⁶) were suspended in PBS glucose with or without uric acid. Cells were infected with PA14 (MOI 1:10) and incubated at 37 °C for 1 h. The myeloperoxidase/Cl-/H2O2 system was similar to the used in the bacterial killing assay: 100 nM myeloperoxidase, 150 mM NaCl, 5 mM taurine in minimum media (70 mM phosphate buffer, 18 mM (NH4)2SO4, 100 µM CaCl2, 2 mM MgSO4 and 2% glucose, pH 7.1) in the absence or presence of 0.1, 0.2 or 0.5 mM uric acid. Reaction was initiated by adding 100 µM H2O2 and incubated for 30 min at room temperature. Reaction was stopped by incubating with 50 µg/mL catalase. The measurement of HOCl was also performed when 0.5 mM uric acid was added 30 min after myeloperoxidase/Cl-/H2O2 reacting (see above) to evaluate the scavenger effect of uric acid upon HOCl rather than the inhibition of HOCl formation. A five-fold dilution of dHL-60 or myeloperoxidase/Cl-/H2O2 reaction system was incubated with 80 µM TNB by 15 min in the dark. The oxidation of TNB to the colorless DTNB (5,5'-dithiobis-2-nitrobenzoic acid) by taurine chloramine was measured at 412 nm and quantified using TNB molar absorption coefficient (ε412 nm= 14,200 M−1 cm−1). Since two TNB are consumed to form one DTNB per taurine chloramine, the molar absorption coefficient was multiplied by two, i.e, 28,400 M−1 cm−1 [43].
The production of HOCl by dHL-60 was also measured using a specific fluorescent probe that permeates the cell membrane [44], [45]. dHL-60 (5 × 10⁶) were suspended in PBS glucose containing 10 µM R19-S probe in the absence or presence of 0.5 mM uric acid or 50 µM 4-aminobenzoic acid hydrazide (ABAH). Cells were infected with PA14 (MOI 1:10) and incubated at 37 °C for 1 h. Alternatively, cells were activated with 100 ng/mL PMA (positive control for HOCl production). The samples were centrifuged at 180g for 10 min and the pellets were washed in PBS. Two hundred microliters 1.3% paraformaldehyde were added to the pellet and incubated at room temperature for 15 min. Cells were washed once again in PBS and stained with 4',6-diamidino-2-phenylindole (DAPI). After one final wash, cells were suspended in mounting media Fluor Mount, spread over a microscope slide and covered with a coverslip. Images were acquired with a LSM 780-NL9 confocal Carl Zeiss microscope (Göttingen, Germany) with all parameters fixed for imaging all conditions. Fluorescence intensity (λex = 515 nm, λem = 545 nm) of 10 different fields was quantified using ImageJ software.
2.6. HL-60 cell viability
Differentiated HL-60 cells (1 × 10⁶) were incubated in the absence or presence of uric acid (0.2; 0.5 and 2 mM) and infected with PA14 (MOI 1:10) for 1 or 2 h at 37 °C. After incubation, samples were centrifuged at 150g for 10 min and the pellets were incubated with 10 µg/mL propidium iodide (PI) in PBS for 15 min. Following incubation, the percentage of viable and dead cells was determined using a BD Biosciences flow cytometry (San Jose, CA, USA). Fluorescence of labeled cells was detected with λex = 535 nm, λem = 620 nm. Staurosporine (5 μM) was used as positive control [46].
To evaluate the activity of lactate dehydrogenase (LDH) in dHL-60 supernatant, the cells (1 × 10⁵) were infected with PA14 (MOI 1:10) in the absence or presence of uric acid (0.1–2.0 mM) and incubated for 3 h at 37 °C. After this incubation period, the plate was centrifuged 200g for 5 min and the supernatants were collected. LDH activity was measured using a Cytotox kit and presented as the percentage relative to the positive control, i.e. dHL-60 in presence of lysis buffer, according to the manufacturer's recommendations (Promega, Wiscosin, USA).
2.7. Cytokine release assay
dHL-60 cells (2 × 10⁶) were challenged with PA14 (MOI 1:10) in absence or presence of 0.2; 0.5 or 2 mM uric acid and incubated at 37 °C for 1, 2 or 3 h in antibiotic-free RPMI. Supernatant was recovered after each time point and centrifuged at 800g for 5 min at 4 °C. The secretion of interleukin-1β (IL-1β) and tumor necrosis factor-α (TNF-α) was measured by enzyme-linked immunosorbent assay (ELISA) following manufacturer's instruction (R&D Systems, Minneapolis, USA).
2.8. Total reactive oxygen species using dihydrorhodamine 123 (DHR)
Differentiated HL-60 cells (1 × 10⁶) were incubated with PA14 (MOI 1:10) in PBS glucose pH 7.4 (10 mM; Na2HPO4; 2 mM KH2PO4; 137 mM NaCl, 1 mM CaCl2, 0.5 mM MgCl2 and 1 g/L glucose) and DHR (5 μM) in absence or presence of uric acid (0.2 or 0.5 mM). After 1 h, samples were washed and the intracellular DHR fluorescence (λex = 500 nm, λem = 536 nm) was measured in a BioTek Synergy H1 Hybrid microplate reader (Winooski, USA).
2.9. Superoxide detection by dihydroethidine (DHE)
Differentiated HL-60 (1 × 10⁶ cells) were incubated with PA14 (MOI 1:10) in PBS supplemented with glucose in presence of uric acid (0.05–0.5 mM), or diphenyleneiodonium (20 μM, DPI). The reaction of superoxide with DHE (10 μM) was measured by specific production of 2-hydroxyethidium (2-OH-E+). Specific fluorescence of 2-OH-E+ by using λex = 396 nm and λem = 579 nm allows the measurement of this product with no interference of other oxidation products like ethidium [47]. Fluorescence kinetics was measured at 37 °C in a BioTek Synergy H1 Hybrid plate reader (Winooski, USA).
2.10. Quantification of GSH and GSSG by LC/MS/MS system
GSH and GSSG were quantified by LC-MS/MS according to Carroll et al. [48] with modifications. dHL-60 cells (5 × 10⁶) were infected with PA14 (MOI 1:10) and incubated for 1 h at 37 °C with different concentrations of uric acid (0.1, 0.2 or 0.5 mM) in PBS glucose pH 7.4. After incubation, extraction buffer was added to a final concentration 0.2%TCA; 0.1 mM DTPA and 0.2 µg/mL N-acetyl cysteine (NAC, internal standard). Samples were incubated on ice for 15 min, vortexed for 45 s and re-incubated on ice for 15 min. The pH of each sample was adjusted to 2.0 by mixing with 200 µL mobile phase A (0.75 mM ammonium formate, 0.01% formic acid). Cellular debris were removed by centrifugation at 5000g at 4 °C for 10 min. Supernatants were collected and injected into LC-MS/MS system [48]. The analyses were performed in a 6600 Triple-TOF mass spectrometer (AB Sciex, CA) coupled with electrospray ionization source (ESI), operated in positive mode. The post-acquisition MRM-like data used for quantification of GSH (m/z 308.0911 → 179.0462), GSSG (m/z 613.1592 → 355.0741) and internal standard NAC (m/z 164.0 → 76.0215) were completed with collision energies for each individual transition (22 V, GSH; 32 V, GSSG; 25 V, NAC) and 80 V of declustering potential. Source temperature was 450 °C and spray voltage was set to 5500 V. The chromatographic method was developed in a Nexera UPLC system (Shimadzu; Kyoto) using a Kinetex C18 analytical column (100 mm x 2.10 mm, 2.6 µm) (Phenomenex; Torrance, CA) eluted with a mobile phase of 0.75 mM ammonium formate/0.01% formic acid (A) and methanol (B) at 0.2 mL/min. Elution gradient started with 1% B for 5 min and then was increased to 80% B from 5 to 6 min. It was maintained for 4 min and returned to 1% B from 10 to 11 min. Column was equilibrated from 11 to 20 min. Column temperature was set at 25 °C and injection volume was 10 µL. Total peak area of GSH and GSSG was corrected by the internal standard and plotted against a standard curve to obtain absolute concentrations.
2.11. Statistical analysis
The results are presented as mean ± S.E.M of at least three independent experiments. The data were analyzed by one-way analysis of variance (ANOVA) followed by Newman-Keuls Multiple Range when appropriate. P values less than 0.05 (p < 0.05) were considered to be indicative of significance.
3. Results
3.1. Uric acid prevents bacterial clearance and inhibits IL-1β and TNF-α release by dHL-60 cell
We evaluated bacterial clearance by counting the number of colony-forming units (CFU) after incubation with dHL-60 cells at a MOI = 10. Incubation of PA14 with dHL-60 cells for one, two and three hours significantly decreased bacterial CFU number. Interestingly, treatment with uric acid significantly prevented dHL-60 bacterial clearance (Fig. 1A). Uric acid also significantly decreased the production of IL-1β (Fig. 1B) and TNF-α (Fig. 1C) induced by PA14 after 3 h. The decrease in killing activity and cytokines production was not due to a cytotoxic effect of uric acid upon dHL-60 cells because no increase in prodigium iodide (PI) staining (Fig. 2A) or LDH release (Fig. 2B) was caused by uric acid. As expected, PA14 alone had a cytotoxic effect upon dHL-60 cells after 3 h of incubation. No release of LDH was detected in absence of PA14, even at high concentrations of uric acid (Fig. 2B). Incubation of PA14 with uric acid had no effect on bacterial growth (Supplem. Fig. S1).
Fig. 1.

Uric acid affects bacterial clearance (A), IL-1β (B) and TNF-α (C) release by dHL-60 cells. dHL-60 cells (2 × 10⁶) were challenged with PA14 (MOI 1:10) for 1, 2 and 3 h at 37 °C. After each time point serial dilutions were spread on agar plates and the colony-forming units (CFU) were determined after overnight incubation at 37 °C (A). The quantification of IL-1β (B) and TNF-α (C) in the supernatants was performed by enzyme-linked immunosorbent assay (ELISA) 3 h after challenging with PA14. Each bar represents mean ± SEM of three independent experiments. Statistical analyses were performed by one-way ANOVA followed by Newman-Keuls post hoc test; *p < 0.05 compared with no dHL-60 group in (A) or with no PA14 group in (B) and (C); #p < 0.05 compared with dHL-60 + PA14 no uric acid group. UA, uric acid.
Fig. 2.

Uric acid does not affect dHL-60 cell viability. (A) dHL-60 cells were incubated with PA14 (MOI 1:10) for one or two hours at 37 °C. Dead cells were stained with PI and the fluorescence (λex = 535 nm, λem = 620 nm) was measured by flow cytometry. Staurosporine (St) was used as a positive control. (B) Cytotoxicity was measured by lactate dehydrogenase (LDH) activity in supernatants of dHL-60 incubated or not with PA14 (MOI 1:10) and uric acid (UA) for 3 h at 37 °C. LDH activity is presented as the percentage relative to the positive control (dHL-60 in presence of lysis buffer). Each bar represents the mean ± SEM of three independent experiments. Statistical analyses were performed by one-way analyses of Variance (ANOVA) followed by Newman-Keuls; *p < 0.05 from control group.
3.2. Uric acid disrupts hypochlorous acid production
Because uric acid can either compete with chloride by myeloperoxidase catalysis [15] or directly react with HOCl [17], the inhibition of bacterial clearance could be related to a decrease in the HOCl availability. Thus, we quantified HOCl in dHL-60 challenged with PA14 in absence or presence of uric acid. Incubation of dHL-60 with PA14 did not induce a significant production of HOCl, as detected by taurine-chloramine TNB assay (Fig. 3A). The TNB assay is a good tool to assess absolute values of HOCl, but it is limited to HOCl or chloroamines that diffuse to the extracellular space and does not assess HOCl intracellular content. As an alternative, we settled a cell-free myeloperoxidase/Cl-/H2O2 system to evaluate the effect of uric acid on HOCl production and bacterial clearance. In this system, the production of HOCl by was dose-dependent and significantly inhibited by uric acid (Fig. 3B).
Fig. 3.

Uric acid decreases the production of hypochlorous acid (HOCl) by the myeloperoxidase/Cl-/H2O2system. (A) dHL-60 cells (5 × 10⁶) were incubated with PA14 (MOI 1:10) and uric acid for one hour at 37 °C. (B) Myeloperoxidase (100 nM), NaCl (150 mM), taurine (5 mM) and H2O2 (100 µM) were incubated in minimum medium in the absence or presence of uric acid for 30 min at room temperature. Reaction was stopped by incubating with 50 µg/mL catalase. HOCl was indirectly quantified through the oxidation of TNB (ε412 nm = 14,200 M−1cm−1) to the colorless DTNB by taurine-chloroamine. Each bar represents mean ± SEM of three independent experiments. Statistical analyses were performed by one-way ANOVA followed by Newman-Keuls posthoc test; *p < 0.05 compared to control group (no uric acid, UA).
The myeloperoxidase/Cl-/H2O2 system was allowed to react for 30 min and then added to PA14 cells. After 2 h of incubation, no viable bacteria were detected, showing the bactericidal effect of the system. The simultaneous incubation with uric acid significantly prevented the bactericidal effect of the myeloperoxidase/Cl-/H2O2 system (Table 1). This result demonstrates that the decrease in HOCl by uric acid, either by inhibiting its formation or by directly scavenging it, contributes to bacteria survival. To evaluate the solely contribution of the scavenger effect of uric acid upon HOCl in bacterial survival, we allowed the formation of HOCl by myeloperoxidase/Cl-/H2O2 system for 30 min, then, uric acid was incubated within the system and reacted for 0, 10, or 30 min before adding the bacteria. The total amount of HOCl was: 102.5 ± 2.5; 101.5 ± 3.7; 62.5 ± 2.5; 21.2 ± 3.7 μM for the samples in the absence of uric acid or in the presence of 0.5 mM uric acid reacting for 0 (zero), 10 and 30 min, respectively. In spite of the decrease in HOCl after 10 and 30 min of incubation with uric acid, only a mild protective effect was evidenced. The total CFU in the minimum medium (control); myeloperoxidase/Cl-/H2O2; myeloperoxidase/Cl-/H2O2 + UA 0 min; myeloperoxidase/Cl-/H2O2 + UA 10 min and myeloperoxidase/Cl-/H2O2 + UA 30 min were, respectively, 3.1 ± 0.4 × 10⁵/mL, 0 (zero), 0 (zero), 0 (zero) and 1.8 ± 0.9 × 10²/mL. This shows that the protective effect of uric acid occurs rather by a competition for myeloperoxidase and inhibition of HOCl formation than by a direct neutralization of HOCl. It is possible that the products of reaction between HOCl and uric acid still have some bactericidal effect. However, further studies are needed to address this hypothesis.
Table 1.
Uric acid inhibits the bactericidal effect of the myeloperoxidase/H2O2/Cl- system.
| Treatment | CFU/mL × 105 |
|---|---|
| Growth minimum medium | 60.0 ± 12.0 |
| H2O2 | 49.0 ± 3.0 |
| MPO/Cl-/H2O2 | 0* |
| MPO/Cl-/H2O2/UA | 28.5 ± 4.5# |
Myeloperoxidase (MPO, 100 nM), NaCl (150 mM), H2O2 (100 μM) were incubated or not with uric acid (UA, 0.5 mM) in minimum medium for 30 min. Catalase (50 µg/mL) was added to remove H2O2 and stop the reaction. PA14 (1 × 10⁶/mL) was incubated with this system for 2 h and colony-forming units (CFU) were counted after overnight growth. Results represent the mean ± SEM of three independent experiments. Statistical analyses were performed by one-way ANOVA followed by Newman-Keuls post-hoc test; *p < 0.05 compared with minimum media and #p < 0.05 compared with MPO/Cl-/H2O2.
Because TNB oxidation is limited to HOCl diffusion to the extracellular milieu, we estimated the relative concentration of intracellular HOCl with the HOCl-high selective membrane permeable fluorescent probe R19-S. Incubation of dHL-60 cells with PA14 induced the appearance of green fluorescence foci, probably originated into the phagosome. Uric acid or the myeloperoxidase inhibitor, ABAH, decreased the number and the fluorescence intensity of foci (Figs. 4A and B). Differently from dHL-60 cells challenged with PA14, activation with PMA induced a diffuse and much more intense fluorescence (Supplem Fig. S2). The oxidative burst induced by PMA initiates in the plasma membrane and is not restricted to the phagosome, as in bacterial engulfment. Therefore, a diffuse rather than a localized fluorescence is expected [44]. In spite of that, uric acid also greatly decreased R19-S fluorescence in these cells.
Fig. 4.

Uric acid inhibits the production of HOCl in dHL-60 challenged with PA14. (A) dHL-60 (5 × 10⁶) were incubated or not with 0.5 mM uric acid or 0.05 mM 4-aminobenzoic acid hydrazide (ABAH) and challenged with PA14 (MOI 1:10) for 1 h at 37 °C in the presence of R19-S (10 µM). Production of HOCl into the phagosome was visualized by confocal microscopy (λex = 515 nm, λem = 545 nm). Cell nuclei were stained with 4',6-diamidino-2-phenylindole (DAPI). Scale bar 5 µm. (B) Mean of fluorescence intensity of five different fields in a 16-bit image confocal microscopy. Graph represents the mean ± SEM of three independent experiments. Statistical analyses were performed by one-way ANOVA followed by Bonferroni's test; *p < 0.05; compared to control (PA14) group. UA, uric acid; A.U., arbitrary units.
3.3. Uric acid increases superoxide production in dHL-60 cells
The overall production of oxidants by dHL-60 cells was evaluated by a non-specific rhodamine derivative fluorescent probe, DHR. Fig. 5A shows that incubation with PA14 induced a significant increase in the production of oxidants and that uric acid significantly prevented this oxidation. Although DHR is less specific for HOCl than the R19-S, our in vitro assay revealed that DHR was fifty and ten-fold more sensitive to HOCl and to H2O2-horseradish peroxidase, respectively, than to urate hydroperoxide (data not shown).
Fig. 5.

Uric acid increases superoxide production. (A) dHL-60 (1 × 10⁶ cells) were incubated with 5 µM DHR, uric acid (0.2 or 0.5 mM) and PA14 (MOI 1:10) for 1 h. Oxidation of DHR was measured by fluorescence in a 96-well plate reader (λex = 500 nm, λem = 536 nm). (B) Kinetics of superoxide production in dHL-60 cells incubated with PA14 (MOI 1:10), uric acid (0.5 mM), DPI (20 μM) and DHE (10 μM) at 37 °C. Superoxide production was measured by 2-OH-E+ fluorescence (λex = 396 nm, λem = 579 nm). (C) Area under the curve (AUC) of total fluorescence up to 240 min. Each bar represents the mean ± SEM of three experiments. Statistical analyses were performed by one-way analyses of VARIANCE (ANOVA) followed by Newman-Keuls; *p < 0.05 and **p < 0.001 from control group (No PA14 in A or PA14 in C) and #p < 0.05 from PA14 + 0.5 mM UA. DPI: diphenyleneiodonium, UA: uric acid, A.U., arbitrary units.
If in one hand uric acid prevents HOCl formation and plays an antioxidant role, on the other hand its oxidation by myeloperoxidase and formation of urate free radical and urate hydroperoxide could favor a pro-oxidation environment. This is particularly relevant in inflammatory cells because they express large amounts of myeloperoxidase and NADPH oxidase. In addition, uric acid has been described to stimulate NADPH oxidase and increase superoxide production in adipocytes [34] and leucocytes [49]. In our experiments, uric acid significantly increased the production of superoxide by dHL-60 challenged with PA14 (Fig. 5B and C). However, a significant effect occurred only at 0.5 mM uric acid (Fig. 5C). Superoxide production was significantly prevented by the flavin adenine dinucleotide (FAD) poison DPI [50], [51]. This result confirms a paradoxical effect of uric acid, whereas it exerts an antioxidant action by decreasing HOCl production, it also acts as a pro-oxidant by increasing superoxide production.
Therefore, the next step was to evaluate the overall redox state of dHL-60 in presence and absence of uric acid by measuring the levels of reduced (GSH) and oxidized (GSSG) glutathione. Uric acid by itself does not affect baseline levels of GSH and GSSG (Fig. 6). The challenge of dHL-60 with PA14 increased both GSH and GSSG levels and incubation with uric acid had no effect on them (Fig. 6). This result demonstrated that the net oxidative status is not affected by uric acid. Therefore, the antioxidant effect of uric acid by neutralizing HOCl is likely counterbalanced by the production of other oxidants: uric acid free radical, urate hydroperoxide and superoxide.
Fig. 6.
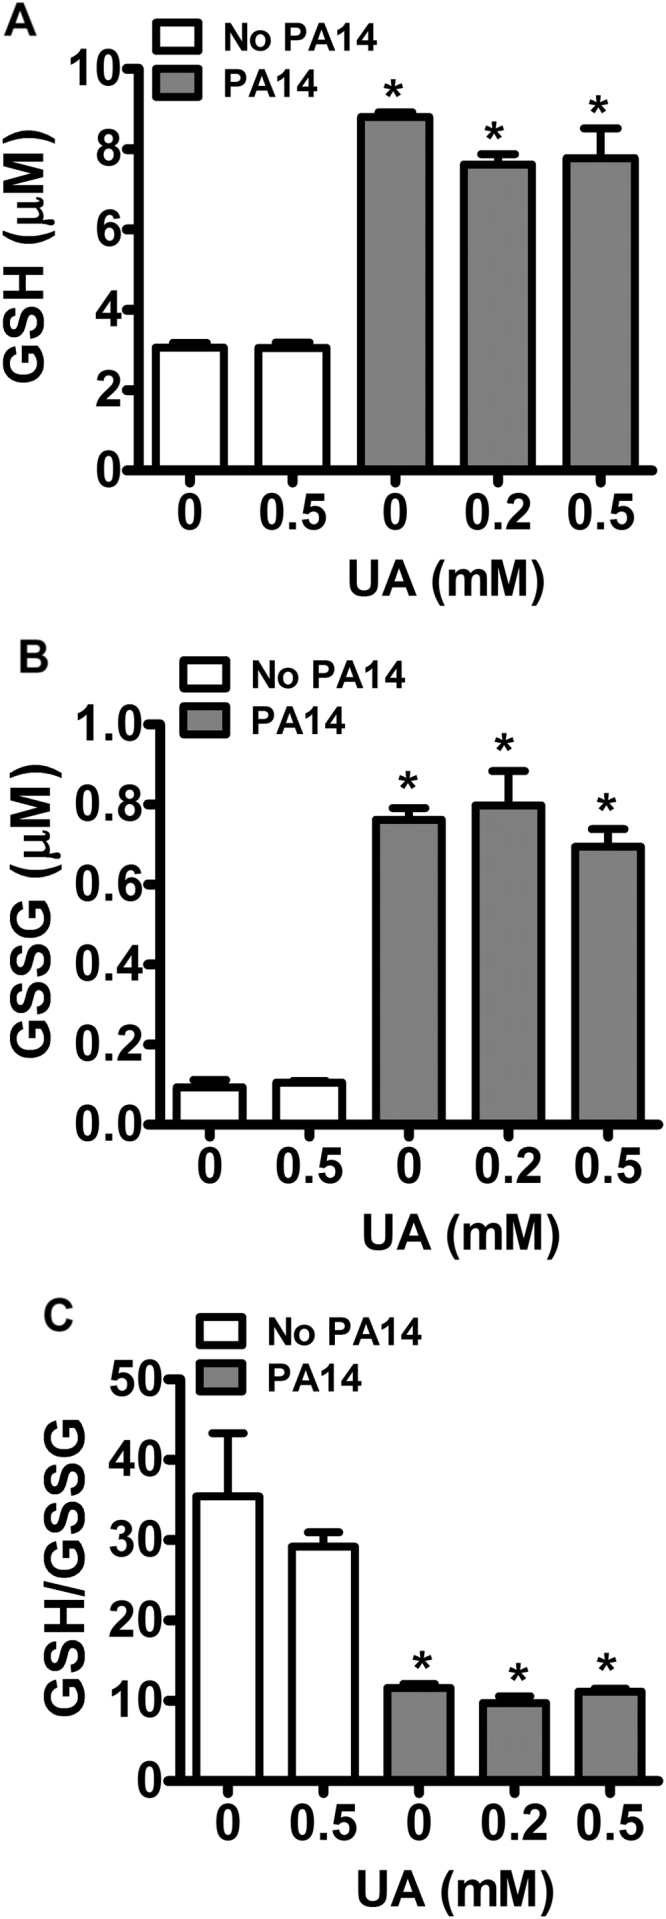
Effect of uric acid on GSH and GSSG levels. dHL-60 cells (5 × 10⁶) were incubated with uric acid (UA, 0.2 or 0.5 mM) and challenged with PA14 (MOI 1:10). Samples were injected onto LC/MS/MS and the mass transitions (m/z 308.0911 → 179.0462) and (m/z 613.1592 → 355.0741) for GSH and GSSG, respectively, were monitored. Each bar represents the mean ± SEM of three independent experiments. Statistical analysis were performed by one-way ANOVA analysis of VARIANCE, followed by Newman-Keuls post-hoc test, *p < 0.05 compared to control without PA14.
4. Discussion
Uric acid is a facile electron donor and is rapidly oxidized by myeloperoxidase and lactoperoxidase to form the single and two electron- oxidants urate free radical and urate hydroperoxide [15], [29]. Because both enzymes are important mediators of the innate immune response, we hypothesized that oxidation of uric acid could contribute against bacterial infection. In addition, soluble uric acid, at the concentration found in human plasma, can activate formation of neutrophil extracellular traps [38], increase production of superoxide [34], [49], activate release of cytokines and recruit inflammatory cells to the site of inflammation [32], [33], [35], [52]. All these events could contribute to a bactericidal adjuvant effect of uric acid. Unexpectedly, incubation of dHL-60 with uric acid significantly inhibited the bactericidal properties of these cells when challenged with PA14 (Fig. 1A). This inhibition was not due to a decrease in dHL-60 viability by uric acid. Differentiated HL-60 cells underwent significant lysis only three hours after incubation with PA14 and uric acid did not potentialize it (Fig. 2). In accordance, previous results show that PA14 did not induce cytotoxicity to murine macrophages at the first and second hour of treatment [53], [54].
The decrease in dHL-60 bactericidal activity by uric acid was likely related to the decrease in HOCl availability. HOCl is the strongest microbicide produced by neutrophils [2], [7], [9]. It is much more reactive and less diffusible than hydrogen peroxide and, therefore, a proper killing agent inside the phagosome [55]. In agreement to this, inhibition of chloride transport and HOCl production decreased the bactericidal property of neutrophils against P. aeruginosa (PA01) [8].
Uric acid has also been described by disrupting the formation of hypothiocyanite by lactoperoxidase and the killing activity of the lactoperoxidase/H2O2/thiocyanate system against Pseudomonas aeruginosa [29]. As for lactoperoxidase, uric acid is a substrate for myeloperoxidase-Compound I and Compound II and competes with chloride for the enzyme (Fig. 7) [15]. Comparing the rate constants of the reaction of myeloperoxidase-Compound I with uric acid, k = 4.6 × 10⁵ M−1 s−1, or chloride k = 2.5 × 10⁴ M−1 s−1 [11], [15] it is likely that, at physiological concentrations of both compounds: uric acid 0.2–0.5 mM and chloride 140 mM, chloride will be the main substrate for the enzyme. Nevertheless, when we incubated myeloperoxidase with physiological concentrations of both competing substrates, we still found a significant decrease in HOCl production despite the large excess of chloride over uric acid (Table 1). In fact, the large Michaellis-Menten constant for myeloperoxidase and chloride reaction, KM = 175 mM [12], might limit the oxidation of this substrate in neutral pH 7.4. A much lower KM has been estimated for uric acid reacting with myeloperoxidase (KM = 74 μM) (estimation based on data from [15]) or lactoperoxidase (KM = 100 μM) [29] in the same conditions.
Fig. 7.

Uric acid decreases HOCl levels in the phagosome. Uric acid (UA) competes with chloride by the myeloperoxidase-Compound I (+•PorFeIV=O). Uric acid also donates one electron to myeloperoxidase-Compound II (PorFeIV=O), completing the peroxidase cycle of the enzyme (PorFeIII). This competition and the direct reaction of uric acid with hypochlorous acid (HOCl) are likely the main mechanisms responsible by the decrease in HOCl levels. Uric acid has been described by indirectly activate NADPH oxidase (Nox) and increase superoxide (O2•-) production. Superoxide can react with uric acid free radical (UA•) to form urate hydroperoxide. Superoxide is also a substrate for myeloperoxidase to generate Compound III (PorFeIV∙O2) and yet can dismutate to generate the hydrogen peroxide substrate. The rate constants for some reactions are presented.
Besides competing for the catalytic activity of myeloperoxidase, uric acid can also directly scavenge HOCl. The estimate rate constant for this reaction at pH 7.0 is 3 × 10⁵ M−1 s−1 [17], [18], [56]. Therefore, uric acid can either scavenge HOCl or compete for myeloperoxidase-Compound I, disrupting HOCl production (Fig. 7). However, the bactericidal effect of the myeloperoxidase/Cl-/H2O2 cell-free system was more profoundly impaired when uric acid was added at the beginning of the reaction, i.e., during HOCl production rather than when HOCl was already formed. This suggests that the products of the reaction of HOCl and uric acid may still have some bactericidal effect. However, further studies are needed to confirm this hypothesis.
The paradoxical effect of uric acid in redox biology is supported by its antioxidant effect in vitro, including the decrease in HOCl levels [17], [18], the scavenger action upon hydroxyl radical, singlet oxygen and protein free radicals [16], [19], [20], [59]. In contrast, uric acid can act as a pro-oxidant by propagating free-radical chain reactions [21], [23]. One-electron oxidation of uric acid by heme-peroxidases produces urate free radical and urate hydroperoxide [15], [29], both intermediates can oxidize glutathione, methionine and thiol in proteins, promoting a pro-oxidative redox imbalance [25], [26]. In addition, soluble uric acid can increase oxidative status by inducing NAPDH oxidase membrane assemblage and, consequently, superoxide production [34], [35], [49] and also by increasing reactive oxygen species in mitochondria [52]. In our hands, uric acid increased even further the superoxide production triggered by bacteria engulfment (Fig. 5B and C). The NADPH oxidase is likely the main source of superoxide during phagocytosis. However, further studies are necessary to address what is the main source of superoxide production affected by uric acid.
The increase in superoxide levels could affect myeloperoxidase catalytic activity because superoxide can directly react with the enzyme or can provide the hydrogen peroxide substrate. Superoxide reacts with different myeloperoxidase intermediates [60] and the most relevant reactions in the phagosome have been tested experimentally [61] and by simulation [6]. In the phagosome, the reaction of superoxide with native myeloperoxidase to form myeloperoxidase-compound III accounts for 93% of total myeloperoxidase. The 7% remaining of the native myeloperoxidase is responsible to keep up the rate of HOCl production at nearly maximum [6]. This same simulation proved that a two-fold increase in superoxide slightly decreases HOCl production [6]. Therefore, the 1.5-fold increase in superoxide caused by uric acid in our experiments (Fig. 5C) probably did not significantly affect myeloperoxidase catalytic activity in the phagosome. This reinforces that the main decrease in the levels HOCl is likely due to the competition between chloride and uric acid by myeloperoxidase-compound I (Fig. 7).
Uric acid did not change the GSH/GSSG ratio (Fig. 6C), showing that any antioxidant effect that could result from HOCl disruption might be counterbalanced by the production of oxidants like uric acid free radical, urate hydroperoxide and superoxide. It is noteworthy to mention that the levels of both GSH and GSSG were greatly increased in dHL-60 challenged with PA14. It might reflect de novo synthesis of glutathione since toxins produced by PA14 can up-regulate genes related to oxidative stress [62]. A similar increase in total glutathione was found in macrophages and polymorphonuclear incubated with lipopolysaccharide or Burkholderia pseudomallei [63], [64].
A shift in the redox balance can modulate cytokines synthesis, release and their intracellular response [64], [65], [66], [67], [68]. In our study, uric acid caused a slight decrease in IL-1β but largely decreased TNF-α level (Fig. 1B and C). An alteration in the redox state could modulate the transcriptional activity of NF-κB, altering the synthesis of IL-1β and TNF-α [69], [70]. Whereas some studies have shown induction of NF-κB by HOCl and inhibition by antioxidants [71], [72], [73], [74], other studies revealed that a reductive environment is crucial to NF-κB activation [68], [75]. Certainly, the modulation of NF-κB is not identical among different cells [70]. In addition, beside phosphorylation, the full transcriptional activity of NF-κB depends on thioredoxin reduction of disulfide bonds in NF-κB p50 subunit that migrates to the nucleus [68], [75], [76], [77]. Therefore, an increase in the oxidative state caused by uric acid could modulate the transcriptional activity of NF-κB and synthesis of TNF-α. However, alterations on redox balance may not be the solely mechanism for modulation of cytokines synthesis and release by uric acid.
Oxidation of uric acid was positively correlated with bronchiectasis and with myeloperoxidase, neutrophil elastase, methionine sulfoxide, glutathione sulfonamide, chlorotyrosine and inflammatory cytokines levels in bronchoalveolar lavage of children suffering of pulmonary infection by P. aeruginosa. This clinical study strengthened the link between uric acid oxidation and worst outcome in patients with P. aeruginosa infection and suggests the investigation of oxidized glutathione and uric acid as biomarkers of early cystic fibrosis lung disease [39]. A correlation between plasma uric acid levels and worst outcomes has also been found in sepsis [78], [79], [80], [81]. However, in some cases it was not possible to identify the independent contribution of uric acid because some patients also presented kidney injury [81].
In conclusion, this study shows that uric acid decreased the levels of HOCl without providing a reductive environment in dHL-60. The decrease in HOCl was likely the main cause of inhibition of the microbicide activity in these cells, showing the crucial role of HOCl in bacterial killing in an isolated cell system. Uric acid also prevented the release of cytokines and this may contribute to inhibition of autocrine stimulation and bacterial killing. The inhibition of microbicidal activity by uric acid opens the question whether uric acid can contribute to the pathogenesis of infection and supports the clinical findings that correlate the increase of plasma uric acid with sepsis severity.
Acknowledgments
The authors thank Adriano Britto for technical support on quantification of glutathione by MS/MS and Lucia R. Lopes for discussion on superoxide experiments.
Acknowledgments
Funding sources
This study was supported by Fundação de Amparo a Pesquisa do Estado de São Paulo (FAPESP): CEPID Redoxoma 2013/07937-8; Young Investigator 2011/18106-4 and Conselho Nacional de Pesquisa Tecnológica (CNPq) 472105/2012-4. L.A.C.C., J.P.P.B., G.H.K and R.P.S receive scholarship support from FAPESP.
Footnotes
Supplementary data associated with this article can be found in the online version at doi:10.1016/j.redox.2018.02.020.
Appendix A. Supplementary material
Supplementary material
References
- 1.Hurst J.K. What really happens in the neutrophil phagosome? Free Radic. Biol. Med. 2012;53:508–520. doi: 10.1016/j.freeradbiomed.2012.05.008. [DOI] [PMC free article] [PubMed] [Google Scholar]
- 2.Winterbourn C.C., Kettle A.J. Redox reactions and microbial killing in the neutrophil phagosome. Antioxid. Redox Signal. 2013;18:642–660. doi: 10.1089/ars.2012.4827. [DOI] [PubMed] [Google Scholar]
- 3.Winterbourn C.C., Kettle A.J., Hampton M.B. Reactive oxygen species and neutrophil function. Annu. Rev. Biochem. 2016;85:765–792. doi: 10.1146/annurev-biochem-060815-014442. [DOI] [PubMed] [Google Scholar]
- 4.Ginsburg I., Kohen R. Cell damage in inflammatory and infectious sites might involve a coordinated "cross-talk" among oxidants, microbial haemolysins and ampiphiles, cationic proteins, phospholipases, fatty acids, proteinases and cytokines (an overview) Free Radic. Res. 1995;22:489–517. doi: 10.3109/10715769509150323. [DOI] [PubMed] [Google Scholar]
- 5.Babior B.M., Kipnes R.S., Curnutte J.T. Biological defense mechanisms. The production by leukocytes of superoxide, a potential bactericidal agent. J. Clin. Investig. 1973;52:741–744. doi: 10.1172/JCI107236. [DOI] [PMC free article] [PubMed] [Google Scholar]
- 6.Winterbourn C.C., Hampton M.B., Livesey J.H., Kettle A.J. Modeling the reactions of superoxide and myeloperoxidase in the neutrophil phagosome: implications for microbial killing. J. Biol. Chem. 2006;281:39860–39869. doi: 10.1074/jbc.M605898200. [DOI] [PubMed] [Google Scholar]
- 7.Klebanoff S A peroxidase-mediated antimicrobial system in leucocytes. J. Clin. Investig. 1967;46:1078. [Google Scholar]
- 8.Painter R.G., Bonvillain R.W., Valentine V.G., Lombard G.A., LaPlace S.G., Nauseef W.M., Wang G. The role of chloride anion and CFTR in killing of Pseudomonas aeruginosa by normal and CF neutrophils. J. Leukoc. Biol. 2008;83:1345–1353. doi: 10.1189/jlb.0907658. [DOI] [PMC free article] [PubMed] [Google Scholar]
- 9.Klebanoff S.J., Kettle A.J., Rosen H., Winterbourn C.C., Nauseef W.M. Myeloperoxidase: a front-line defender against phagocytosed microorganisms. J. Leukoc. Biol. 2013;93:185–198. doi: 10.1189/jlb.0712349. [DOI] [PMC free article] [PubMed] [Google Scholar]
- 10.Gaut J.P., Yeh G.C., Tran H.D., Byun J., Henderson J.P., Richter G.M., Brennan M.L., Lusis A.J., Belaaouaj A., Hotchkiss R.S. Neutrophils employ the myeloperoxidase system to generate antimicrobial brominating and chlorinating oxidants during sepsis. Proc. Natl. Acad. Sci. USA. 2001;98:11961–11966. doi: 10.1073/pnas.211190298. [DOI] [PMC free article] [PubMed] [Google Scholar]
- 11.Furtmuller P.G., Burner U., Obinger C. Reaction of myeloperoxidase compound I with chloride, bromide, iodide, and thiocyanate. Biochemistry. 1998;37:17923–17930. doi: 10.1021/bi9818772. [DOI] [PubMed] [Google Scholar]
- 12.van Dalen C.J., Whitehouse M.W., Winterbourn C.C., Kettle A.J. Thiocyanate and chloride as competing substrates for myeloperoxidase. Biochem. J. 1997;327(Pt 2):487–492. doi: 10.1042/bj3270487. [DOI] [PMC free article] [PubMed] [Google Scholar]
- 13.Chapman A.L., Skaff O., Senthilmohan R., Kettle A.J., Davies M.J. Hypobromous acid and bromamine production by neutrophils and modulation by superoxide. Biochem. J. 2009;417:773–781. doi: 10.1042/BJ20071563. [DOI] [PubMed] [Google Scholar]
- 14.Johnson R.J., Rideout B.A. Uric acid and diet--insights into the epidemic of cardiovascular disease. N. Engl. J. Med. 2004;350:1071–1073. doi: 10.1056/NEJMp048015. [DOI] [PubMed] [Google Scholar]
- 15.Meotti F.C., Jameson G.N., Turner R., Harwood D.T., Stockwell S., Rees M.D., Thomas S.R., Kettle A.J. Urate as a physiological substrate for myeloperoxidase: implications for hyperuricemia and inflammation. J. Biol. Chem. 2011;286:12901–12911. doi: 10.1074/jbc.M110.172460. [DOI] [PMC free article] [PubMed] [Google Scholar]
- 16.Simic M.G., Jovanovic S.V. Antioxidation mechanisms of uric-acid. J. Am. Chem. Soc. 1989;111:5778–5782. [Google Scholar]
- 17.Winterbourn C.C. Comparative reactivities of various biological compounds with myeloperoxidase-hydrogen peroxide-chloride, and similarity of the oxidant to hypochlorite. Biochim. Biophys. Acta. 1985;840:204–210. doi: 10.1016/0304-4165(85)90120-5. [DOI] [PubMed] [Google Scholar]
- 18.Squadrito G.L., Postlethwait E.M., Matalon S. Elucidating mechanisms of chlorine toxicity: reaction kinetics, thermodynamics, and physiological implications. Am. J. Physiol. Lung Cell. Mol. Physiol. 2010;299:L289–L300. doi: 10.1152/ajplung.00077.2010. [DOI] [PMC free article] [PubMed] [Google Scholar]
- 19.Ames B.N., Cathcart R., Schwiers E., Hochstein P. Uric acid provides an antioxidant defense in humans against oxidant- and radical-caused aging and cancer: a hypothesis. Proc. Natl. Acad. Sci. USA. 1981;78:6858–6862. doi: 10.1073/pnas.78.11.6858. [DOI] [PMC free article] [PubMed] [Google Scholar]
- 20.Domazou A.S., Zhu H., Koppenol W.H. Fast repair of protein radicals by urate. Free Radic. Biol. Med. 2012;52:1929–1936. doi: 10.1016/j.freeradbiomed.2012.02.045. [DOI] [PubMed] [Google Scholar]
- 21.Santos C.X., Anjos E.I., Augusto O. Uric acid oxidation by peroxynitrite: multiple reactions, free radical formation, and amplification of lipid oxidation. Arch. Biochem. Biophys. 1999;372:285–294. doi: 10.1006/abbi.1999.1491. [DOI] [PubMed] [Google Scholar]
- 22.Aruoma O.I., Halliwell B. Inactivation of alpha 1-antiproteinase by hydroxyl radicals. The effect of uric acid. FEBS Lett. 1989;244:76–80. doi: 10.1016/0014-5793(89)81166-4. [DOI] [PubMed] [Google Scholar]
- 23.Filipe P., Haigle J., Freitas J., Fernandes A., Maziere J.C., Maziere C., Santus R., Morliere P. Anti- and pro-oxidant effects of urate in copper-induced low-density lipoprotein oxidation. Eur. J. Biochem. 2002;269:5474–5483. doi: 10.1046/j.1432-1033.2002.03245.x. [DOI] [PubMed] [Google Scholar]
- 24.Kittridge K.J., Willson R.L. Uric-acid substantially enhances the free radical-induced inactivation of alcohol-dehydrogenase. FEBS Lett. 1984;170:162–164. doi: 10.1016/0014-5793(84)81391-5. [DOI] [PubMed] [Google Scholar]
- 25.Patricio E.S., Prado F.M., da Silva R.P., Carvalho L.A., Prates M.V., Dadamos T., Bertotti M., Di Mascio P., Kettle A.J., Meotti F.C. Chemical characterization of urate hydroperoxide, a pro-oxidant intermediate generated by urate oxidation in inflammatory and photoinduced processes. Chem. Res. Toxicol. 2015;28:1556–1566. doi: 10.1021/acs.chemrestox.5b00132. [DOI] [PubMed] [Google Scholar]
- 26.Carvalho L.A.C., Truzzi D.R., Fallani T.S., Alves S.V., Toledo J.C., Jr., Augusto O., Netto L.E.S., Meotti F.C. Urate hydroperoxide oxidizes human peroxiredoxin 1 and peroxiredoxin 2. J. Biol. Chem. 2017;292:8705–8715. doi: 10.1074/jbc.M116.767657. [DOI] [PMC free article] [PubMed] [Google Scholar]
- 27.Sautin Y.Y., Johnson R.J. Uric acid: the oxidant-antioxidant paradox. Nucleosides Nucleotides Nucleic Acids. 2008;27:608–619. doi: 10.1080/15257770802138558. [DOI] [PMC free article] [PubMed] [Google Scholar]
- 28.Santus R., Patterson L.K., Filipe P., Morliere P., Hug G.L., Fernandes A., Maziere J.C. Redox reactions of the urate radical/urate couple with the superoxide radical anion, the tryptophan neutral radical and selected flavonoids in neutral aqueous solutions. Free Radic. Res. 2001;35:129–136. doi: 10.1080/10715760100300671. [DOI] [PubMed] [Google Scholar]
- 29.Seidel A., Parker H., Turner R., Dickerhof N., Khalilova I.S., Wilbanks S.M., Kettle A.J., Jameson G.N. Uric acid and thiocyanate as competing substrates of lactoperoxidase. J. Biol. Chem. 2014;289:21937–21949. doi: 10.1074/jbc.M113.544957. [DOI] [PMC free article] [PubMed] [Google Scholar]
- 30.Martinon F., Petrilli V., Mayor A., Tardivel A., Tschopp J. Gout-associated uric acid crystals activate the NALP3 inflammasome. Nature. 2006;440:237–241. doi: 10.1038/nature04516. [DOI] [PubMed] [Google Scholar]
- 31.Martinon F. Mechanisms of uric acid crystal-mediated autoinflammation. Immunol. Rev. 2010;233:218–232. doi: 10.1111/j.0105-2896.2009.00860.x. [DOI] [PubMed] [Google Scholar]
- 32.Shi Y. Caught red-handed: uric acid is an agent of inflammation. J. Clin. Investig. 2010;120:1809–1811. doi: 10.1172/JCI43132. [DOI] [PMC free article] [PubMed] [Google Scholar]
- 33.Kono H., Chen C.J., Ontiveros F., Rock K.L. Uric acid promotes an acute inflammatory response to sterile cell death in mice. J. Clin. Investig. 2010;120:1939–1949. doi: 10.1172/JCI40124. [DOI] [PMC free article] [PubMed] [Google Scholar]
- 34.Sautin Y.Y., Nakagawa T., Zharikov S., Johnson R.J. Adverse effects of the classic antioxidant uric acid in adipocytes: NADPH oxidase-mediated oxidative/nitrosative stress. Am. J. Physiol. Cell. Physiol. 2007;293:C584–C596. doi: 10.1152/ajpcell.00600.2006. [DOI] [PubMed] [Google Scholar]
- 35.Baldwin W., McRae S., Marek G., Wymer D., Pannu V., Baylis C., Johnson R.J., Sautin Y.Y. Hyperuricemia as a mediator of the proinflammatory endocrine imbalance in the adipose tissue in a murine model of the metabolic syndrome. Diabetes. 2011;60:1258–1269. doi: 10.2337/db10-0916. [DOI] [PMC free article] [PubMed] [Google Scholar]
- 36.Kanellis J., Watanabe S., Li J.H., Kang D.H., Li P., Nakagawa T., Wamsley A., Sheikh-Hamad D., Lan H.Y., Feng L. Uric acid stimulates monocyte chemoattractant protein-1 production in vascular smooth muscle cells via mitogen-activated protein kinase and cyclooxygenase-2. Hypertension. 2003;41:1287–1293. doi: 10.1161/01.HYP.0000072820.07472.3B. [DOI] [PubMed] [Google Scholar]
- 37.Crisan T.O., Cleophas M.C., Oosting M., Lemmers H., Toenhake-Dijkstra H., Netea M.G., Jansen T.L., Joosten L.A. Soluble uric acid primes TLR-induced proinflammatory cytokine production by human primary cells via inhibition of IL-1Ra. Ann. Rheum. Dis. 2015 doi: 10.1136/annrheumdis-2014-206564. [DOI] [PubMed] [Google Scholar]
- 38.Arai Y., Nishinaka Y., Arai T., Morita M., Mizugishi K., Adachi S., Takaori-Kondo A., Watanabe T., Yamashita K. Uric acid induces NADPH oxidase-independent neutrophil extracellular trap formation. Biochem. Biophys. Res. Commun. 2014;443:556–561. doi: 10.1016/j.bbrc.2013.12.007. [DOI] [PubMed] [Google Scholar]
- 39.Dickerhof N., Turner R., Khalilova I., Fantino E., Sly P.D., Kettle A.J., Arest C.F. Oxidized glutathione and uric acid as biomarkers of early cystic fibrosis lung disease. J. Cyst. Fibros.: Off. J. Eur. Cyst. Fibros. Soc. 2017;16:214–221. doi: 10.1016/j.jcf.2016.10.012. [DOI] [PubMed] [Google Scholar]
- 40.Lyczak J.B., Cannon C.L., Pier G.B. Lung infections associated with cystic fibrosis. Clin. Microbiol. Rev. 2002;15:194–222. doi: 10.1128/CMR.15.2.194-222.2002. [DOI] [PMC free article] [PubMed] [Google Scholar]
- 41.Stapleton F., Carnt N. Contact lens-related microbial keratitis: how have epidemiology and genetics helped us with pathogenesis and prophylaxis. Eye. 2012;26:185–193. doi: 10.1038/eye.2011.288. [DOI] [PMC free article] [PubMed] [Google Scholar]
- 42.Rahme L.G., Stevens E.J., Wolfort S.F., Shao J., Tompkins R.G., Ausubel F.M. Common virulence factors for bacterial pathogenicity in plants and animals. Science. 1995;268:1899–1902. doi: 10.1126/science.7604262. [DOI] [PubMed] [Google Scholar]
- 43.Kettle A.J., Winterbourn C.C. Assays for the chlorination activity of myeloperoxidase. Methods Enzymol. 1994;233:502–512. doi: 10.1016/s0076-6879(94)33056-5. [DOI] [PubMed] [Google Scholar]
- 44.Chen X., Lee K.A., Ha E.M., Lee K.M., Seo Y.Y., Choi H.K., Kim H.N., Kim M.J., Cho C.S., Lee S.Y. A specific and sensitive method for detection of hypochlorous acid for the imaging of microbe-induced HOCl production. Chem. Commun. 2011;47:4373–4375. doi: 10.1039/c1cc10589b. [DOI] [PubMed] [Google Scholar]
- 45.Kettle A.J., Albrett A.M., Chapman A.L., Dickerhof N., Forbes L.V., Khalilova I., Turner R. Measuring chlorine bleach in biology and medicine. Biochim. Biophys. Acta. 1840;2014:781–793. doi: 10.1016/j.bbagen.2013.07.004. [DOI] [PubMed] [Google Scholar]
- 46.Dos Santos A.F., Terra L.F., Wailemann R.A., Oliveira T.C., Gomes V.M., Mineiro M.F., Meotti F.C., Bruni-Cardoso A., Baptista M.S., Labriola L. Methylene blue photodynamic therapy induces selective and massive cell death in human breast cancer cells. BMC Cancer. 2017;17:194. doi: 10.1186/s12885-017-3179-7. [DOI] [PMC free article] [PubMed] [Google Scholar]
- 47.Robinson K.M., Janes M.S., Pehar M., Monette J.S., Ross M.F., Hagen T.M., Murphy M.P., Beckman J.S. Selective fluorescent imaging of superoxide in vivo using ethidium-based probes. Proc. Natl. Acad. Sci. USA. 2006;103:15038–15043. doi: 10.1073/pnas.0601945103. [DOI] [PMC free article] [PubMed] [Google Scholar]
- 48.Carroll D., Howard D., Zhu H., Paumi C.M., Vore M., Bondada S., Liang Y., Wang C., St Clair D.K. Simultaneous quantitation of oxidized and reduced glutathione via LC-MS/MS: an insight into the redox state of hematopoietic stem cells. Free Radic. Biol. Med. 2016;97:85–94. doi: 10.1016/j.freeradbiomed.2016.05.005. [DOI] [PMC free article] [PubMed] [Google Scholar]
- 49.Thomas M.J. Urate causes the human polymorphonuclear leukocyte to secrete superoxide. Free Radic. Biol. Med. 1992;12:89–91. doi: 10.1016/0891-5849(92)90061-k. [DOI] [PubMed] [Google Scholar]
- 50.Altenhofer S., Radermacher K.A., Kleikers P.W., Wingler K., Schmidt H.H. Evolution of NADPH oxidase inhibitors: selectivity and mechanisms for target engagement. Antioxid. Redox Signal. 2015;23:406–427. doi: 10.1089/ars.2013.5814. [DOI] [PMC free article] [PubMed] [Google Scholar]
- 51.Aldieri E., Riganti C., Polimeni M., Gazzano E., Lussiana C., Campia I., Ghigo D. Classical inhibitors of NOX NAD(P)H oxidases are not specific. Curr. Drug Metab. 2008;9:686–696. doi: 10.2174/138920008786049285. [DOI] [PubMed] [Google Scholar]
- 52.Braga T.T., Forni M.F., Correa-Costa M., Ramos R.N., Barbuto J.A., Branco P., Castoldi A., Hiyane M.I., Davanso M.R., Latz E. Soluble uric acid activates the NLRP3 inflammasome. Sci. Rep. 2017;7:39884. doi: 10.1038/srep39884. [DOI] [PMC free article] [PubMed] [Google Scholar]
- 53.Kaihami G.H., Almeida J.R., Santos S.S., Netto L.E., Almeida S.R., Baldini R.L. Involvement of a 1-Cys peroxiredoxin in bacterial virulence. PLoS Pathog. 2014;10:e1004442. doi: 10.1371/journal.ppat.1004442. [DOI] [PMC free article] [PubMed] [Google Scholar]
- 54.Basso P., Wallet P., Elsen S., Soleilhac E., Henry T., Faudry E., Attree I. Multiple Pseudomonas species secrete Exolysin-like toxins and provoke Caspase-1-dependent macrophage death. Environ. Microbiol. 2017 doi: 10.1111/1462-2920.13841. [DOI] [PubMed] [Google Scholar]
- 55.Schurmann N., Forrer P., Casse O., Li J., Felmy B., Burgener A.V., Ehrenfeuchter N., Hardt W.D., Recher M., Hess C. Myeloperoxidase targets oxidative host attacks to Salmonella and prevents collateral tissue damage. Nat. Microbiol. 2017;2:16268. doi: 10.1038/nmicrobiol.2016.268. [DOI] [PubMed] [Google Scholar]
- 56.Pattison D.I., Davies M.J. Reactions of myeloperoxidase-derived oxidants with biological substrates: gaining chemical insight into human inflammatory diseases. Curr. Med. Chem. 2006;13:3271–3290. doi: 10.2174/092986706778773095. [DOI] [PubMed] [Google Scholar]
- 59.Kaur H., Halliwell B. Action of biologically-relevant oxidizing species upon uric-acid - identification of uric-acid oxidation-products. Chem.-Biol. Interact. 1990;73:235–247. doi: 10.1016/0009-2797(90)90006-9. [DOI] [PubMed] [Google Scholar]
- 60.Kettle A.J., Anderson R.F., Hampton M.B., Winterbourn C.C. Reactions of superoxide with myeloperoxidase. Biochemistry. 2007;46:4888–4897. doi: 10.1021/bi602587k. [DOI] [PubMed] [Google Scholar]
- 61.Kettle A.J., Winterbourn C.C. Superoxide modulates the activity of myeloperoxidase and optimizes the production of hypochlorous acid. Biochem. J. 1988;252:529–536. doi: 10.1042/bj2520529. [DOI] [PMC free article] [PubMed] [Google Scholar]
- 62.Rada B., Leto T.L. Pyocyanin effects on respiratory epithelium: relevance in Pseudomonas aeruginosa airway infections. Trends Microbiol. 2013;21:73–81. doi: 10.1016/j.tim.2012.10.004. [DOI] [PMC free article] [PubMed] [Google Scholar]
- 63.Matuschak G.M., Nayak R., Doyle T.M., Lechner A.J. Acute hypoxia decreases E. coli LPS-induced cytokine production and NF-kappa B activation in alveolar macrophages. Resp. Physiol. Neurobiol. 2010;172:63–71. doi: 10.1016/j.resp.2010.05.006. [DOI] [PMC free article] [PubMed] [Google Scholar]
- 64.Kewcharoenwong C., Rinchai D., Nithichanon A., Bancroft G.J., Ato M., Lertmemongkolchai G. Glibenclamide impairs responses of neutrophils against Burkholderia pseudomallei by reduction of intracellular glutathione. Sci. Rep. 2016;6:34794. doi: 10.1038/srep34794. [DOI] [PMC free article] [PubMed] [Google Scholar]
- 65.Salzano S., Checconi P., Hanschmann E.M., Lillig C.H., Bowler L.D., Chan P., Vaudry D., Mengozzi M., Coppo L., Sacre S. Linkage of inflammation and oxidative stress via release of glutathionylated peroxiredoxin-2, which acts as a danger signal. Proc. Natl. Acad. Sci. USA. 2014;111:12157–12162. doi: 10.1073/pnas.1401712111. [DOI] [PMC free article] [PubMed] [Google Scholar]
- 66.He C., Ryan A.J., Murthy S., Carter A.B. Accelerated development of pulmonary fibrosis via Cu, Zn-superoxide dismutase-induced alternative activation of macrophages. J. Biol. Chem. 2013;288:20745–20757. doi: 10.1074/jbc.M112.410720. [DOI] [PMC free article] [PubMed] [Google Scholar]
- 67.Han D., Ybanez M.D., Ahmadi S., Yeh K., Kaplowitz N. Redox regulation of tumor necrosis factor signaling. Antioxid. Redox Signal. 2009;11:2245–2263. doi: 10.1089/ars.2009.2611. [DOI] [PMC free article] [PubMed] [Google Scholar]
- 68.Trevelin S.C., dos Santos C.X., Ferreira R.G., Lima L.D., Silva R.L., Scavone C., Curi R., Alves J.C., Cunha T.M., Roxo P. Apocynin and Nox2 regulate NF-kappa B by modifying thioredoxin-1 redox-state. Sci. Rep. 2016;6 doi: 10.1038/srep34581. [DOI] [PMC free article] [PubMed] [Google Scholar]
- 69.Baeuerle P.A., Henkel T. Function Amd Activation of Nf-Kappa-B in the Immune-System. Annu Rev. Immunol. 1994;12:141–179. doi: 10.1146/annurev.iy.12.040194.001041. [DOI] [PubMed] [Google Scholar]
- 70.Gloire G., Legrand-Poels S., Piette J. NF-kappaB activation by reactive oxygen species: fifteen years later. Biochem. Pharmacol. 2006;72:1493–1505. doi: 10.1016/j.bcp.2006.04.011. [DOI] [PubMed] [Google Scholar]
- 71.Schoonbroodt S., LegrandPoels S., BestBelpomme M., Piette J. Activation of the NF-kappa B transcription factor in a T-lymphocytic cell lime by hypochlorous acid. Biochem. J. 1997;321:777–785. doi: 10.1042/bj3210777. [DOI] [PMC free article] [PubMed] [Google Scholar]
- 72.Sasaki M., Jordan P., Manas K., Grisham M.B., Alexander J.S. TNF-alpha induced MAdCAM-1 expression is P-450 monoxygenase dependent. Faseb J. 2002;16 (A428-A428) [Google Scholar]
- 73.Bhattacharyya S., Dudeja P.K., Tobacman J.K. ROS, Hsp27, and IKK beta Mediate Dextran Sodium Sulfate (DSS) Activation of I kappa Ba, NF kappa B, and IL-8. Inflamm. Bowel Dis. 2009;15:673–683. doi: 10.1002/ibd.20821. [DOI] [PMC free article] [PubMed] [Google Scholar]
- 74.van den Berg R., Haenen G.R.M.M., van den Berg H., Bast A. Transcription factor NF-kappa B as a potential biomarker for oxidative stress. Br. J. Nutr. 2001;86:S121–S127. doi: 10.1079/bjn2001340. [DOI] [PubMed] [Google Scholar]
- 75.Matthews J.R., Wakasugi N., Virelizier J.L., Yodoi J., Hay R.T. Thioredoxin regulates the DNA-binding activity of Nf-Chi-B by reduction of a disulfide bond involving cysteine 62. Nucleic Acids Res. 1992;20:3821–3830. doi: 10.1093/nar/20.15.3821. [DOI] [PMC free article] [PubMed] [Google Scholar]
- 76.Hirota K., Murata M., Sachi Y., Nakamura H., Takeuchi J., Mori K., Yodoi J. Distinct roles of thioredoxin in the cytoplasm and in the nucleus - a two-step mechanism of redox regulation of transcription factor NF-kappa B. J. Biol. Chem. 1999;274:27891–27897. doi: 10.1074/jbc.274.39.27891. [DOI] [PubMed] [Google Scholar]
- 77.Kabe Y., Ando K., Hirao S., Yoshida M., Handa H. Redox regulation of NF-kappa B activation: distinct redox regulation between the cytoplasm and the nucleus. Antioxid. Redox Signal. 2005;7:395–403. doi: 10.1089/ars.2005.7.395. [DOI] [PubMed] [Google Scholar]
- 78.Chuang C.C., Shiesh S.C., Chi C.H., Tu Y.F., Hor L.I., Shieh C.C., Chen M.F. Serum total antioxidant capacity reflects severity of illness in patients with severe sepsis. Crit. Care. 2006;10 doi: 10.1186/cc4826. [DOI] [PMC free article] [PubMed] [Google Scholar]
- 79.Tsai K., Hsu T., Kong C., Lin K., Lu F. Is the endogenous peroxyl-radical scavenging capacity of plasma protective in systemic inflammatory disorders in humans? Free Radic. Biol. Med. 2000;28:926–933. doi: 10.1016/s0891-5849(00)00180-5. [DOI] [PubMed] [Google Scholar]
- 80.MacKinnon K.L., Molnar Z., Lowe D., Watson I.D., Shearer E. Measures of total free radical activity in critically ill patients. Clin. Biochem. 1999;32:263–268. doi: 10.1016/s0009-9120(98)00109-x. [DOI] [PubMed] [Google Scholar]
- 81.Akbar S.R., Long D.M., Hussain K., Alhajhusain A., Ahmed U.S., Iqbal H.I., Ali A.W., Leonard R., Dalton C. Hyperuricemia: an early marker for severity of illness in sepsis. Int. J. Nephrol. 2015;2015:301021. doi: 10.1155/2015/301021. [DOI] [PMC free article] [PubMed] [Google Scholar]
Associated Data
This section collects any data citations, data availability statements, or supplementary materials included in this article.
Supplementary Materials
Supplementary material