 Transition voltages respond to the collective action of dipole moments embedded in self-assembled monolayers.
Abstract
We studied the influence of embedded dipole moments in self-assembled monolayers (SAMs) formed on template stripped Au surfaces with liquid eutectic Ga–In alloy as a top electrode. We designed three molecules based on a p-terphenyl structure in which the central aromatic ring is either phenyl or a dipole-inducing pyrimidyl in one of two different orientations. All three form well defined SAMs with similar thickness, packing density and tilt angle, with dipole moments embedded in the SAM, isolated from either interface. The magnitude of the current density is dominated by the tunneling distance and is not affected by the presence of dipole moments; however, transition voltages (VT) show a clear linear correlation with the shift in the work function of Au induced by the collective action of the embedded dipoles. This observation demonstrates that VT can be manipulated synthetically, without altering either the interfaces or electrodes and that trends in VT can be related to experimental observables on the SAMs before installing the top contact. Calculated projected density of states of the SAMs on Au surfaces that relate HOMO-derived states to VT further show that energy level alignment within an assembled junction can be predicted and adjusted by embedding dipoles in a SAM without altering any other properties of the junction. We therefore suggest that trends in VT can be used analogously to β in systems for which length-dependence is physically or experimentally inaccessible.
1. Introduction
The field of molecular electronics aims to investigate and realize electronic devices with functionality defined by molecular properties. Two main approaches are currently used to contact molecules, which is a key step in the examination of charge transport: single-molecule and large-area (i.e., ensembles) measurements. In both cases the molecules under investigation are placed in between two metal electrodes that are on the order of 2 nm apart (the exact distance is defined by the dimensions of the molecules under investigation). In these systems interfaces play an important role in defining the characteristics of a junction and both approaches suffer from an uncertainty—is transport dominated by molecules or by interfaces?1,2 Electron transport in large-area junctions is affected by defects in self-assembled monolayers (SAMs) that can dominate transport in certain cases,3 while single-molecule junctions exhibit background currents in which tunneling charges flow directly from one electrode to the other, by-passing the molecule in between.4 Thus, the magnitude of J or I (current-density or current) by itself varies considerably and therefore carries little useful information on the intrinsic electronic properties of the molecules in the junction.
One of the most reliable metrics that seeks to resolve these issues is β, which is an empirical parameter derived from a form of the Simmons equation J = J0 e–βd, where J is the current density, d is the tunneling distance defined by the length of the molecular backbone and J0 is the theoretical value of J at d = 0. Values of β are derived from measurements of series of molecules that differ only by length, while both top and bottom interfaces are kept constant, thus isolating the molecular component in charge transport.5,6 This approach to data analysis is particularly robust when comparing saturated molecules (i.e., where the backbone comprises mostly sp3-hybridized C atoms), for which the consensus value of β is ∼0.75 Å–1.6 Saturated molecules have frontier orbitals that are typically not accessible in the typical bias windows used in molecular electronics and they are not very polarizable. With the exception of end groups that introduce accessible gap states7 these properties tend to make saturated molecules less sensitive to the details of the contacts, in general; e.g., tail-groups,8–10 anchoring groups,11,12 and minor alterations to the backbone13 have little impact on the tunneling transport in terms of the magnitudes of I or J. Unsaturation, by contrast, adds significant complexity and even subtle changes in conjugation patterns can have pronounced and non-distance dependent effects on transport.14–18 Tuning the length of fully conjugated molecules is also synthetically challenging and not always possible, since a minimal step size is a π bond (i.e., two carbons) or aromatic ring (usually phenylene) and, unlike alkanes, conjugated molecules become markedly less soluble with increasing length.19 Thus, a parameter other than β, but that is comparably independent from non-molecular variables (e.g., interfaces), could greatly assist in the description of tunneling transport phenomena in conjugated molecules and, importantly, in the deconvolution of molecular properties from those of the experimental platform.
Beebe et al.20 introduced the transition voltage (VT) as an approximate measure of the tunneling barrier height, which was later related to level alignment—i.e., the difference between the energy of the accessible frontier orbital of a molecule and the Fermi level of the electrode (e.g., ELUMO – EF or EF – EHOMO) in an assembled junction. The parameter VT can be extracted from the minimum of a Fowler–Nordheim plot, ln(I/V2) versus 1/V. The possibility of determining the level alignment of a junction by simply re-plotting conductance data has led to a number of experimental21–28 and theoretical studies.29–33
While β provides information about the effective tunneling distance (and barrier height), VT provides information about energy level alignment. Multiple experiments showed a correlation between VT and apparent energetic separation between the Fermi energy level (EF) and the dominant frontier molecular orbital.34,35 However, the precise physical meaning of VT is still under debate; e.g., current becomes “superquadratic” with bias and might not always correlate to energy spectral transition.30,36 Sotthewes et al.,37 studied vacuum gaps in ultra-high vacuum STM junctions and found that transition voltage is inversely proportional to 1/d; i.e., that work showed that VT can even be measured in the absence of molecules.
Summarizing the above considerations, we assert that the interpretation of VT is not straightforward and that VT is highly dependent on interfaces and is a conflation of two effects—interfacial and molecular—underscoring the importance of separating one from the other. This paper describes the control over VT by manipulating a single parameter—embedded dipoles—while keeping the interfaces and electrodes constant, allowing the unambiguous assignment of trends in VT and energy level alignment to an intrinsic molecular property.
2. Results and discussion
J/V measurements
We investigated the influence of embedded dipoles on electron transport of SAMs placing them in EGaIn junctions of the form AuTS/SAM//GanOm/EGaIn (where “/” denotes an interface defined by chemisorption and “//” by physisorption).38 Here EGaIn stands for eutectic alloy of Ga and In (75.5% Ga and 24.5% In by weight, mp = 15.7 °C) which is covered by a superficial layer of ∼0.7 nm of conductive GanOm. Multiple studies have shown that the oxide layer has a negligible effect on transport properties in EGaIn junctions and is orders of magnitude more conductive than the contacts.6,38–40 We designed three structures (depicted and assigned in Fig. 1) for this study that possess identical length, surface chemistry, and nearly identical gas-phase frontier orbital energies; for TP1-down and -up they are identical (as is their empirical formula). All three compounds form well-defined SAMs on template-stripped Au (AuTS)41 and were extensively characterized by a number of complementary surface-analytical techniques,42 exhibiting comparable film thickness and packing densities (see Table 1). The discernible difference is the dipole moment associated with the central aromatic ring (either a pyrimidine or benzene).
Fig. 1. Schematic of a junction with two pyrimidyl-containing compounds (TP1-down and TP1-up) and the reference compound (TP1). Arrows indicate directions of dipole moments associated with the embedded pyrimidine rings (from negative to positive charge).
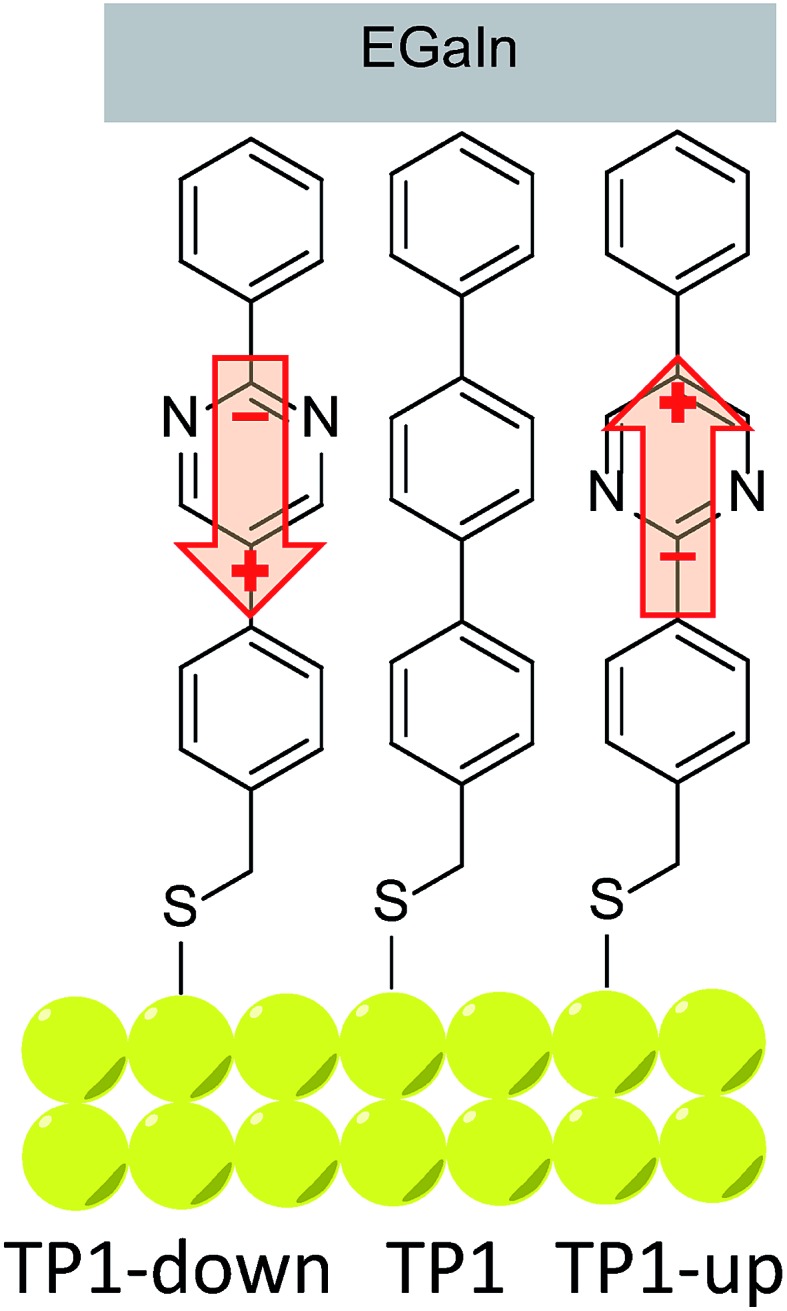
Table 1. X-ray photoemission spectroscopy derived effective thickness and packing density of TP1, TP1-up and TP1-down SAMs; X-ray absorption spectroscopy derived tilt angles; WF shifts with respect to pristine gold c .
| SAM | Effective thickness (nm) | Packing density (molecules per cm2) | Tilt angle | WF shift a (eV) |
| TP1 | 1.78 ± 0.04 | 4.6 × 10¹⁴ | 18 ± 3° | 0.98 |
| TP1-up | 1.74 ± 0.05 | 4.2 × 10¹⁴ | 18 ± 3° | 1.41(+0.43 b ) |
| TP1-down | 1.75 ± 0.05 | 4.3 × 10¹⁴ | 17 ± 3° | 0.43(–0.55 b ) |
aMeasured with a Kelvin probe; we use opposite sign conventions for Φ.
bDifference from TP1.
cExperimental values are from ref. 42.
An immediate consequence of the collective effect of SAMs of polar pyrimidyl groups is the modification of the electrostatic potential profile, which shifts the vacuum level and the energy separation between EF and frontier molecular orbitals. Transition voltages offer insight into the effects of electrostatic fields induced by SAMs because they carry information about the level alignment between the frontier molecular orbitals and the Fermi energies of the electrodes. This information is inaccessible experimentally and is challenging to model theoretically, as the details of alignment between molecular and electrode levels are difficult to predict.43,44 Our experimental approach is to vary an internal, molecular property—in this case dipole moment—and measure the effect in a SAM supported by a bottom electrode (i.e., ex situ) before the top contact is installed. We chose shifts in the work function of the bottom electrode (Φ) because work function shift (ΔΦ) is defined by the collective effect of embedded dipoles in the SAM.45 This collective effect is preserved when the top contact is installed (i.e., in situ), because the dipoles are embedded in the SAM and are isolated from both interfaces. After assembling the junction and performing electrical measurements, we extracted VT and plotted it against ΔΦ to give us two experimental parameters, one intrinsic to the SAM/bottom-contact (ΔΦ) and one to the bottom-contact/SAM//top-contact (VT). This approach is similar to that of the analysis of β, where tunneling distance d (which is an ex situ parameter and can be calculated and measured in multiple ways) is correlated to current density J (an in situ characteristic of an assembled junction). It is important to compare trends because the absolute magnitude of VT is still affected by the details of the contacts.26,36
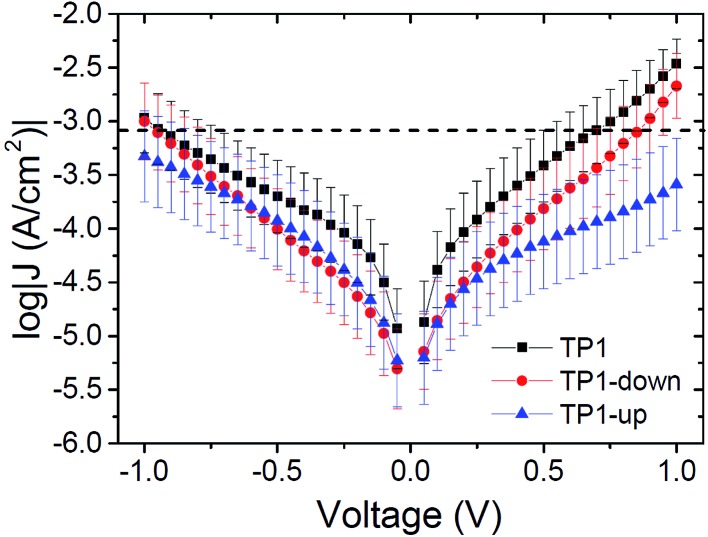
Fig. 2 summarizes measurements of tunneling current through SAMs of TP1, TP1-down, and TP1-up. These data were acquired by sweeping the potential in EGaIn junctions through a range of ±1 V (see ESI† for a detailed description of data acquisition and analysis). As expected, the conductances of all SAMs are nearly identical. The magnitude of current is dominated by the tunneling distance, which is identical along the series, and is influenced only slightly, if at all, by the embedded dipoles (β ≈ 0.4 Å–1 for these backbones46). All of the curves are slightly asymmetric,47 with TP1-up showing opposite asymmetry—it conducts slightly more at negative bias as opposed to TP1 and TP1-down, which are slightly less conductive at negative bias (but values of J(+) and J(–) are within error for most values of V for all three SAMs, see the ESI†). Though there is evidence that terminal pyrimidine rings can induce asymmetry in J/V traces48–50 (which can theoretically be caused by internal dipole moments as well,51) we are hesitant to ascribe the observed asymmetry solely to the presence of molecular dipoles, since TP1 (which does not possess an embedded dipole) and TP1-down exhibit comparable degrees of asymmetry. However we can eliminate packing, tilt, and the molecule–electrode interfaces, as these parameters are effectively identical for the three SAMs. The difference in the symmetry of the J/V curve of TP1-up may be related to the effect of the direction of the dipole moments on the hybridization of the HOMO with states in the gold electrode (see below).
Fig. 2. Plots of log current-density versus applied potential for SAMs of TP1 (black squares), TP1-down (red circles) and TP1-up (blue triangles). Values of log|J| at V = 0 are omitted for clarity. Error bars represent 95% confidence intervals. The three traces are hardly distinguishable at negative bias, while, at positive bias, TP1-up deviates from the rest showing opposite asymmetry (J(+1 V) is slightly higher than J(–1 V) for TP1 and TP1-down and opposite for TP1-up).
Transition voltage measurements
We calculated VT by re-plotting raw I/V data as ln(I/V2) versus 1/V for both positive and negative biases for each J/V curve and extrapolating the minimum (see the ESI† for details on VT acquisition). The peak values of Gaussian fits (μ) to the resulting distributions are taken as VT and the error is derived from the widths (σ). These data are summarized in Table 2 along with gas-phase HOMO energies and dipole moments calculated using structural information from the characterization of the SAMs (as described in ref. 46). The HOMO energies serve only to highlight the electronic similarities between the three compounds, not the SAMs. The values of VT at negative bias (denoted V–T) are systematically higher than the corresponding values of V+T, which is common for EGaIn junctions,26,46 but they follow the same trend; increasing from TP1-down to TP1 to TP1-up. The value of V+T for TP1 is in good agreement with the previously reported value of 0.55 ± 0.10 V.46 The general trend is also in agreement; “down” dipole moments lower both V–T and V+T with respect to “up” dipole moments.
Table 2. Values of VT for all SAMs for positive (V+T) and negative bias (V–T) as well as gas-phase calculated HOMO energies. Errors are 95% CI.
| SAM | V + T (V) | V – T (V) | HOMO a (eV) | μ net a (D) |
| TP1 | 0.52 ± 0.05 | –0.65 ± 0.05 | –5.65 | +0.01 |
| TP1-up | 0.80 ± 0.06 | –0.85 ± 0.03 | –6.08 | –2.75 |
| TP1-down | 0.40 ± 0.02 | –0.43 ± 0.04 | –6.08 | +2.34 |
aGas-phase HSE06/6-311+g(2d,2p) DFT calculations.
Level alignment
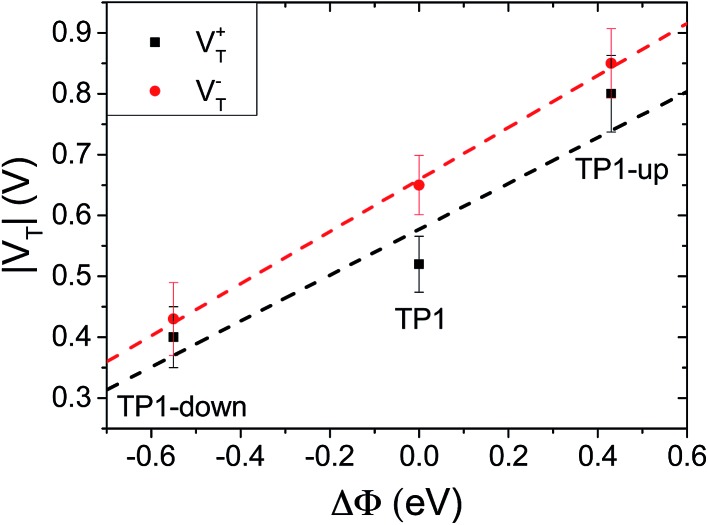
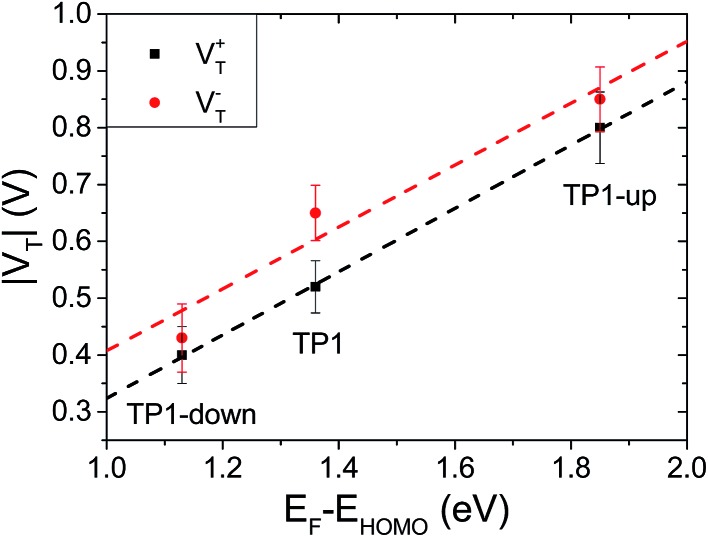
As a result of collective effect of individual dipoles, SAMs of TP1-down and TP1-up shift the electrostatic energy within the junction, which alters the relative positions of the frontier orbitals and the Fermi levels of the electrodes leading to a change in VT. The magnitude of the shift can be approximated by measuring the work function of the bare AuTS substrate and the substrate supporting a SAM using Kelvin probe technique or UPS.46 Kim et al.24 demonstrated correlation of VTversus ΔΦ using conducting AFM tips to contact SAMs; however, they adjusted Φ by varying materials of either bottom or top electrodes, not the characteristics of the molecules. Another study found a correlation between VT and interfacial dipoles, but could not unambiguously assign it to a molecular property.46 The effects of embedded dipolar groups have also been investigated in aliphatic SAMs (i.e., comprising CH2 backbones), including a study of the physical and electronic structure effects of embedded esters52 as well as a study of the J/V properties of embedded amides,9 however, no correlation to VT has been established. Taking TP1 as a reference point, the shifts in TP1-down and up are ΔΦ = –0.55 and +0.43 eV (see Table 1), respectively; they are shifted by approximately the same amount, but opposite in sign, from TP1. Fig. 3 shows plots of V+T and V–Tversus ΔΦ. The plots are approximately linear, fitting with R2 = 0.77 and 0.99 respectively, demonstrating that VT correlates to the shift in vacuum level of AuTS induced by the embedded dipoles of the SAMs. A symmetric offset is apparent for V–T, which differs from TP1 by ∼±0.2 V, but less so for V+T; however, the correlation of the latter to ΔΦ is also less robust. Thus, it appears that the simple picture in Fig. 1 is a reasonable, qualitative description of the synthetic manipulation of VT.
Fig. 3. Plot of V+T (black squares, fitting with the slope of 0.38 and R2 = 0.77) and V–T (red circles, slope of 0.43 and R2 = 0.99) versus the SAM-induced work-function shift. Values of ΔΦ are taken from Table 1.
DFT calculations
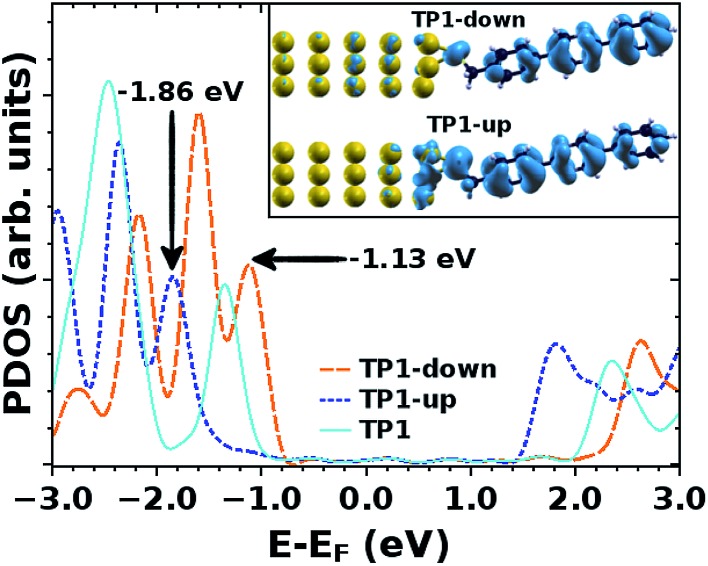
Valuable insight can be gained from the level alignment of the molecular states relative to the Fermi energy of the Au substrate in the absence of the EGaIn (top) electrode. Thus, we plot the DFT calculated projected densities of states (PDOS) associated with the three studied monolayers in Fig. 4. We used the hybrid functional HSE53,54 for the periodic band-structure calculations (performed with the VASP code,55 see the ESI† for details) for the metal–SAM systems as, due to the mixing of short-range Fock and semi-local exchange, orbital self-interactions errors that would distort the electronic structure of pyrimidyl-containing systems can be reduced.56,57 However, the absolute values of the calculated level alignment, especially for upright-standing molecules,58 cannot quantitatively reproduce the experiment even with the hybrid-functionals used here.43,59,60 Nevertheless, for chemically similar systems such as the ones studied here, advanced hybrid DFT-calculations allow for predicting trends in the level alignment.
Fig. 4. Density of states of TP1, TP1-up and TP1-down projected (PDOS) onto the molecular region as calculated with the HSE functional. The energy scale is given relative to the Fermi-energy, EF; the inset depicts the charge density associated with the highest occupied peaks in the PDOS (derived from the molecular HOMO) of TP1-down (top) and TP1-up (bottom). These are calculated per system in a ±0.1 eV interval centered at the energy indicated by an arrow (isodensity value: 0.01 e Å–3).
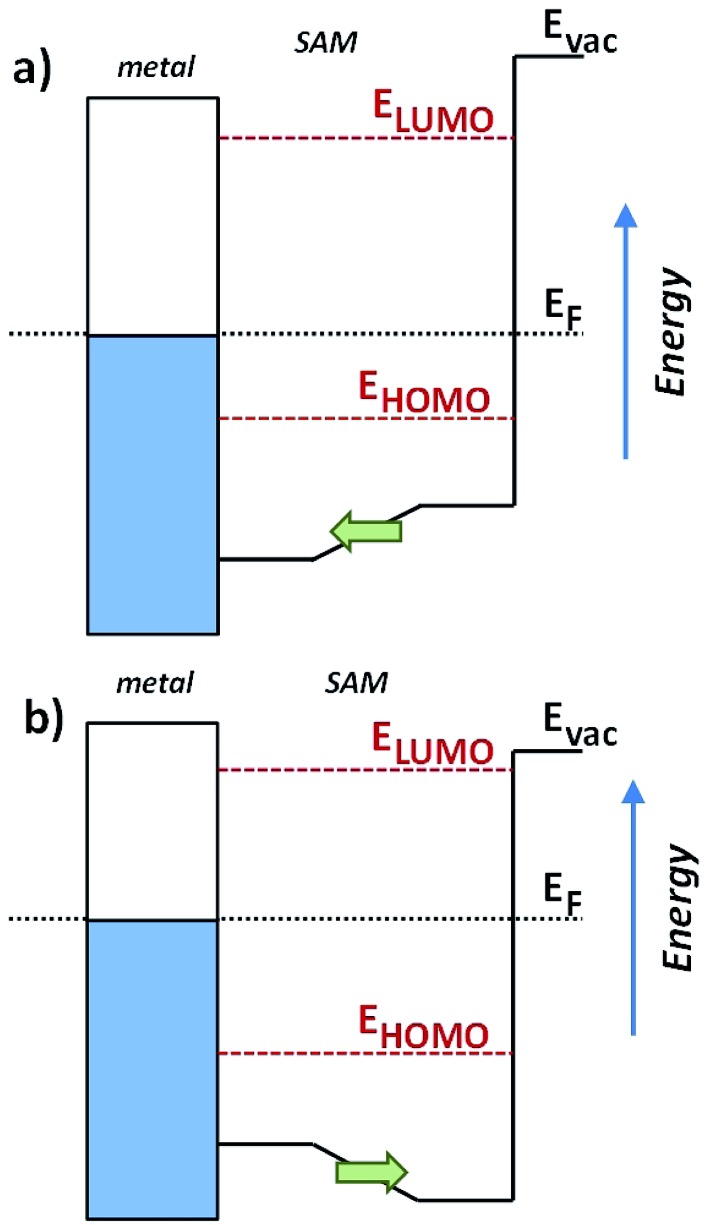
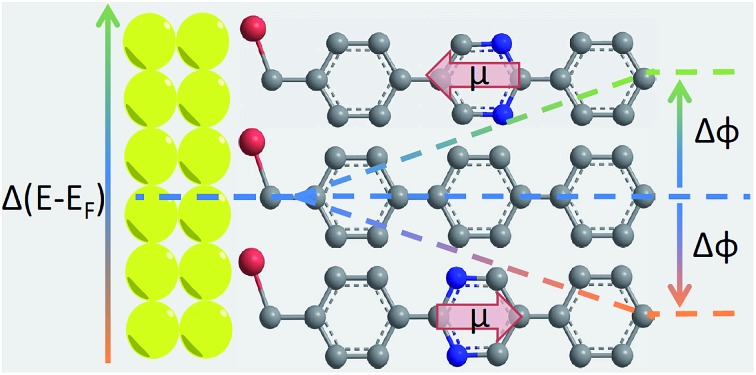
In Fig. 4, one clearly sees that in TP1-down the highest occupied states are shifted towards EF compared to the reference TP1 system, while they are shifted away in the TP1-up case. These shifts can be understood from the peculiar distribution of the electrostatic energy within the SAM where, due to collective electrostatic effects61,62 (i.e., the superposition of the fields of the pyrimidyl dipoles arranged in a 2D pattern), the electrostatic energy in the topmost rings is shifted relative to EF (as schematically shown in Fig. 5, a plot of the calculated plane-averaged potentials can be found in ref. 42). This shift has been confirmed by high-resolution XPS experiments.42 As the occupied frontier states are largely delocalized over the SAM, a shift in the electrostatic energy induces a shift in the SAM eigenstates relative to EF (see Fig. 5).
Fig. 5. Schematics of the electrostatic energy distribution and the resulting energy-level alignment in TP1-down (a) and TP1-up (b) SAMs on a Au electrode. The right (upper) parts of the potential well are shifted up, respectively down in energy as a consequence of the pyrimidyl dipoles arranged in a 2D plane. The SAM eigenstates (partially) follow that shift.
The frontier orbitals are largely delocalized over the molecular backbone, associated with highly transmissive channels in the transport experiments. Nevertheless, one can see that in the TP1-down (TP1-up) case the HOMO-derived PDOS has a larger weight on the ring far from (close to) the Au substrate, which is the behavior expected for such a situation,63 as can be understood, for example, from the analogy of SAM-states and electron- and hole-states in quantum-well states in the presence of a potential gradient.56 This difference in the spatial distribution of PDOS densities might also be responsible for the qualitative differences in the shapes of the J/V curves for SAMs of TP1-up and TP1-down (Fig. 2).
The question remains as to what exactly happens at VT, e.g., if the tail of density of states comes into resonance with EF. A calculation of the PDOS for SAMs bound to a metal surface made by plotting the peaks in Fig. 4 produces good correlation of VTversus peak values of HOMO levels (Fig. 6). The slopes of linear fits for both V+T and V–T are almost equal (0.56 and 0.55 respectively) and in good agreement with the experimentally determined slope of 0.55 reported by Beebe et al.21 Regardless of the exact physical meaning of the magnitude of VT, from the trend it is clearly possible to “feel” energy level alignment in these SAMs. Moreover, the agreement in the slopes suggests that shifting the vacuum level by embedding dipoles in a SAM is physically similar to changing the identity of the electrodes, while the effects of dipoles placed at the physisorbed interface are more convoluted.46
Fig. 6. Plot of V+T (black squares, fitting with the slope of 0.56 and R2 = 1) and V–T (red circles, slope of 0.55 and R2 = 0.87) vs. EF – EHOMO from the calculated density of states. Error bars are 95% CI.
Trends in transition voltages
Just as the absolute value of J for an isolated member of a series of molecules (from which one cannot make a J vs. d plot to extract β) is significantly less useful than β, the absolute value of VT carries complex, inseparable information and is less useful than a trend that relates a shift in VT to a controllable variable. The trend presented in Fig. 3 shows that a shift in VT is correlated to a change in Φ (hence dipole moment) revealing a molecular fingerprint in the transport properties. For any series of molecules of equal length β is obviously not applicable, thus trends in VT might serve as empirical evidence that transport is dominated by tunneling through molecules (Fig. S3†). The ability to make this distinction is both important and non-trivial. For example, one can observe quantum interference effects as a length-independent decrease in J with varying conjugation patterns,14 a lack of measurable current in meta substituted stilbene thiols64 or negative curvature in 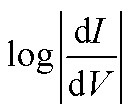 ,16 but these interpretations all rely on the underlying assumption that I and J are dominated by transport through molecules. Likewise, applying theoretical models to explain the interference effects relies on the same assumptions. This problem is particularly evident when experimental observations that disagree with theory are based on a somewhat ambiguous interpretations of data (i.e., bi-modal distributions of conductance).65 The series of molecules in this paper is not expected to exhibit any unusual transport properties, but despite the lack of a distance-dependence the J/V data presented in Fig. 2 are unambiguously dominated by transport through molecules. And we have shown that embedded dipoles have a measurable influence on the energetics within molecular tunneling junctions comprising TP1, TP1-down, and TP1-up, but do not have a significant influence on the magnitude of tunneling charge-transport.
3. Conclusions
We examined tunneling junctions comprising SAMs of three molecules of nearly identical length, packing density, tilt angle, torsional angle and gas-phase HOMO energies.42 The only difference is the inclusion of a central pyrimidine ring, which introduces a dipole moment, the direction of which is synthetically controllable by adjusting the orientation of the ring. The resulting dipole moments are embedded in the SAM as opposed to being introduced as a head (tail) group in contact with the top (bottom) electrode. Thus, we can eliminate both electrode interfaces, tunneling distance, packing, tilt, torsional angles, and gas-phase HOMO energies as variables and compare the tunneling transport properties.
We find that, outside of a slight difference in J at +1 V, the J/V curves are indistinguishable and this slight difference may be the result of the dipole moments affecting the distribution of HOMO-derived PDOS on or off of the Au electrode. The transition voltages, however, differ systemically and follow the same trend as the experimentally-determined vacuum level shift induced by the direction and magnitude of the embedded dipoles. The trends in Fig. 3 and 6 capture the critical aspect of investigating systematic behavior in VT. The former relates an external experimental observable, Φ, to an internal experimental observable, VT. The latter relates this internal observable to the details of the level alignment that takes place when molecules are chemisorbed to a metal, which can in turn be related to experimentally observable energy positions of frontier electronic states.24 Thus, the ability to manipulate VT systematically through synthetic modifications away from the electrode interfaces simultaneously provides evidence that the charge transport is dominated by molecules and provides quantitative information about their electronic states. This physical interpretation of VT is not new, but the isolation of the internal electrostatic profile of a molecule as a variable that affects VT is an important step forward in the fundamental understanding of tunneling transport through molecular junctions and, ultimately, control over functionality.
This result demonstrates that (i) VT can be manipulated synthetically in a predictable manner, (ii) changes to VT can be ascribed to an intrinsic property of the molecules inside the tunneling junction, (iii) the energy level alignment can be adjusted using embedded dipoles without altering any other characteristic of a SAM. And, while the length dependence of conductance can be described by β, VT carries information about energy levels; trends in VT can separate some of these influences. The inclusion of embedded dipoles (or specifically pyrimidine rings) instills a “molecular fingerprint” to tunneling transport that is separate from the magnitude of I or J. This observation is in agreement with studies showing that polar groups (and embedded dipoles in saturated molecules) have no influence on β.9 While the lone pairs of a pyrimidyl moiety can interfere with edge-to-π interactions, in this particular case all three SAMs pack nearly identically.42 Thus, this effect is sufficiently weak that it is overcome by the flanking phenyl rings, suggesting that the use of pyrimidine moieties specifically to create a dipole moment is generalizable. We suggest that, irrespective of the precise physical interpretation of transition voltages, trends in VT—specifically VTversus ΔΦ—are particularly useful for unsaturated molecules in which molecular length is synthetically or experimentally inaccessible or in cases where β is not sensitive to synthetic alterations.
Supplementary Material
Acknowledgments
RCC, DF, and AK acknowledge the European Research Council for the ERC Starting Grant 335473 (MOLECSYNCON). TW and MZ thank the Max-IV staff, and A. Preobrajenski in particular, for the technical support during the experiments at the synchrotron. Part of this work was supported financially by the Deutsche Forschungsgemeinschaft (grants ZH 63/17-1 and ZH 63/14-2). DAE and EZ acknowledge financial support by the Austrian Science Fund (FWF): project I937-N19 within the ERAChemistry framework and project P24666-N20. The computational studies presented have been mainly performed using the clusters of the division for high-performance computing at the Graz University of Technology.
Footnotes
†Electronic supplementary information (ESI) available. See DOI: 10.1039/c5sc03097h
References
- Bumm L. A. ACS Nano. 2008;2:403–407. doi: 10.1021/nn8001246. [DOI] [PubMed] [Google Scholar]
- Bernasek S. L. Angew. Chem., Int. Ed. 2012;51:9737–9738. doi: 10.1002/anie.201204516. [DOI] [PubMed] [Google Scholar]
- Jiang L., Sangeeth C. S. S., Wan A., Vilan A., Nijhuis C. A. J. Phys. Chem. C. 2015;119:960–969. [Google Scholar]
- Gotsmann B., Riel H., Lörtscher E. Phys. Rev. B: Condens. Matter Mater. Phys. 2011;84:205408. [Google Scholar]
- Weiss E. A., Chiechi R. C., Kaufman G. K., Kriebel J. K., Li Z., Duati M., Rampi M. A., Whitesides G. M. J. Am. Chem. Soc. 2007;129:4336–4349. doi: 10.1021/ja0677261. [DOI] [PubMed] [Google Scholar]
- Simeone F. C., Yoon H. J., Thuo M. M., Barber J. R., Smith B., Whitesides G. M. J. Am. Chem. Soc. 2013;135:18131–18144. doi: 10.1021/ja408652h. [DOI] [PubMed] [Google Scholar]
- Nijhuis C. A., Reus W. F., Barber J. R., Dickey M. D., Whitesides G. M. Nano Lett. 2010;10:3611–3619. doi: 10.1021/nl101918m. [DOI] [PubMed] [Google Scholar]
- Yoon H. J., Shapiro N. D., Park K. M., Thuo M. M., Soh S., Whitesides G. M. Angew. Chem., Int. Ed. 2012;51:4658–4661. doi: 10.1002/anie.201201448. [DOI] [PMC free article] [PubMed] [Google Scholar]
- Yoon H. J., Bowers C. M., Baghbanzadeh M., Whitesides G. M. J. Am. Chem. Soc. 2014;136:16–19. doi: 10.1021/ja409771u. [DOI] [PubMed] [Google Scholar]
- Mirjani F., Thijssen J. M., Whitesides G. M., Ratner M. A. ACS Nano. 2014;8:12428–12436. doi: 10.1021/nn505115a. [DOI] [PubMed] [Google Scholar]
- Liao K. C., Yoon H. J., Bowers C. M., Simeone F. C., Whitesides G. M. Angew. Chem., Int. Ed. 2014;53:3889–3893. doi: 10.1002/anie.201308472. [DOI] [PubMed] [Google Scholar]
- Fracasso D., Kumar S., Rudolf P., Chiechi R. C. RSC Adv. 2014;4:56026–56030. [Google Scholar]
- Thuo M. M., Reus W. F., Simeone F. C., Kim C., Schulz M. D., Yoon H. J., Whitesides G. M. J. Am. Chem. Soc. 2012;134:10876–10884. doi: 10.1021/ja301778s. [DOI] [PubMed] [Google Scholar]
- Fracasso D., Valkenier H., Hummelen J. C., Solomon G. C., Chiechi R. C. J. Am. Chem. Soc. 2011;133:9556–9563. doi: 10.1021/ja202471m. [DOI] [PubMed] [Google Scholar]
- Gorczak N., Renaud N., Tarkuç S., Houtepen A. J., Eelkema R., Siebbeles L. D. A., Grozema F. C. Chem. Sci. 2015;6:4196–4206. doi: 10.1039/c5sc01104c. [DOI] [PMC free article] [PubMed] [Google Scholar]
- Guédon C. M., Valkenier H., Markussen T., Thygesen K. S., Hummelen J. C., van der Molen S. J. Nat. Nanotechnol. 2012;7:305–309. doi: 10.1038/nnano.2012.37. [DOI] [PubMed] [Google Scholar]
- Arroyo C. R., Tarkuc S., Frisenda R., Seldenthuis J. S., Woerde C. H. M., Eelkema R., Grozema F. C., van der Zant H. S. J. Angew. Chem., Int. Ed. 2013;52:3152–3155. doi: 10.1002/anie.201207667. [DOI] [PubMed] [Google Scholar]
- Valkenier H., Guédon C. M., Markussen T., Thygesen K. S., van der Molen S. J., Hummelen J. C. Phys. Chem. Chem. Phys. 2014;16:653–662. doi: 10.1039/c3cp53866d. [DOI] [PubMed] [Google Scholar]
- Lu Q., Liu K., Zhang H., Du Z., Wang X., Wang F. ACS Nano. 2009;3:3861–3868. doi: 10.1021/nn9012687. [DOI] [PubMed] [Google Scholar]
- Beebe J. M., Kim B., Gadzuk J. W., Frisbie C. D., Kushmerick J. G. Phys. Rev. Lett. 2006;97:026801. doi: 10.1103/PhysRevLett.97.026801. [DOI] [PubMed] [Google Scholar]
- Beebe J. M., Kim B., Frisbie C. D., Kushmerick J. G. ACS Nano. 2008;2:827–832. doi: 10.1021/nn700424u. [DOI] [PubMed] [Google Scholar]
- Bennett N., Xu G., Esdaile L. J., Anderson H. L., Macdonald J. E., Elliott M. Small. 2010;6:2604–2611. doi: 10.1002/smll.201001046. [DOI] [PubMed] [Google Scholar]
- Guo S., Hihath J., Díez-Pérez I., Tao N. J. Am. Chem. Soc. 2011;133:19189–19197. doi: 10.1021/ja2076857. [DOI] [PubMed] [Google Scholar]
- Kim B., Choi S. H., Zhu X.-Y., Frisbie C. D. J. Am. Chem. Soc. 2011;133:19864–19877. doi: 10.1021/ja207751w. [DOI] [PubMed] [Google Scholar]
- Lennartz M. C., Atodiresei N., Caciuc V., Karthäuser S. J. Phys. Chem. C. 2011;115:15025–15030. [Google Scholar]
- Ricœur G., Lenfant S., Guérin D., Vuillaume D. J. Phys. Chem. C. 2012;116:20722–20730. [Google Scholar]
- Lefèvre X., Moggia F., Segut O., Lin Y.-P., Ksari Y., Delafosse G., Smaali K., Guérin D., Derycke V., Vuillaume D., Lenfant S., Patrone L., Jousselme B. J. Phys. Chem. C. 2015;119:5703–5713. [Google Scholar]
- Guo S., Zhou G., Tao N. Nano Lett. 2013;13:4326–4332. doi: 10.1021/nl4021073. [DOI] [PubMed] [Google Scholar]
- Bâldea I. J. Am. Chem. Soc. 2012;134:7958–7962. doi: 10.1021/ja302248h. [DOI] [PubMed] [Google Scholar]
- Araidai M., Tsukada M. Phys. Rev. B: Condens. Matter Mater. Phys. 2010;81:235114. [Google Scholar]
- Huisman E. H., Guédon C. M., van Wees B. J., van der Molen S. J. Nano Lett. 2009;9:3909–3913. doi: 10.1021/nl9021094. [DOI] [PubMed] [Google Scholar]
- Chen J., Markussen T., Thygesen K. S. Phys. Rev. B: Condens. Matter Mater. Phys. 2010;82:121412. [Google Scholar]
- Bâldea I. Phys. Rev. B: Condens. Matter Mater. Phys. 2012;85:035442. doi: 10.1103/PhysRevB.85.165447. [DOI] [PMC free article] [PubMed] [Google Scholar]
- Tan A., Balachandran J., Dunietz B. D., Jang S.-Y., Gavini V., Reddy P. Appl. Phys. Lett. 2012;101:243107. [Google Scholar]
- Wang G., Kim Y., Na S.-I., Kahng Y. H., Ku J., Park S., Jang Y. H., Kim D.-Y., Lee T. J. Phys. Chem. C. 2011;115:17979–17985. [Google Scholar]
- Vilan A., Cahen D., Kraisler E. ACS Nano. 2013;7:695–706. doi: 10.1021/nn3049686. [DOI] [PubMed] [Google Scholar]
- Sotthewes K., Hellenthal C., Kumar A., Zandvliet H. J. W. RSC Adv. 2014;4:32438–32442. [Google Scholar]
- Chiechi R. C., Weiss E. A., Dickey M. D., Whitesides G. M. Angew. Chem., Int. Ed. 2008;120:148–150. doi: 10.1002/anie.200703642. [DOI] [PubMed] [Google Scholar]
- Reus W. F., Thuo M. M., Shapiro N. D., Nijhuis C. A., Whitesides G. M. ACS Nano. 2012;6:4806–4822. doi: 10.1021/nn205089u. [DOI] [PubMed] [Google Scholar]
- Nijhuis C. A., Reus W. F., Barber J. R., Whitesides G. M. J. Phys. Chem. C. 2012;116:14139–14150. [Google Scholar]
- Weiss E. A., Kaufman G. K., Kriebel J. K., Li Z., Schalek R., Whitesides G. M. Langmuir. 2007;23:9686–9694. doi: 10.1021/la701919r. [DOI] [PubMed] [Google Scholar]
- Abu-Husein T., Schuster S., Egger D. A., Kind M., Santowski T., Wiesner A., Chiechi R., Zojer E., Terfort A., Zharnikov M. Adv. Funct. Mater. 2015;25:3943–3957. [Google Scholar]
- Neaton J. B., Hybertsen M. S., Louie S. G. Phys. Rev. Lett. 2006;97:216405. doi: 10.1103/PhysRevLett.97.216405. [DOI] [PubMed] [Google Scholar]
- Quek S. Y., Venkataraman L., Choi H. J., Louie S. G., Hybertsen M. S., Neaton J. B. Nano Lett. 2007;7:3477–3482. doi: 10.1021/nl072058i. [DOI] [PubMed] [Google Scholar]
- Alloway D. M., Hofmann M., Smith D. L., Gruhn N. E., Graham A. L., Colorado R., Wysocki V. H., Lee T. R., Lee P. A., Armstrong N. R. J. Phys. Chem. B. 2003;107:11690–11699. [Google Scholar]
- Fracasso D., Muglali M. I., Rohwerder M., Terfort A., Chiechi R. C. J. Phys. Chem. C. 2013;117:11367–11376. [Google Scholar]
- Yoon H. J., Liao K. C., Lockett M. R., Kwok S. W., Baghbanzadeh M., Whitesides G. M. J. Am. Chem. Soc. 2014;136:17155–17162. doi: 10.1021/ja509110a. [DOI] [PubMed] [Google Scholar]
- Morales G. M., Jiang P., Yuan S., Lee Y., Sanchez A., You W., Yu L. J. Am. Chem. Soc. 2005;127:10456–10457. doi: 10.1021/ja051332c. [DOI] [PubMed] [Google Scholar]
- Lee Y., Carsten B., Yu L. Langmuir. 2009;25:1495–1499. doi: 10.1021/la802923a. [DOI] [PubMed] [Google Scholar]
- Díez-Pérez I., Hihath J., Lee Y., Yu L., Adamska L., Kozhushner M. A., Oleynik I. I., Tao N. Nat. Chem. 2009;1:635–641. doi: 10.1038/nchem.392. [DOI] [PubMed] [Google Scholar]
- Zhang G., Ratner M. A., Reuter M. G. J. Phys. Chem. C. 2015;119:6254–6260. [Google Scholar]
- Cabarcos O. M., Shaporenko A., Weidner T., Uppili S., Dake L. S., Zharnikov M., Allara D. L. J. Phys. Chem. C. 2008;112:10842–10854. [Google Scholar]
- Heyd J., Scuseria G. E., Ernzerhof M. J. Chem. Phys. 2003;118:8207–8215. [Google Scholar]
- Heyd J., Scuseria G. E., Ernzerhof M. J. Chem. Phys. 2006;124:219906. [Google Scholar]
- Kresse G., Furthmüller J. Phys. Rev. B: Condens. Matter Mater. Phys. 1996;54:11169–11186. doi: 10.1103/physrevb.54.11169. [DOI] [PubMed] [Google Scholar]
- Rissner F., Egger D. A., Natan A., Körzdörfer T., Kümmel S., Kronik L., Zojer E. J. Am. Chem. Soc. 2011;133:18634–18645. doi: 10.1021/ja203579c. [DOI] [PMC free article] [PubMed] [Google Scholar]
- Dori N., Menon M., Kilian L., Sokolowski M., Kronik L., Umbach E. Phys. Rev. B: Condens. Matter Mater. Phys. 2006;73:195208. [Google Scholar]
- Track A. M., Rissner F., Heimel G., Romaner L., Käfer D., Bashir A., Rangger G. M., Hofmann O. T., Bučko T., Witte G., Zojer E. J. Phys. Chem. C. 2010;114:2677–2684. [Google Scholar]
- Biller A., Tamblyn I., Neaton J. B., Kronik L. J. Chem. Phys. 2011;135:164706. doi: 10.1063/1.3655357. [DOI] [PubMed] [Google Scholar]
- Egger D. A., Liu Z.-F., Neaton J. B., Kronik L. Nano Lett. 2015;15:2448–2455. doi: 10.1021/nl504863r. [DOI] [PMC free article] [PubMed] [Google Scholar]
- Natan A., Kronik L., Haick H., Tung R. Adv. Mater. 2007;19:4103–4117. [Google Scholar]
- Heimel G., Rissner F., Zojer E. Adv. Mater. 2010;22:2494–2513. doi: 10.1002/adma.200903855. [DOI] [PubMed] [Google Scholar]
- Kretz B., Egger D. A., Zojer E. Adv. Sci. 2015;2:1400016. doi: 10.1002/advs.201400016. [DOI] [PMC free article] [PubMed] [Google Scholar]
- Aradhya S. V., Meisner J. S., Krikorian M., Ahn S., Parameswaran R., Steigerwald M. L., Nuckolls C., Venkataraman L. Nano Lett. 2012;12:1643–1647. doi: 10.1021/nl2045815. [DOI] [PubMed] [Google Scholar]
- Xia J., Capozzi B., Wei S., Strange M., Batra A., Moreno J. R., Amir R. J., Amir E., Solomon G. C., Venkataraman L., Campos L. M. Nano Lett. 2014;14:2941–2945. doi: 10.1021/nl5010702. [DOI] [PubMed] [Google Scholar]
Associated Data
This section collects any data citations, data availability statements, or supplementary materials included in this article.


