Abstract
Background
Duchenne muscular dystrophy (DMD) causes progressive pathologic changes to muscle secondary to a cascade of inflammation, lipid deposition, and fibrosis. Clinically, this manifests as progressive weakness, functional loss, and premature mortality. Though insult to whole muscle groups is well established, less is known about the relationship between intramuscular pathology and function.
Objective
Differences of intramuscular heterogeneity across muscle length were assessed using an ordinal MRI grading scale in lower leg muscles of boys with DMD and correlated to patient’s functional status.
Methods
Cross sectional T1 weighted MRI images with fat suppression were obtained from ambulatory boys with DMD. Six muscles (tibialis anterior, extensor digitorum longus, peroneus, soleus, medial and lateral gastrocnemii) were graded using an ordinal grading scale over 5 slice sections along the lower leg length. The scores from each slice were combined and results were compared to global motor function and age.
Results
Statistically greater differences of involvement were observed at the proximal ends of muscle compared to the midbellies. Multi-slice assessment correlated significantly to age and the Vignos functional scale, whereas single-slice assessment correlated to the Vignos functional scale only. Lastly, differential disease involvement of whole muscle groups and intramuscular heterogeneity were observed amongst similar age subjects.
Conclusion
A multi-slice ordinal MRI grading scale revealed that muscles are not uniformly affected, with more advanced disease visible near the tendons in a primarily ambulatory population with DMD. A geographically comprehensive evaluation of the heterogeneously affected muscle in boys with DMD may more accurately assess disease involvement.
Key words: Duchenne Muscular Dystrophy, magnetic resonance imaging, myotendinous junction
Introduction
Duchenne muscular dystrophy (DMD), an X-linked recessive genetic disorder with an incidence of 10.7 to 27.7 per 100,000, is caused by a mutation in the dystrophin gene, resulting in an absence or dysfunction of the protein dystrophin (1, 2). Structurally, progressive pathological changes in skeletal muscle resulting from DMD are well described and include inflammation (3), lipid infiltration (4), and fibrotic deposition (5), leading to progressive muscle weakness, loss of functional abilities, and premature mortality (6-8).
Magnetic resonance imaging (MRI) has developed to be a safe, sensitive, non-invasive, and effective method to investigate patterns of disease pathology within muscle in DMD (9-16). To evaluate quality of muscle, Mercuri and colleagues developed an ordinal scale to qualitatively assess severity and disease distribution in congenital muscular dystrophy using T1 weighted MRI imaging (17). This scale has been utilized and modified for a number of studies of various muscular dystrophies and myopathies (16, 18-27). Traditionally, most MRI protocols analyze muscle data from either single or few consecutive slices, selecting slices based on anatomical landmarks of a muscle (14, 15). Such evaluation may have limitations as, published by Vidt and collaborators, who demonstrated that single-image assessment using T1 weighted MRI are not predictive of 3-D measurements of fatty infiltration in patients with rotator cuff tears [28]. Additionally, using water/fat separation MRI, Hooijmans et al. demonstrated heterogeneous fat fractions throughout the length of muscle in DMD (26). In DMD, where muscle injury leads to variable fatty deposition within and between muscles, a 3-D evaluation may provide greater insight into the understanding of the disease process (10, 14-16, 26).
To date, only one group has published data regarding differences of disease involvement along the length of muscles in DMD individuals as visible with MRI, suggesting that the proximal and distal regions of muscle may be preferentially affected when compared to the muscle belly [26]. This phenomenon is in concordance with pre-clinical studies that showed geographic vulnerabilities to disease pathology, specifically an increased susceptibility to disease at the muscle-tendon junction. Furthermore, using a modified Mercuri scale, Polavarapu et al. also reported differences in geographic involvement of different muscles of the thigh, with preferential involvement of the superficial posterior and lateral muscles groups and sparing of the deep posterior and anterior muscle groups in DMD patients (16). Importantly, they also correlated their single-slice findings to the Muscular Dystrophy Functional Rating Scale, demonstrating a relationship between function and MRI observations in the thigh muscles (16). Such observation of heterogeneous disease distribution in axial and craniocaudal directions is critical for understanding the pathophysiology of muscular dystrophies and the natural progression of such diseases.
In this study, we confirm and expand upon the current knowledge base of DMD pathophysiology and the recently published work by Hooijmans and Polavarapu by performing a multi-slice T1 weighted ordinal evaluation of individual lower leg muscles in a larger and primarily ambulant DMD patient population. In addition, we compare proximodistal disease distribution per MRI with clinical functionality and age. The objectives of the present study were (a) to utilize multi-slice MRI in lower legs of boys with DMD to study tendon to muscle differences of disease involvement (fatty changes and fibrosis) within and between individual lower leg muscles and (b) to determine if evaluation in a multi-slice fashion reveals stronger correlations to age and function than single-slice analyses in boys with DMD.
Methods
Study design
In this cross sectional study, 30 boys (age, 9.9 ± 2.7 years; range, 6.2-15.2; height, 1.27 ± 0.3m; weight, 34.0 ± 2.6 kg; ambulatory, 27/30; glucocorticoid positive, 30/30; Vignos median score, 25 IQR%, and 75 IQR% = 2, 1, 2.5) with DMD confirmed by molecular genetic testing (PCR amplification, but specific genetic mutations not available) and/or immunohistochemistry from biopsy. In addition, 6 unaffected control males (age, 7.7 ± 1.9 years; range, 6.3-13.9 height, 1.31 ± 0.11 m; weight, 26.2 ± 4.1 kg; ambulatory, 6/6; glucocorticoid positive, 0/6; Vignos median score, 25 IQR%, and 75 IQR% = 1, 1, 1) volunteered to participate in the study. All participants were functionally scored on the Vignos lower extremity functional scale (29). This study was HIPAA compliant and approved by the Institutional Review Board at the University of Florida. Upon thorough description of the study, written consent was provided by a parent or legal guardian and written assent was provided by the pediatric subjects.
Magnetic resonance acquisition and measures
Subjects were asked to avoid any vigorous physical activity for two days prior to the study and to use a wheelchair or equivalent mobility device when traveling to avoid excessive walking. Acquisitions were performed on a 3.0 Tesla whole body human system (Achieva, Philips Medical Systems, Best, Netherlands) at the McKnight Brain Institute at the University of Florida. With a parent and study staff member accompanying the subjects in the testing room, subjects were placed in a supine position within the magnet without sedation. Each subjects’ right lower leg was placed in an eight-channel SENSE receive-only extremity coil (Invivo, Gainesville, FL, USA) with the proximal end of the coil aligned with the fibular head and tibial tuberosity. Padded weights were utilized to maintain the leg in a fixed position for the duration of the scan. Commercially available T1 weighted 3D gradient echo images were acquired (field of view, 12-24 x 12-14 cm2, voxel size = 0.75 x 0.75 x 2.8 mm3, 50 slices, flip angle = 20°, TR/TE = 24/1.8, number of averages = 2). Acquisitions were made with fat suppression using spectral presaturation with inversion recovery (SPIR). During data collection, subjects were shown a movie of their choice on an in-magnet video display system to facilitate compliance and minimize movement artifacts during the scanning.
MRI and function data evaluation
Six muscles (tibialis anterior [TA], extensor digitorum logus [EDL], peroneus [Per], soleus [Sol], medial gastrocnemius [MG], and lateral gastrocnemius [LG]) were analyzed by two blinded reviewers, RW and CB, with 5 and 10 years of experience assessing muscle on MRI, respectively. When the two reviewers were not in agreement (#x003C; 5% of slices), selected slices were reviewed together with the principal investigator who served as a tie breaker.
For each subject, 5 fat-saturated axial images were selected along the length of the leg for image analysis. Slice selection was acquired based on the lower leg length percentage distal from the tibial head to account for differences in age and height between participants: proximal: 10 ± 2%, mid-proximal: 19 ± 2%, middle: 26 ± 2%, mid-distal: 35 ± 2% and distal: 43 ± 2% from the tibial plateau as shown in Figure 1. MRI assessment (Fig. 2) of each muscle was obtained using the Mercuri grading scale, previously used for a variety of muscular dystrophies (10, 11, 14-17, 30-32).
Figure 1.
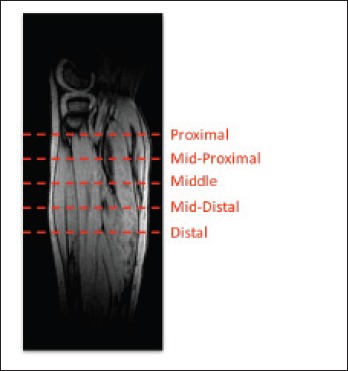
Schematic representation of slice selections along the length of the lower leg. Representation of the slice positions based the percentage distance along the tibia (starting at the tibial plateau) along the longitudinal axis: proximal (P): ~10-12%, mid-proximal (MP): ~17-21%, middle (M): 25-28%, mid-distal (MD): 33-37%, distal (D): 41-45% inferior of the tibial plateau.
Figure 2.
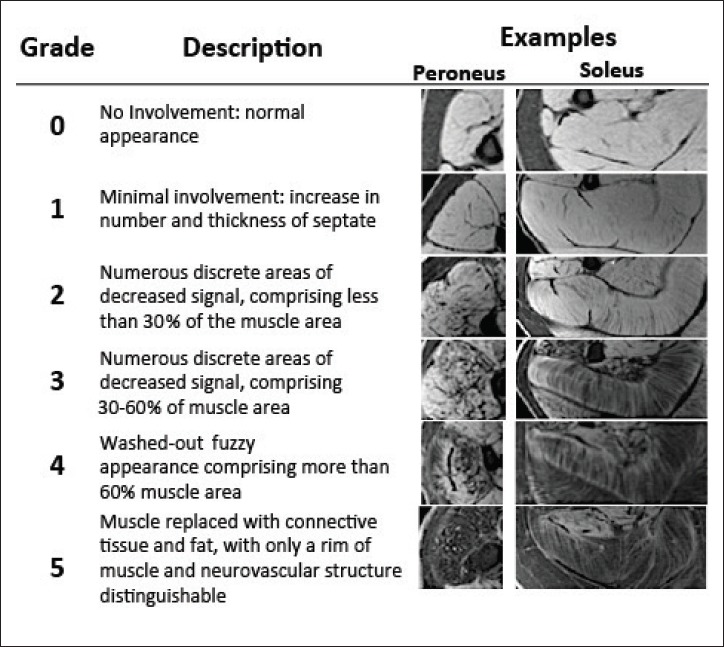
Descriptions of the ordinal MRI scores to describe disease involvement of muscle.
To demonstrate the distribution of disease within all muscles, an ordinal scale MRI score was assigned to individual muscles, based on disease involvement (Figure 2). Note that in T1-weighted fat suppressed images, hypo-intense regions may be composed of either lipid infiltrate or fibrosis though the major contributor responsible for hypointense signal is fatty replacement. Further, MRI scores were binned in the following categories for evaluation purposes: not affected (MRI Score = 0), moderately affected (MRI Score = 1-2), or severely affected (MRI Score = 3-5). To assess the overall disease involvement of the lower leg muscles, MRI scores for all 6 muscles were summed to obtain both an overall leg MRI score and a single middle slice leg MRI score. MRI scores were then normalized to the total number of slices, accounting for muscle data missing from slices, creating comparable normalized multi-slice scores and slice scores. Similarly, Vignos scores were binned into four categories: 1 (able to walk and climb stairs without assistance), 2 (able to walk and climb stairs with aid of railing), 3-4 (walks, climbs stairs slowly, < 25s for 8 standard steps with railing or not at all), and 5+ (unable to rise from chair, unable to walk independently, or unable to walk at all). Furthermore, subjects’ ages and functional ability were compared to normalized multislice and single-slice scores.
Statistical evaluation
To compare the differences of ordinal MRI scores, Wilcoxon matched-pairs signed rank tests were performed, comparing the proximal to middle and distal to middle slices of all muscles. To quantify the relationship between age and MRI scores, Spearman’s rank correlation was computed. A Kruskal-Wallis test with adjustment for multiple comparisons was used to compare MRI scores across Vignos score categories. Statistical analyses were conducted using GraphPad Prism (version 6.0d; La Jolla, CA, USA). Statistical significance was set at p < 0.05 (two-tailed).
Results
Non-uniform distribution of muscular involvement in DMD
In order to assess spatial heterogeneity and pathology within and between muscles, MR images were acquired along the length of lower legs of boys with DMD (Fig. 1). Representative cross sectional images (Fig. 3) showed variability of disease involvement between muscles, with the Per muscle being the most affected, and with different degrees of involvement between proximal, midbelly, and distal portions of muscles (Fig. 3). Furthermore, while boys with DMD typically demonstrated worse pathology at the myotendinous junctions, not all subjects revealed identical patterns of disease affliction. The spectrum of MRI scores and how different pathology manifests along various spatial regions of the same muscle are shown in two similarly aged representative subjects (aged 10.0 and 10.7 years) in Figure 4. When investigating pathology along the length of muscles, variability was observed, with greater evidence of disease at the most proximal and distal ends of muscle as compared to the midbelly (Fig. 5). Through presentation of each subjects’ muscle MRI scores (Fig. 5), one can appreciate the differences in severity of disease based on location within individual muscles and between specific muscle groups for all subjects. Furthermore, when proximal versus middle single slices were compared of each of the muscles, significant differences were observed in five out of the six muscles (Table 1). No significant differences were observed when comparing the middle versus distal slices (Table 1).
Figure 3.
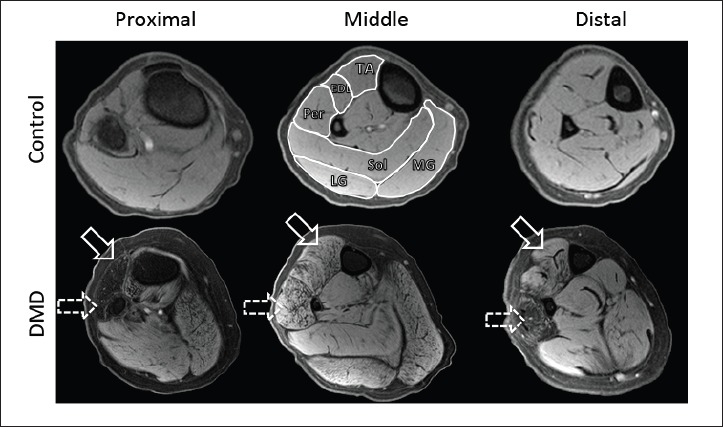
Representative transverse T1-weighted MR images with fat suppression of the lower leg of a control subject (top row) and subject with DMD (bottom row). MR imaging evaluation of the TA, EDL, Per, Sol, MG, and LG (labeled on the middle control image) was performed on all muscle groups in a manner described in Figure 2. Note the differences in the Per (dashed arrow) and TA (solid arrow) muscles at the proximal and distal compared to the middle slices in the DMD patient.
Figure 4.
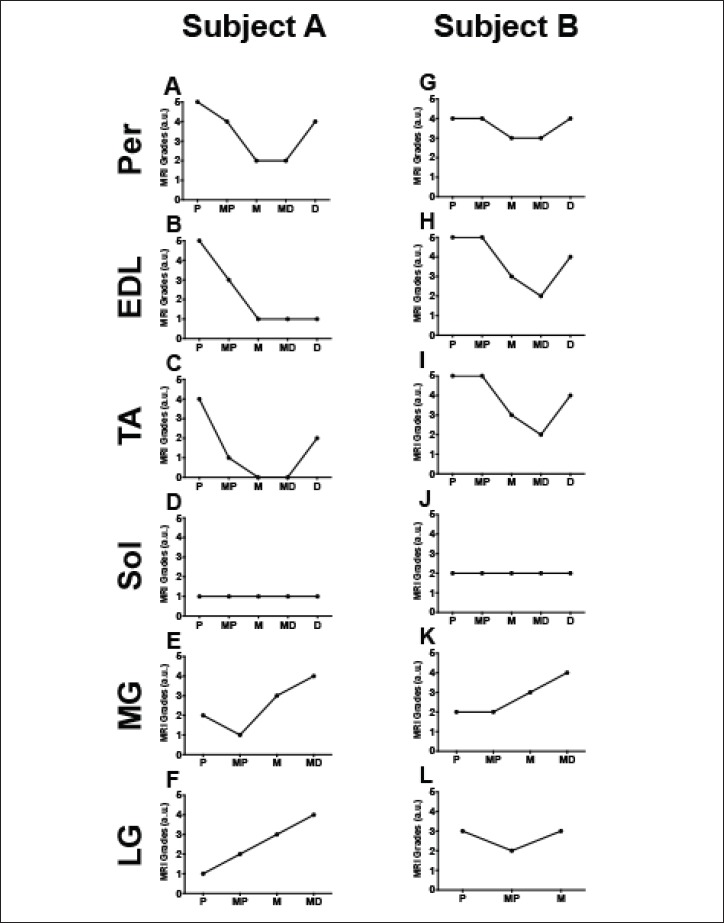
Ordinal MRI Scores from two representative DMD patients (A = 10.0 years, B = 10.7 years) demonstrating differences in involvement along the length of six lower leg muscle groups. X axes are labeled with P (proximal), MP (mid-proximal), M (middle), MD (mid-distal), and D (distal).
Figure 5.
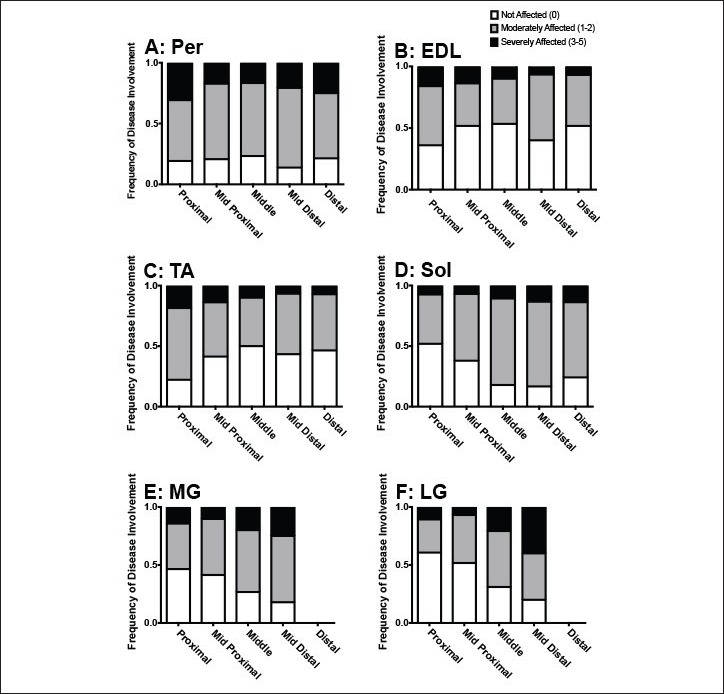
Frequency of involvement of six muscles in lower legs of boys with DMD. Shown are A: Peroneus, B: Extensor Digitorum Longus, C: Tibialis Anterior, D: Soleus, E: Medial Gastrocnemius, F: Lateral Gastrocnemius with differing MRI scores based on slice location. MRI scores of 0 were considered to be “not affected,” scores of 1 and 2 were considered to be “moderately affected,” and scores of 3-5 were considered to be “severely affected”.
Table 1.
Intramuscular heterogeneity statistical differences
| Proximal v. middle | Distal v. middle | |
|---|---|---|
| Per | p = 0.72, ns | p = 0.48, ns |
| EDL | p = 0.002** | p > 0.99, ns |
| TA | p = 0.0007*** | p = 0.43, ns |
| Sol | p = 0.004** | p = 0.25, ns |
| MG | p = 0.03* | N/A |
| LG | p < 0.0001**** | N/A |
Relationship between MRI scores, function and age
Additionally, a goal of this study was to see if a comprehensive multi-slice assessment could better correlate with clinical measures than single-slice analyses. Overall, the study subjects with DMD demonstrated comparable functional capability to patients of similar ages in other studies (33, 34). Specifically for our study, with increasing ages of subjects, normalized multi-slice MRI score concurrently increased (rho = 0.69, p < 0.0001), confirming that disease involvement within muscle increases as children age (Fig. 6A), whereas normalized single-slice MRI scores (Fig. 6C) did not correlate with the age of the subjects (rho = -0.23, p = 0.25). Additionally, functional status was measured by Vignos scoring [29] to assess if MRI grading may be related to functional capabilities. Increases in both normalized multi slice scores (p = 0.003, Fig. 6B) and normalized single-slice scores (p = 0.01, Fig. 6D) were observed with decreased functional status.
Figure 6.
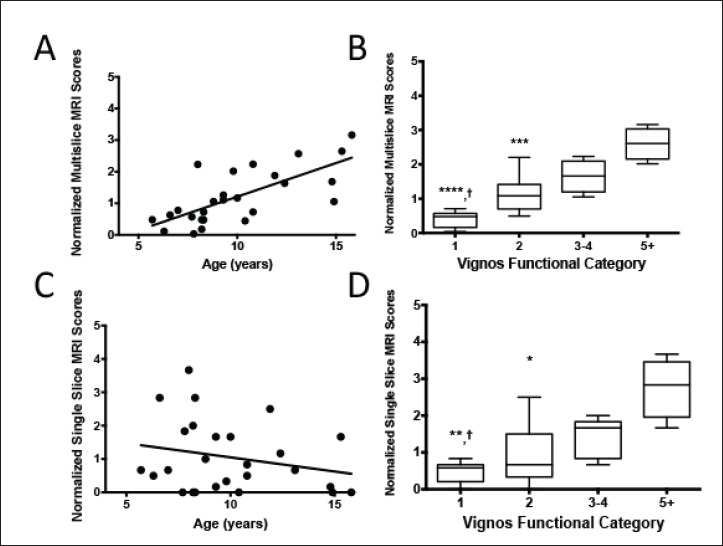
Age and function are compared to MRI scores. The sum of the scores of the multi-slice (Fig. 6a; rho = 0.69, p < 0.0001) and middle slices (Fig. 6c; rho = -0.23, p = 0.25) MRI scores are plotted correlated to the age of subjects. Figure 6b and 6d show the relationship between subjects binned by their Vignos score and the summative multi-slice and middle slice MRI scores, respectfully, by median and 25th and 75th percentiles. In Figures 6b and 6d, comparison to Vignos grade 5+ is indicated by asterisks where * indicates p < 0.5, ** indicates p < 0.01, **** indicates p < 0.0001, and comparison to Vignos grade 3-4 is indicated by daggers, where † indicates p < 0.05.
Discussion
The primary purpose of this work was to investigate intramuscular heterogeneity of disease involvement (fatty replacement) in the lower legs of 6-15 year old boys with DMD through a simple multi-slice MRI acquisition that can be performed on most clinical MRI scanners using an established muscle grading scale that can be easily utilized to assess heterogeneous disease involvement. Building upon developments of MRI as a feasible modality to investigate muscle pathology in DMD, continuing to understand the heterogeneous nature of DMD is critical to further advance our knowledge of this lethal disease (9-11, 13-15).
Through this investigation, we confirmed that a multi-slice MRI acquisition of subjects with DMD reveals differential disease involvement within muscles of the lower leg, most prominently at the myotendinous junction, as demonstrated by Hooijmans and colleagues (26). Next, we investigated the relationship between our multi-slice MRI findings to functional status and patients’ ages. Also, we provide evidence of heterogeneity of muscular involvement between DMD subjects of similar age that has not been, to our knowledge, explicitly reported yet.
Previously, Mercuri et al. developed an ordinal grading scheme for neuromuscular disorders (17), and adopted by several studies investigating disease progression in DMD (9, 10, 14, 15). Unique to our study was the use of a multi-slice acquisition along the lower leg, allowing for investigation of intramuscular differences in disease pathology. Hooijmans and colleagues similarly addressed geographic differences along the muscle length of DMD patients by assessing the lipid deposition using Dixon techniques to calculate fat fraction [26]. Through our investigation, we show that semi-quantitative assessment based on scoring of T1 weighted images allows for appreciation of differences between the myotendinous region versus midbelly of several muscles, highlighted specifically in the Per, as observed in Figure 3. A strength of the fat suppressed T1 weighted imaging implemented in this study is that it highlights fatty replacement changes of muscle secondary to DMD.
Our study also revealed that disease involvement is heterogeneous between DMD subjects of similar age as emphasized in Figure 4. Such non-uniformity of disease distribution within muscle(s) and between DMD patients emphasizes how critical the location of a biopsy or MR slice selections is for evaluation of disease progression. This is well illustrated in the two similarly aged DMD patients in Figure 4. Specifically, Figure 4 shows how contradicting the results of disease involvement could be when the entire muscle length is not used for assessment of disease extent as minimal disease is appreciated in the midbelly of Subject A’s TA, whereas advanced disease is noted at the myotendinous ends. This contrasts with advanced disease involvement in the midbelly of Subject B’s TA. This is of special importance when studying the pathophysiology and natural progression of DMD, as different regions of muscle have different rates of disease progression. As shown in Figure 4, assessment of single slices of muscle may lead to contradicting interpretations of disease progression. Taking into account the remainder of the subject population, a broad distribution of disease involvement was observed throughout the length of lower leg muscle (Fig. 5), with statistical confirmation seen in Table 1. Interestingly, the Per did not show significant differences between either the proximal versus middle, nor middle versus distal muscle slices. This may be attributed to the already advanced state of disease in the Per muscle, as previously reported. Additionally, the lack of a significant difference observed between the middle and distal slices may be due to the limited field of view, missing the distal myotendinous junctions. A general trend was detected in that an increase of disease pathology can be observed closer to the myotendinous junctions as also reported by Hooijmans et al. (26). These results highlight the differences of muscle pathology that individuals with DMD can present with.
The final analyses performed in this study were to see if the MRI scores generated could be related to standard clinical measures of disease progression. As individuals with DMD age, muscles continually accumulate insults of the disease, evident by the clinical progression of DMD (6, 10, 14, 35). While our normalized multi-slice score positively correlated with the age of subjects, normalized single-slice score at muscle midbelly did not, suggesting that a multi-slice assessment more accurately reflects clinical disease progression. Increases in the Vignos lower extremity scoring demonstrated progressive decline in functional ability that paralleled increasing MRI grading scores. There was however no difference in the correlation of the functional scores between normalized multi-slice and single-slice MRI scores in contrast with the age correlations. Effectively, this demonstrates that with increasing age and decreasing function, lower leg muscles of boys with DMD have increasingly progressive disease involvement, as previously reported by Polavarapu et al. (16).
The exact cause of the heterogeneous pattern of involvement observed in our study, both across different muscles and along the proximodistal direction of each muscle, is still unknown. However, a number of pre-clinical studies have explored mechanical and biological properties of muscles that may be linked to a possible vulnerability or predisposition to faster disease progression in the context of DMD. Though muscles are initially rendered susceptible to damage as a result of dystrophin lacking, further properties may influence the ability of tissue to succumb to the progression of the disease, including the biological composition of tissue (36, 37), the distribution of strain (38), the cross sectional area (39), speed and type of contractions (40), and other passive viscoelastic properties (41).
Differing amounts of eccentric contractions that muscles experience during gait have been shown to strongly correlate with lower limb fat fraction, a marker of disease progression (9, 42). In the mdx mouse, the stress relaxation rate of the EDL was found to be increased in mdx mice compared to healthy counterparts, and recoverable upon micro and mini dystrophin treatment, suggesting that dystrophic muscle itself has different passive properties than healthy muscle (43, 44). In other studies, strain measures of the gastrocnemii belly (20-30%) were found to be greater than those of the aponeurosis (1-5%) (38) and the tapered myotendinous junction experienced greater stress than the muscle belly (40). This suggests that different passive mechanical properties exist between different geographical segments of muscles, rendering the myotendinous junctions more vulnerable to the pathologic insult observed in DMD. Sun et al. elegantly demonstrated microfailure of the muscle-tendon unit using peroneus longus muscles of rabbits, suggesting that the weakest region of muscle is at the myotendinous junction, which may provide rationale for the observations made in our patient cohort and from the study by Hooijmans et al. (27, 40). Many of these pre-clinical experiments are not feasible in clinical subjects because of their invasive nature; therefore, extrapolation of pre-clinical findings to humans have to be made with caution.
Limitations and future directions
A primary limitation of this study is the lack of full geographic capture of muscle from tendon to tendon. This study is a subset of a larger study (RO1, AR0569373, PI: Vandenborne), and images were captured to meet the needs to the larger study. The ordinal grading scale utilized in this study, though previously demonstrated to be effective and able to collect data in a much more time sensitive manner, is not as quantitative as possible with other MRI techniques, such as the Dixon sequence, T2 mapping, or magnetic resonance spectroscopy (15, 16, 26, 45, 46). Because disease involvement of DMD muscle includes both T1 shortening fibrotic effects and T1 lengthening lipid effects on muscle, we employed T1 weighting with fat suppression techniques to address both fatty infiltration and fibrotic changes to muscle as previously demonstrated in muscular dystrophies, though fatty accumulation accounts for the majority of signal change (16, 31). Lastly, the Vignos score may be a non-optimal functional impairment scale and even though it is still used in the clinic, more sensitive instruments have been developed and validated for use in the DMD population (47, 48).
The localization of slices by distance in centimeters or inches is challenging in a pediatric population because of different leg lengths between participating subjects. Therefore, percentage length was selected in our study as it more appropriately accounts for differences in physical stature and age of subjects. Future studies looking at intra-muscular heterogeneity would greatly benefit from larger anatomical coverage of slice selection, anatomically based alignment of slices (e.g. insertions of various tendons) and investigating differences in composition throughout muscle. In addition, the low number of control subjects in our study could be considered a limitation; however, several studies have identified that unaffected healthy male subjects do not demonstrate substantial fatty muscle replacement, deviating the need for higher numbers of control subjects (35, 46, 49, 50).
Further studies are warranted in other neuromuscular disorders to see if other diseases demonstrate unique intra-muscular heterogeneity, as observed in DMD in this study. In addition, further investigation of the different genetic types of DMD as well as longitudinal studies are necessary to determine if unique patterns of disease involvement in the different DMD subtypes exist and what pattern of progression of involvement occurs over time. Expansion of the MRI studies to the other parts of the body might also be beneficial to better understand which muscle parts are affected when and to what extent. For better understanding of the pathophysiology of DMD disease, it would be also interesting to evaluate the degree of fatty infiltration versus fibrotic changes and how they relate to each other in the different stages of the disease, patient age and functional status.
Conclusions
In this investigation, we utilized a modified version of the previously established ordinal Mercuri scale using multi-slice fat-saturated T1 weighting MR imaging to evaluate the pathology of lower leg muscles of boys with DMD. Overall, we demonstrate that a multi-slice composite score may provide a more comprehensive characterization of disease severity along the length of dystrophic muscle. Specifically, there were four major conclusions from this study: (i) the six individual muscles of the lower leg were not affected equally by the disease; (ii) there was more muscle involvement at the myotendinous junctions rather than the midbelly of muscle; (iii) differential disease involvement was found between subjects of similar age; and (iv) MRI mutlislice scores are related to age and functional ability. In summary, our results show a unique distribution of involvement both inter- and intra- muscularly in the lower legs of boys with DMD. Knowledge of such geographic differences is critical for assessing the natural progression and elucidating the pathophysiology of DMD. Caution may be warranted when using single- slice acquisitions, as they may not appropriately represent overall disease status in individuals with DMD as outlined above.
Acknowledgements
This study was supported in part by the following organizations: Muscular Dystrophy Association (MDA4170), and Parent Project Muscular Dystrophy (PPMD8509), and was supported by NIH (R01 AR056973) as a subset of the larger ImagingDMD study. We thank William Triplett and Kami Veltri for assistance with imaging evaluation and Tammy Nicholson for operation of the clinical scanner.
References
- 1.Hoffman EP, Brown RH, Jr., Kunkel LM. Dystrophin: the protein product of the Duchenne muscular dystrophy locus. Cell 1987;51:919-28. [DOI] [PubMed] [Google Scholar]
- 2.Mah JK, Korngut L, Dykeman J, et al. A systematic review and meta-analysis on the epidemiology of Duchenne and Becker muscular dystrophy. Neuromuscul Disord 2014;24:482-91. [DOI] [PubMed] [Google Scholar]
- 3.McDouall RM, Dunn MJ, Dubowitz V. Nature of the mononuclear infiltrate and the mechanism of muscle damage in juvenile dermatomyositis and Duchenne muscular dystrophy. J Neurol Sci 1990;99:199-217. [DOI] [PubMed] [Google Scholar]
- 4.Bongers H, Schick F, Skalej M, et al. Localized in vivo 1H spectroscopy of human skeletal muscle: normal and pathologic findings. Magn Reson Imaging 1992;10,:957-64. [DOI] [PubMed] [Google Scholar]
- 5.Kharraz Y, Guerra J, Pessina P, et al. Understanding the process of fibrosis in Duchenne muscular dystrophy. Bio Med Res Int 2014;2014:e965631. [DOI] [PMC free article] [PubMed] [Google Scholar]
- 6.Bushby K, Finkel R, Birnkrant DJ, et al. Diagnosis and management of Duchenne muscular dystrophy, part 1: diagnosis, and pharmacological and psychosocial management. Lancet Neurol 2010;9:77-93. [DOI] [PubMed] [Google Scholar]
- 7.Bushby K, Finkel R, Birnkrant DJ, et al. Diagnosis and management of Duchenne muscular dystrophy, part 2: implementation of multidisciplinary care. Lancet Neurol 2010;9:177-89. [DOI] [PubMed] [Google Scholar]
- 8.Flanigan KM. Duchenne and Becker muscular dystrophies. Neurol Clin 2014;32:671-88. [DOI] [PubMed] [Google Scholar]
- 9.Baudin PY, Marty B, Robert B, et al. Qualitative and quantitative evaluation of skeletal muscle fatty degenerative changes using whole-body Dixon nuclear magnetic resonance imaging for an important reduction of the acquisition time. Neuromuscul Disord 2015;25:758-63. [DOI] [PubMed] [Google Scholar]
- 10.Kinali M, Arechavala-Gomeza V, Cirak S, et al. Muscle histology vs MRI in Duchenne muscular dystrophy,” Neurology 2011;76:346-53. [DOI] [PMC free article] [PubMed] [Google Scholar]
- 11.Liu GC, Jong YJ, Chiang CH, et al. Duchenne muscular dystrophy: MR grading system with functional correlation. Radiology 1993;186:475-80. [DOI] [PubMed] [Google Scholar]
- 12.Mercuri E, Pichiecchio A, Allsop J, et al. Muscle MRI in inherited neuromuscular disorders: past, present, and future. J Magn ResonImaging JMRI 2007;25:433-40. [DOI] [PubMed] [Google Scholar]
- 13.Schreiber A, Smith WL, Ionasescu V, et al. Magnetic resonance imaging of children with Duchenne muscular dystrophy. Pediatr Radiol 1987;17:495-7. [DOI] [PubMed] [Google Scholar]
- 14.Torriani M, Townsend E, Thomas BJ, et al. Lower leg muscle involvement in Duchenne muscular dystrophy: an MR imaging and spectroscopy study. Skeletal Radiol 2012;41:437-45. [DOI] [PMC free article] [PubMed] [Google Scholar]
- 15.Wokke BH, Bos C, Reijnierse M, et al. Comparison of dixon and T1-weighted MR methods to assess the degree of fat infiltration in duchenne muscular dystrophy patients. J Magn Reson Imaging 2013;38:619-24. [DOI] [PubMed] [Google Scholar]
- 16.Polavarapu K, Manjunath M, Preethish-Kumar V, et al. Muscle MRI in Duchenne muscular dystrophy: Evidence of a distinctive pattern. Neuromuscul Disord NMD 2016;26:768-74. [DOI] [PubMed] [Google Scholar]
- 17.Mercuri E, Talim B, Moghadaszadeh B, et al. Clinical and imaging findings in six cases of congenital muscular dystrophy with rigid spine syndrome linked to chromosome 1p (RSMD1). Neuromuscul Disord 2002;12:631-8. [DOI] [PubMed] [Google Scholar]
- 18.Sarkozy A, Deschauer M, Carlier RY, et al. Muscle MRI findings in limb girdle muscular dystrophy type 2L. Neuromuscul Disord NMD 2012;22(Suppl 2):S122-129. [DOI] [PubMed] [Google Scholar]
- 19.Stramare R, Beltrame V, Dal Borgo R, et al. MRI in the assessment of muscular pathology: a comparison between limb-girdle muscular dystrophies, hyaline body myopathies and myotonic dystrophies. Radiol Med (Torino) 2010;115:585-99. [DOI] [PubMed] [Google Scholar]
- 20.Willis TA, Hollingsworth KG, Coombs A, et al. Quantitative magnetic resonance imaging in limb-girdle muscular dystrophy 2I: a multinational cross-sectional study. PloS One 2014;9:e90377. [DOI] [PMC free article] [PubMed] [Google Scholar]
- 21.Janssen BH, Voet NB, Nabuurs CI, et al. Distinct disease phases in muscles of facioscapulohumeral dystrophy patients identified by MR detected fat infiltration. PLoS ONE, 2014;9:e85416. [DOI] [PMC free article] [PubMed] [Google Scholar]
- 22.Leung DG, Carrino JA, Wagner KR, et al. Whole-body magnetic resonance imaging evaluation of facioscapulohumeral muscular dystrophy. Muscle Nerve 2015;52,:512-20. [DOI] [PMC free article] [PubMed] [Google Scholar]
- 23.Tasca G, Monforte M, Ottaviani P, et al. Magnetic resonance imaging in a large cohort of facioscapulohumeral muscular dystrophy patients: Pattern refinement and implications for clinical trials. Ann Neurol 2016;79:854-64. [DOI] [PubMed] [Google Scholar]
- 24.Fischmann A, Hafner P, Fasler S, et al. Quantitative MRI can detect subclinical disease progression in muscular dystrophy. J Neurol 2012;259:1648-54. [DOI] [PubMed] [Google Scholar]
- 25.Mahjneh I, Bashir R, Kiuru-Enari S, et al. Selective pattern of muscle involvement seen in distal muscular dystrophy associated with anoctamin 5 mutations: a follow-up muscle MRI study. Neuromuscul Disord NMD 2012;22 (Suppl 2):S130-136. [DOI] [PubMed] [Google Scholar]
- 26.Hooijmans MT, Niks EH, Burakiewicz J, et al. Non-uniform muscle fat replacement along the proximodistal axis in Duchenne muscular dystrophy. Neuromuscul Disord NMD 2017;27458-64. [DOI] [PubMed] [Google Scholar]
- 27.Fischer D, Kley RA, Strach K, et al. Distinct muscle imaging patterns in myofibrillar myopathies. Neurology 2008;71:758-65. [DOI] [PMC free article] [PubMed] [Google Scholar]
- 28.Vidt ME, Santago AC, 2nd, Tuohy CJ, et al. Assessments of fatty infiltration and muscle atrophy from a single magnetic resonance image slice are not predictive of 3-dimensional measurements. Arthroscopy 2016;32:128-39. [DOI] [PMC free article] [PubMed] [Google Scholar]
- 29.Lue Y-J, Lin R-F, Chen S-S, et al. Measurement of the functional status of patients with different types of muscular dystrophy. Kaohsiung J Med Sci 2009;25:325-33. [DOI] [PubMed] [Google Scholar]
- 30.Fischer D, Kley RA, Strach K, et al. Distinct muscle imaging patterns in myofibrillar myopathies. Neurology 2008;71:758-65. [DOI] [PMC free article] [PubMed] [Google Scholar]
- 31.Leung DG, Carrino JA, Wagner KR, et al. Whole-body magnetic resonance imaging evaluation of facioscapulohumeral muscular dystrophy. Muscle Nerve 2015;52:512-20. [DOI] [PMC free article] [PubMed] [Google Scholar]
- 32.Mahjneh I, Bashir R, Kiuru-Enari S, et al. Selective pattern of muscle involvement seen in distal muscular dystrophy associated with anoctamin 5 mutations: a follow-up muscle MRI study. Neuromuscul Disord NMD 2012;22(Suppl 2)S130-136. [DOI] [PubMed] [Google Scholar]
- 33.Akima H, Lott D, Senesac C, et al. Relationships of thigh muscle contractile and non-contractile tissue with function, strength, and age in boys with Duchenne muscular dystrophy. Neuromuscul Disord NMD 2012;22:16-25. [DOI] [PMC free article] [PubMed] [Google Scholar]
- 34.Henricson EK, Abresch RT, Cnaan A, et al. The cooperative international neuromuscular research group Duchenne natural history study: glucocorticoid treatment preserves clinically meaningful functional milestones and reduces rate of disease progression as measured by manual muscle testing and other commonly used clinical trial outcome measures. Muscle Nerve 2013;48:55-67. [DOI] [PMC free article] [PubMed] [Google Scholar]
- 35.Willcocks RJ, Arpan IA, Forbes SC, et al. Longitudinal measurements of MRI-T2 in boys with Duchenne muscular dystrophy: effects of age and disease progression. Neuromuscul Disord 2014;24:393-401. [DOI] [PMC free article] [PubMed] [Google Scholar]
- 36.Babic J, Lenarcic J. In vivo determination of triceps surae muscle–tendon complex viscoelastic properties. Eur J Appl Physiol 2004;92:477-84. [DOI] [PubMed] [Google Scholar]
- 37.Suydam SM, Soulas EM, Elliott DM, et al. Viscoelastic properties of healthy achilles tendon are independent of isometric plantar flexion strength and cross-sectional area. J Orthop Res 2015;33:926-31. [DOI] [PMC free article] [PubMed] [Google Scholar]
- 38.van Bavel H, Drost MR, Wielders JDL, et al. Strain distribution on rat medial gastrocnemius (MG) during passive stretch. J Biomech, 1996;29:106974. [DOI] [PubMed] [Google Scholar]
- 39.Sun JS, Tsaung YH, Hou SM, et al. Microfailure of peroneus longus muscle during passive extension. Proc Natl Sci Counc Repub China B 1994;18:24-9. [PubMed] [Google Scholar]
- 40.Sharafi B, Ames EG, Holmes JW, et al. Strains at the myotendinous junction predicted by a micromechanical model. J Biomech 2011;44,:2795-801. [DOI] [PMC free article] [PubMed] [Google Scholar]
- 41.Pasternak C, Wong S, Elson EL. Mechanical function of dystrophin in muscle cells. J Cell Biol 1995;128:355-61. [DOI] [PMC free article] [PubMed] [Google Scholar]
- 42.Hu X, Blemker SS. Musculoskeletal simulation can help explain selective muscle degeneration in duchenne muscular dystrophy. Muscle Nerve 2015;52:174-82. [DOI] [PubMed] [Google Scholar]
- 43.Hakim CH, Duan D. A marginal level of dystrophin partially ameliorates hindlimb muscle passive mechanical properties in dystrophin-null mice. Muscle Nerve 2012;46:948-50. [DOI] [PMC free article] [PubMed] [Google Scholar]
- 44.Hakim CH, Duan D. Truncated dystrophins reduce muscle stiffness in the extensor digitorum longus muscle of mdx mice. J Appl Physiol Bethesda Md 1985;114:482-9. [DOI] [PMC free article] [PubMed] [Google Scholar]
- 45.Triplett WT, Baligand C, Forbes SC, et al. Chemical shift-based MRI to measure fat fractions in dystrophic skeletal muscle. Magn Reson Med 2014;72:8-19. [DOI] [PMC free article] [PubMed] [Google Scholar]
- 46.Forbes SC, Walter GA, Rooney WD, et al. Skeletal muscles of ambulant children with Duchenne muscular dystrophy: validation of multicenter study of evaluation with MR imaging and MR spectroscopy. Radiology 2013;269:198-207. [DOI] [PMC free article] [PubMed] [Google Scholar]
- 47.Ricotti V, Ridout DA, Pane M, et al. The NorthStar Ambulatory Assessment in Duchenne muscular dystrophy: considerations for the design of clinical trials. J Neurol Neurosurg Psychiatry 2016;87:149-55. [DOI] [PMC free article] [PubMed] [Google Scholar]
- 48.Pane M, Mazzone ES, Sivo S, et al. Long term natural history data in ambulant boys with Duchenne muscular dystrophy: 36-month changes. PloS One 2014;9:e108205. [DOI] [PMC free article] [PubMed] [Google Scholar]
- 49.Torriani M, Townsend E, Thomas BJ, et al. Lower leg muscle involvement in Duchenne muscular dystrophy: an MR imaging and spectroscopy study. Skeletal Radiol 2012;41:437-45. [DOI] [PMC free article] [PubMed] [Google Scholar]
- 50.Wokke BH, Bos C, Reijnierse M, et al. Comparison of dixon and T1-weighted MR methods to assess the degree of fat infiltration in duchenne muscular dystrophy patients. J Magn Reson Imaging 2013;38:619-24. [DOI] [PubMed] [Google Scholar]


