Abstract.
Severe floods increase the risk of leptospirosis outbreaks in endemic areas. This study determines the spatial-temporal distribution of leptospirosis in relation to environmental factors after a major flooding event in Kelantan, Malaysia. We conducted an observational ecological study involving incident leptospirosis cases, from the 3 months before, during, and three months after flood, in reference to the severe 2014 Kelantan flooding event. Geographical information system was used to determine the spatial distribution while climatic factors that influenced the cases were also analyzed. A total of 1,229 leptospirosis cases were notified within the three study periods where incidence doubled in the postflood period. Twelve of 66 subdistricts recorded incidence rates of over 100 per 100,000 population in the postflood period, in comparison with only four subdistricts in the preflooding period. Average nearest neighborhood analysis indicated that the cases were more clustered in the postflood period as compared with the preflood period, with observed mean distance of 1,139 meters and 1,666 meters, respectively (both at P < 0.01). Global Moran’s I was higher in the postflood period (0.19; P < 0.01) as compared with the preflood period (0.06; P < 0.01). Geographic weighted regression showed that living close to water bodies increased the risk of contracting the disease. Postflooding hotspots were concentrated in areas where garbage cleanup occurred and the incidence was significantly associated with temperature, humidity, rainfall, and river levels. Postflooding leptospirosis outbreak was associated with several factors. Understanding the spatial distribution and associated factors of leptospirosis can help improve future disease outbreak management after the floods.
INTRODUCTION
Toward the end of December 2014, a long period of heavy and continuous rainfall that hit the eastern states of Peninsular Malaysia led to flooding in that area. States such as Pahang, Terengganu, and Kelantan were badly affected by this flood but the state of Kelantan in particular suffered the worst flood in the state’s history as confirmed by the Malaysian National Security Council.1 The flood caused countless loss and damage in terms of public and private property, human livelihood, and health in general. One of the main adverse health outcomes that affected the involved population was the rise in the incidence of infectious diseases and a specific disease that notably increased after flooding was leptospirosis.
Leptospirosis is caused by the spiral-shaped bacteria from the genus Leptospira and endemic in many tropical and subtropical countries including Malaysia. Epidemics and outbreaks have occurred after extreme weather events especially flooding. The most common method of transmission is exposure to water contaminated with urine from carrier animals, such as cattles, pigs, dogs, and rodents, particularly rats.2 Symptoms of leptospirosis infection range from asymptomatic to severe life threatening conditions, including multiorgan failure and death. It is one of the frequently underreported diseases due to the nature of its symptoms which mimic many other tropical diseases, and the diagnosis usually depend on laboratory tests which are not readily available in all parts of the world.
Worldwide, the incidence of leptospirosis is recorded at around 0.1 to 100 per 100,000 population. Epidemics occur with incidence of over 100 per 100,000 especially in rainy seasons and flooding.3 Changes in the environment after flooding cause increased interactions between human and carrier animals and permit favorable conditions for the thriving bacteria.4 In Malaysia, leptospirosis is endemic in certain states. The incidence of leptospirosis according to states varies throughout the years, and the trend shows a progressive increase from 1.3 to 25.9 cases per 100,000 population.5 The eastern state of Kelantan has recorded the highest incidence of leptospirosis by July 2015 mainly after the effect of flooding that occurred in December 2014.
There are many different risk factors that increase the likelihood of one infected by the disease and it is somewhat related to different types of exposures to the microorganism. The importance of identifying postdisaster sequential effects, such as leptospirosis outbreaks, is an important component in the United Nations (UN) Sendai Framework for Disaster Risk Reduction 2015–2030.6 Health practitioners should understand the vulnerability, capacity, exposure of assets and persons, hazard characteristics, and the environment that favors leptospirosis outbreaks after flooding.
The use of geographic information system (GIS) in determining the pattern and distribution of communicable diseases has increased recently because of its strength in visualizing and analyzing epidemiological data and surveillance of communicable diseases.7 The purpose of this study is to look into the spatial-temporal distribution as well as clustering and vulnerability analysis of leptospirosis incidence and outbreak in relation to environmental factors after the major flooding in Kelantan.
METHODS
Data collection.
An observational ecological study was conducted using data from e-notification of leptospirosis cases obtained from the Kelantan State Health Department. The study period involved was 3 months before (September 17, 2014 to December 16, 2014), during (December 17, 2014 to January 8, 2015), and three months after (January 9, 2015 to April 9, 2015) the flood that occurred in Kelantan state.
A total of 1,229 cases which met the probable and confirmed cases standard case definition in Malaysia8 were included in the analysis. For this study, the probable case was defined as a clinical case, and positive enzyme-linked immunosorbent assay/other rapid tests and the confirmed case was defined as a case with single serum specimen - titer ≥ 1:400, for paired sera - 4-fold or greater rise in titer microscopic agglutination test.8
Financial support was granted by the fundamental research grant scheme (FRGS) from the Ministry of Higher Education Malaysia, and ethical approval was obtained from the Research and Ethics Committee of Faculty of Medicine Universiti Kebangsaan Malaysia (UKM) (FRGS/1/2015/SKK07/UKM/02/3) and Medical Research and Ethics Committee, Ministry of Health Malaysia. Permission was obtained from the Director of Kelantan State Health Department to retrieve data from the e-notification system.
Study area and population.
This study was conducted in Kelantan, a state in the north east of Peninsular Malaysia. This state covers an area of about 15,000 km2 and comprises of 10 districts. Malays make the main ethnic group of about 94% from approximately 1.5 million population from the latest census, followed by other ethnic groups such as Chinese, Indian, Orang Asli (indigenous tribes), and others. The Kelantan River Basin per se covers an area of about 85% of the state with the main Kelantan River and its tributaries which includes the Lebir, Galas, and Pergau rivers. During the end of 2014 flooding, vast areas within this river basin system were severely affected, and because of the extensive widespread of the flooding, all incident cases in all districts of Kelantan during the three different flood periods were studied.
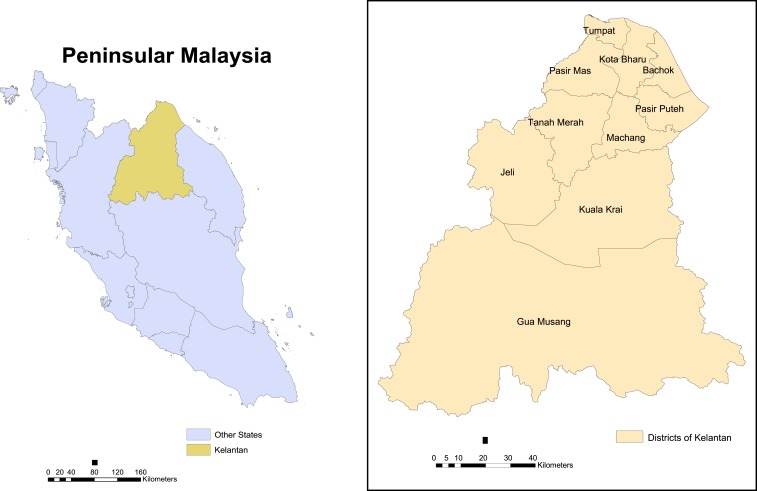
All data were analyzed using the SPSS version 20.0 (IBM Corp., Armonk, NY). Mean and standard deviation were used to describe the characteristics of the cases for continuous data, whereas percentage was used for categorical data. The level of significance was set at P value < 0.05. Temporal patterns were investigated according to epidemiological curves of epidemiological weeks over the preflood period, during flood period, and postflood period (Figure 1).
Figure 1.
The Malaysian state of Kelantan. This figure appears in color at www.ajtmh.org.
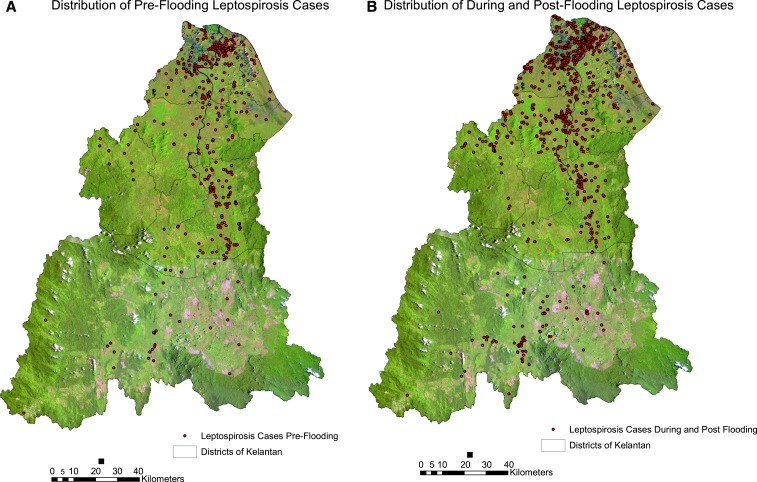
Health inspectors from the nearest district health offices were assigned to investigate each leptospirosis cases that occurred in their designated areas as part of disease surveillance and contact tracing measures. They would then geolocalize all cases by using calibrated hand-held global positioning system (GPS) devices namely Garmin GPSmap 60 CSx and GPS72H (Garmin Ltd, Olathe, KA). Coordinates obtained from each case were recorded in the Kertau (RSO) Malaya coordinates system format (OGP, Rochester, NY), which were then used for the ArcGIS analysis. All coordinated individual cases are shown in Figure 2. Data on flooded areas and water levels were obtained from the Malaysian Department of Irrigation and Drainage. Satellite imagery during the peak of flooding was not used because satellite images received from Radarsat (a Canadian commercial Earth observation satellite) through the dedicated public remote sensing agency was not complete for the whole of study area and was only available for a small part of northern Kelantan. A total of four functional and complete water level gauge stations readings were obtained and used for this study which covers the Kelantan River Basin area namely Lebir River at Tualang Village, Kelantan River at Kuala Krai, Kelantan River at Kota Bharu Custom Jetty, and Kelantan River at Kusial Guillemard Bridge.9 The water stations at Galas River at Dabong and Nenggiri River at Bertam Bridge were not included in this study because of incomplete data.
Figure 2.
Distribution of leptospirosis cases. (A) Distribution 3 months before flooding. (B) Distribution during and 3 months after flooding. This figure appears in color at www.ajtmh.org.
Environmental data including maximum and minimum daily temperatures, relative humidity, and rainfall from five gauge stations around Kelantan were obtained from the Malaysian Meteorological Department. Weekly average mean temperatures, humidity, and rainfall were then calculated from this daily climate database and used for analysis. Missing value analysis was performed using the SPSS on minimal parameters stated previously when appropriate, and the overall missing value did not exceed the permissible number. Maps of Kelantan state, districts, and river system were obtained from the Malaysian Department of Survey and Mapping. Data and maps on land use and population density census of subdistricts were obtained from the Malaysian Town and Regional Planning Department. The documented locations of garbage cleanup sites were obtained from the state authority governing solid waste management. A total of 66 subdistricts and 10 districts were involved in this study.
Spatial analysis.
All leptospirosis cases were mapped and analyzed using the software ArcGIS 10.2 (Environmental Systems Research Institute, Redlands, CA). Clustering analysis was performed using Average Nearest Neighborhood (ANN) and spatial autocorrelation using Global Moran’s I. Local Indicators of Spatial Association were then used to identify the area of clusters.10 Optimized hotspot analysis as well as Kernel Density analysis were then used to determine the hotspot areas of leptospirosis cases all over Kelantan. An additional geographical weighted regression (GWR) was performed to look for relationships between the incidence of leptospirosis cases and distance to water bodies. Buffer zones were created around the river and water bodies wherein the cases occurring within the mean distance of 2,000 meters to the nearest river and water bodies were analyzed in the GWR analysis indicating the cases which occurred in the nearest proximity to the water bodies. Rodents have been shown to travel within distances of 1–2 km from point sources.11 This analysis was carried out after performing ordinary least square (OLS) analysis to ascertain the suitable regression diagnostics.12 Leptospirosis was assumed to occur more commonly among people who were exposed to flood waters and those living near water bodies and fresh water supplies.4
Incidence rate of cases was analyzed from the census data of population density based on subdistricts, and the incidence rate was calculated as total leptospirosis cases per total population of subdistrict census times 100,000 population. Crude incidence rates were used to visualize subdistricts more affected during different periods of time. To investigate the periodic differences, we have categorized the disease data into three categories, i.e., 3 months preflood period (September 17, 2014 to December 16, 2014), during flood period (December 17, 2014 to January 8, 2015), and three months after flood period (January 9, 2015 to April 9, 2015). An additional category was added, which combines during flood and postflood periods that were used for the analysis of populations exposed to flood water. The incidence rate was categorized arbitrarily into four different categories per 100,000 population; three categories of below 100 and one category of and over 100 cases. Leptospirosis incidence may reach over 100 cases per 100,000 population during outbreaks in endemic areas and in high-risk groups (e.g., survivors of natural disasters such as flooding).3
Climatic and meteorological relationship.
In determining the relationship between meteorological parameters and the incidence of leptospirosis cases, a Poisson generalized linear regression model was used.13 Disease counts were modeled into the Poisson generalized linear model (GLM) initially but we noted that overdispersion was exceptionally high (with a variance larger than the mean) rendering a more suitable analysis using a negative binomial regression model.14–16 The final negative binomial regression model yielded an equation similar to that of Poisson regression. The log outcome is predicted with a linear combination of the independent predictors and because we calculated weekly parameters, the final model took the following form:
The same analysis was also used to determine the relationship between incidence and distance to garbage accumulation and cleanup sites.
RESULTS
Tables 1 and 2 show the distribution of the 1,229 leptospirosis cases which were included throughout the preflood period, during flood period, and postflood period. A total of 29.0%, 12.0%, and 59.0% cases occurred during preflood, during flood, and postflood, respectively. The mean age of the cases was 31.66 (19.96) years, whereas the median age of the cases was 28, and this is comparable with the median Kelantan population age of 23.1 (based on the Kelantan population census of 2010). Although most the cases were in the age group of 15–29 (about one third of all cases), the age group of 60–74 had the highest age-specific incidence rate with 112.9 per 100,000 population of that age-group. The age-specific incidence rates for the age-groups 15–29 and 45–59 were almost similar which were 90.3 and 90.1 per 100,000 population of that group, respectively. Almost 60% of the cases were males and most were Malaysians and of the Malay race group. However, it was worth noting that despite most cases being Malaysian Malays, the incidence rates for Non-Malaysians were higher (144.7 versus 78.4 per 100,000 population) and other races (apart from the Malays, Chinese, Indians, and indigenous people) were higher as compared with Malays (119.7 as compared with 79.7 per 100,000 population). A total of 60% were from the unemployed/homemaker occupation category (Table 1). From the Table, reduced number of cases in some variables were noted as data on their race and occupation were not complete. There were seven deaths (0.56% of all cases) throughout the study period with 57.1% happened after flood. However, case fatality rates were almost similar for each of the periods; 0.56% in the preflood period, 0.68% during flood period, and 0.55% postflood period.
Table 1.
Characteristics of the leptospirosis cases (N = 1,229)
| Factors | n (%) | Kelantan population census 2010 | Incidence rate per 100,000 |
|---|---|---|---|
| Age (years) | |||
| Mean(± SD) | 31.66 (± 19.96) | 23.1 | |
| Median | 28.0 | – | |
| 0–14 | 275 (22.4) | 497,464 | 55.3 |
| 15–29 | 380 (30.9) | 420,647 | 90.3 |
| 30–44 | 228 (18.6) | 261,244 | 87.3 |
| 45–59 | 202 (16.4) | 224,311 | 90.1 |
| 60–74 | 120 (9.8) | 106,276 | 112.9 |
| ≥ 75 | 24 (2.0) | 29,659 | 80.9 |
| Gender | |||
| Male | 711 (57.9) | 773,698 | 91.9 |
| Female | 518 (42.1) | 765,903 | 67.6 |
| Citizenship | |||
| Malaysian | 1,182 (96.2) | 1,507,129 | 78.4 |
| Non Malaysian* | 47 (3.8) | 32,472 | 144.7 |
| Race (N = 1,182) | |||
| Malay | 1,137 (96.2) | 1,426,373 | 79.7 |
| Chinese | 23 (1.9) | 51,614 | 44.6 |
| Indian | 2 (0.2) | 3,849 | 52.0 |
| Orang Asli (Indigenous) | 9 (0.8) | 16,105 | 55.9 |
| Others | 11 (0.9) | 9,188 | 119.7 |
| Occupation (N = 1,128) | |||
| Public sector | 76 (6.2) | – | – |
| Private sector | 18 (10.4) | – | – |
| Self-used | 323 (26.3) | – | – |
| Unemployed/Homemaker | 701 (57.1) | – | – |
| Cases according to flood period | |||
| Pre | 357 (29.0) | – | – |
| During | 147 (12.0) | – | – |
| Post | 725 (59.0) | – | – |
| Death (N = 7) | |||
| Pre | 2 (28.6) | – | – |
| During | 1 (14.3) | – | – |
| Post | 4 (57.1) | – | – |
SD = standard deviation.
Non Malaysian: Indonesian(17), Thailand(10), Nepal(7), Bangladesh(6), Myanmar(4), Cambodia, India, Pakistan(1).
Table 2.
Sociodemographic factors associated with leptospirosis cases across the flood periods
| Leptospirosis cases according to the flood period | |||||
|---|---|---|---|---|---|
| Factors | Pre | During | Post | χ2 (df) | P value |
| n (%) | n (%) | n (%) | |||
| Age (years) | |||||
| 0–14 | 69 (19.3) | 27 (18.4) | 79 (24.7) | 13.04 (10)* | 0.221 |
| 15–29 | 113 (31.7) | 55 (37.4) | 212 (29.2) | – | – |
| 30–44 | 67 (18.8) | 30 (20.4) | 131 (18.1) | – | – |
| 45–59 | 71 (19.9) | 20 (13.6) | 111 (15.3) | – | – |
| 60–74 | 32 (9.0) | 12 (8.2) | 76 (10.5) | – | – |
| ≥ 75 | 5 (1.4) | 3 (2.0) | 16 (2.2) | – | – |
| Gender | |||||
| Male | 219 (61.3) | 99 (67.3) | 390 (53.8) | 12.07 (2) | 0.002† |
| Female | 138 (38.7) | 48 (32.7) | 335 (46.2) | – | – |
| Race (N = 1,182) | |||||
| Non Malay | 14 (4.2) | 4 (2.9) | 27 (3.8) | 0.46 (2) | 0.793 |
| Malay | 322 (95.8) | 136 (97.1) | 67 (96.2)9 | – | – |
| Occupation | |||||
| Public sector | 20 (5.6) | 12 (8.2) | 44 (6.1) | 14.78 (6) | 0.022† |
| Private sector | 34 (9.5) | 18 (12.2) | 76 (10.5) | – | – |
| Self-used | 111 (31.1) | 47 (32.0) | 165 (22.8) | – | – |
| Unemployed/Home maker | 192 (53.8) | 70 (47.6) | 439 (60.6) | – | – |
χ2 test with Yates correction.
P value < 0.05.
Table 2 indicates the sociodemographic factors associated with these cases. There was statistically significant association between gender and occupation with leptospirosis cases according to the flood period. Being male and unemployed/homemaker contributed to these significant associations.
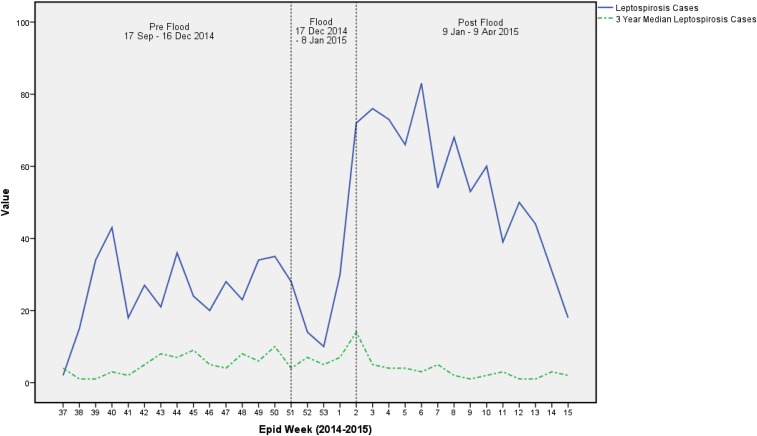
Figure 3 shows that there was a decrease in cases in the first week followed by a sharp rise in cases in the last 2 weeks of the flood period. The increased number of cases during this period extremely surpassed the number of cases that usually occurred during the preflood period. This can be seen when comparing the incidence of cases to the 3-year median of leptospirosis cases during the same period as outlined in green. The trend of incidence during the study period also shows that the incidence of leptospirosis cases during the study period exceeded the numbers of cases usually occurring in the same period for 3 years before the flooding. The number of cases gradually declined throughout the 3 months after the flooding period till they reached almost the number of cases during the preflood period.
Figure 3.
Trend of leptospirosis cases during the study period. This figure appears in color at www.ajtmh.org.
Spatial pattern and trend.
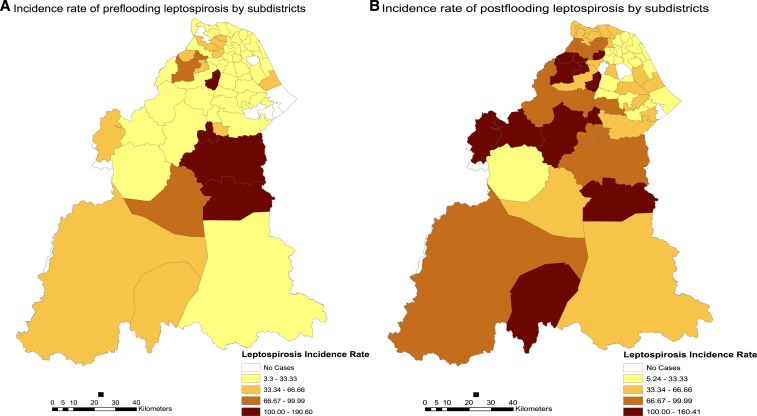
As this study involved different periods before and after an episode of widespread flooding, we were able to observe differences in terms of pattern and trend of leptospirosis incidence. Spatial variation in leptospirosis occurrence can be seen in the following figure of incidence map in the different periods throughout the flooding.
Before flooding, leptospirosis is endemic in many different subdistricts all over Kelantan with the highest incidence in Olak Jeram (Kuala Krai district) with an incidence rate of 190.6. Figure 4 below shows the spatial differences and changes in incidence rates between the preflood period as compared with the postflood period. Generally, the incidence of cases rose and more subdistricts recorded higher incidence rates after flooding. It also indicates that the incidence of leptospirosis was more widespread involving more subdistricts which before the flooding recorded no cases.
Figure 4.
Spatial difference in the incidence of leptospirosis cases per 100,000 population. (A) Incidence map 3 months before the flood. (B) Incidence of leptospirosis 3 months postflooding. This figure appears in color at www.ajtmh.org.
Table 3 shows the 10 subdistricts and their respective districts mostly affected with leptospirosis before and after the flooding. There was a huge increase in the number of incidence among those who were exposed with flood waters after the disaster. A total of 12 out of 66 subdistricts recorded incidence rates of over 100 per 100,000 population in the postflood period, in comparison to only four subdistricts in the preflood period. Subdistricts within the district of Pasir Mas showed the highest incidence of leptospirosis cases after exposure to flood waters with five subdistricts recorded among the highest incidence rates namely Alor Pasir, Chetok, Kubang Sepat, Gual Periok, and Kuala Lemal.
Table 3.
Incidence rates according to subdistricts by the period of flooding
| No | 3 months preflooding | 3 months postflooding | ||||
|---|---|---|---|---|---|---|
| Subdistrict | District | IR | Subdistrict | District | IR | |
| 1 | Olak Jeram | Kuala Krai | 190.6 | Alor Pasir | Pasir Mas | 160.4 |
| 2 | Chetok | Pasir Mas | 119.3 | Chetok | Pasir Mas | 143.1 |
| 3 | Batu Mengkebang | Kuala Krai | 117.9 | Jeli | Jeli | 135.3 |
| 4 | Temangan | Machang | 107.0 | Kubang Sepat | Pasir Mas | 131.2 |
| 5 | Gual Periok | Pasir Mas | 83.6 | Ulu Kusial | Tanah Merah | 124.6 |
| 6 | Dabong | Kuala Krai | 80.9 | Galas | Gua Musang | 122.6 |
| 7 | Pasir Mas | Pasir Mas | 69.2 | Gual Periok | Pasir Mas | 122.1 |
| 8 | Alor Pasir | Pasir Mas | 64.2 | Kuala Lemal | Pasir Mas | 120.9 |
| 9 | Kebakat | Tumpat | 54.6 | Olak Jeram | Kuala Krai | 113.5 |
| 10 | Panyit | Machang | 48.4 | Batu Melintang | Jeli | 111.7 |
ANN analysis was done for the different periods of flood. All periods showed that the nearest neighborhood ratio of below one indicating that the pattern of occurrence in all three periods was clustered. This index indicates the ratio between observed mean distance to expected mean distance, and the smaller ratio indicates that cases are more clustered (nearer to each other) in the during flood period and postflood period. Table 4 shows the different results of ANN analysis. The observed mean distance between each case was approximately 500 meters closer in the postflood period compared to the preflood period, both being statistically significant (P < 0.01).
Table 4.
Average nearest neighborhood analysis of cases within different flood periods
| Period | Observed mean distance | Expected mean distance | Nearest neighborhood ratio | z-score | P value |
|---|---|---|---|---|---|
| Preflood | 1,665.70 | 3,226.45 | 0.52 | −18.58 | < 0.01 |
| During flood | 2,175.48 | 4,381.76 | 0.49 | −12.15 | < 0.01 |
| Postflood | 1,138.83 | 2,311.28 | 0.49 | −25.84 | < 0.01 |
Spatial autocorrelation analysis of leptospirosis incidence rates was performed using the Global Moran’s I statistics. Table 5 shows the different leptospirosis clustering distribution within the three different periods. From the three different periods, the highest Moran’s I (0.19) was found in the postflood period with the highest z-score (9.74) indicating that leptospirosis incidence was most clustered in the postflood period.
Table 5.
Global spatial autocorrelation analysis of leptospirosis incidence
| Period | Leptospirosis incidence rates | Pattern | ||
|---|---|---|---|---|
| Moran’s I | z-score | P value | ||
| Preflood | 0.06 | 3.83 | < 0.01 | Clustered |
| During flood | 0.05 | 1.93 | 0.05 | Weakly clustered |
| Postflood | 0.19 | 9.74 | < 0.01 | Clustered |
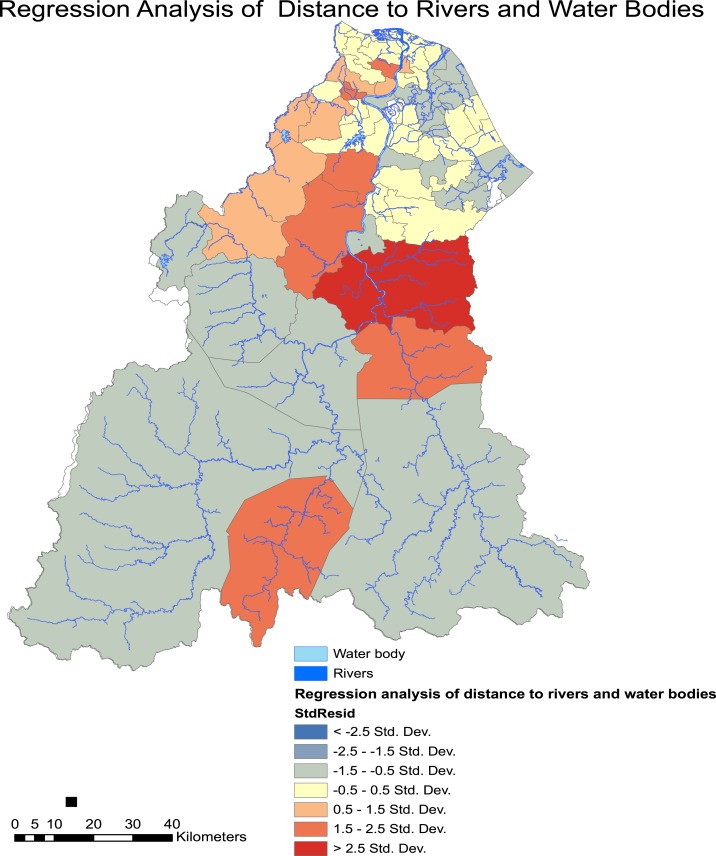
GWR were performed to look into the association of living in proximity to the nearest water bodies, including rivers, lakes, and channels. The regression coefficient (R2) and the Akaike Information Criterion (AICc) were determined. Figure 5 shows the areas where cases coincide with the risks mentioned before. This analysis was performed after we noted poor correlation by using OLS analysis with the following statistics: R2 = 0.0062, coefficient = −0.602, P > 0.05, AICc = 516.76. The GWR diagnostics were as follows: R2 = 0.227, AICc = 509.01. This indicates a significant association between living near water bodies and the risk of developing leptospirosis.
Figure 5.
Spatial regression analysis of leptospirosis incidence risk in those living close to water bodies. This figure appears in color at www.ajtmh.org.
The subdistrict of Batu Mengkebang in Kuala Krai showed the highest association between living in proximity to water bodies with the incidence of leptospirosis after the flooding.
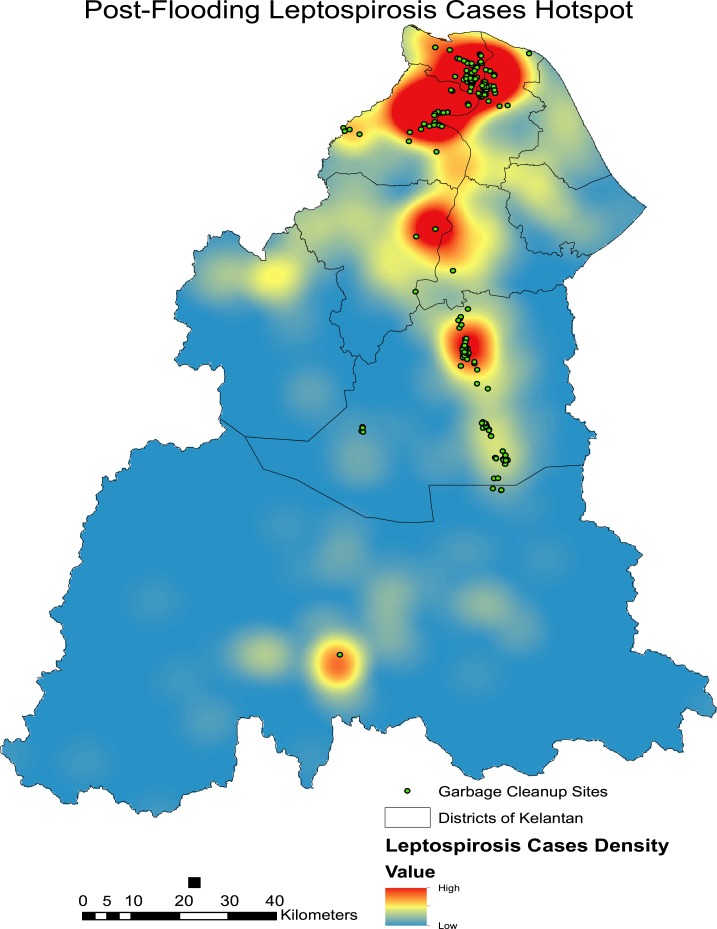
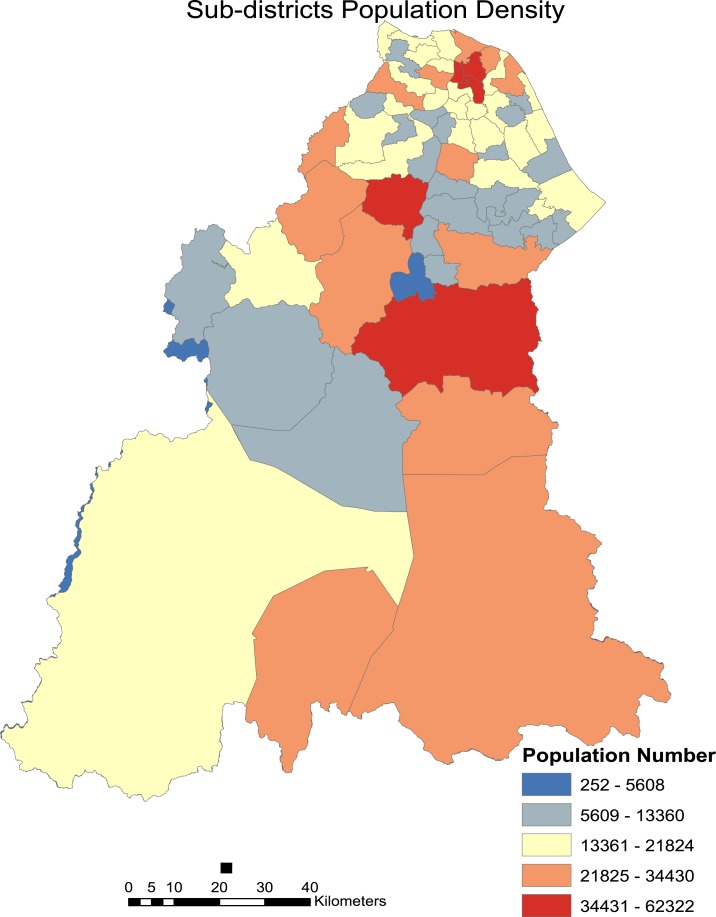
Kernel density analysis revealed several hotspot areas highly concentrated in the more urbanized areas of northern Kelantan (Figure 6). Other hotspot areas include those in the most severely affected district of Kuala Krai in the central region of Kelantan. It can also be noted that most garbage cleanup sites are concentrated in leptospirosis hotspot areas. This indicates that the garbage cleanup efforts in the recovery phase were carried out around or near leptospirosis hotspot areas which permits higher interaction between rodents and humans. Most of the garbage cleanup sites were located in the Kota Bharu, Tumpat, Pasir Mas, and Kuala Krai districts. This supports the indication that incidence of postflooding leptospirosis in Kelantan can be related to areas where garbage accumulation was highest and cleanup was required. The major hotspots as shown in the Figure 6 also relate with the increase in incidence rates of many subdistricts in the populated areas of Northern and Central Kelantan (Figure 7).
Figure 6.
Hotspots of leptospirosis incidence and location of garbage cleanup sites during postflood period. This figure appears in color at www.ajtmh.org.
Figure 7.
Population density of sub-districts in Kelantan. This figure appears in color at www.ajtmh.org.
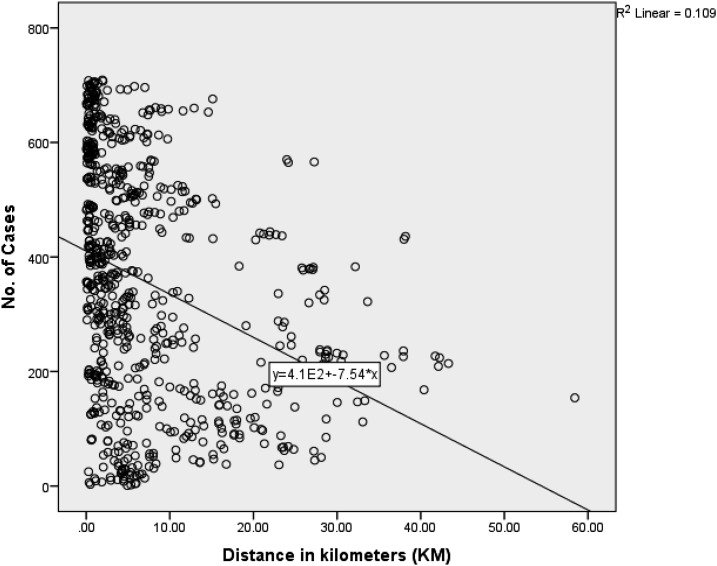
Table 6 below shows the results of analysis using negative binomial regression to show the relationship between the occurrence of leptospirosis cases and distance in kilometers to garbage cleanup sites. The results indicate that there is a negative association where further distance from the garbage cleanup sites is found to be protective i.e., reduces the number of cases. It can be noted that a further increase in 1 km from garbage dumpsites will lead to a reduction of 1% cases. Figure 8 further clarifies the inverse association and shows that cases occur more frequently near garbage cleanup sites and reduce as distance increase.
Table 6.
Distance of leptospirosis cases to garbage cleanup site analysis
| Parameter | Model value | Std. error | 95% Confidence interval | Exp(B) | P value | |
|---|---|---|---|---|---|---|
| Lower | Upper | |||||
| (Intercept) | 6.017 | 0.0473 | 5.925 | 6.110 | 410.539 | 0.000 |
| Distance (km) | −0.023 | 0.0039 | −0.030 | −0.015 | 0.978 | 0.000 |
Figure 8.
Linear association between distance to garbage cleanup sites and number of cases.
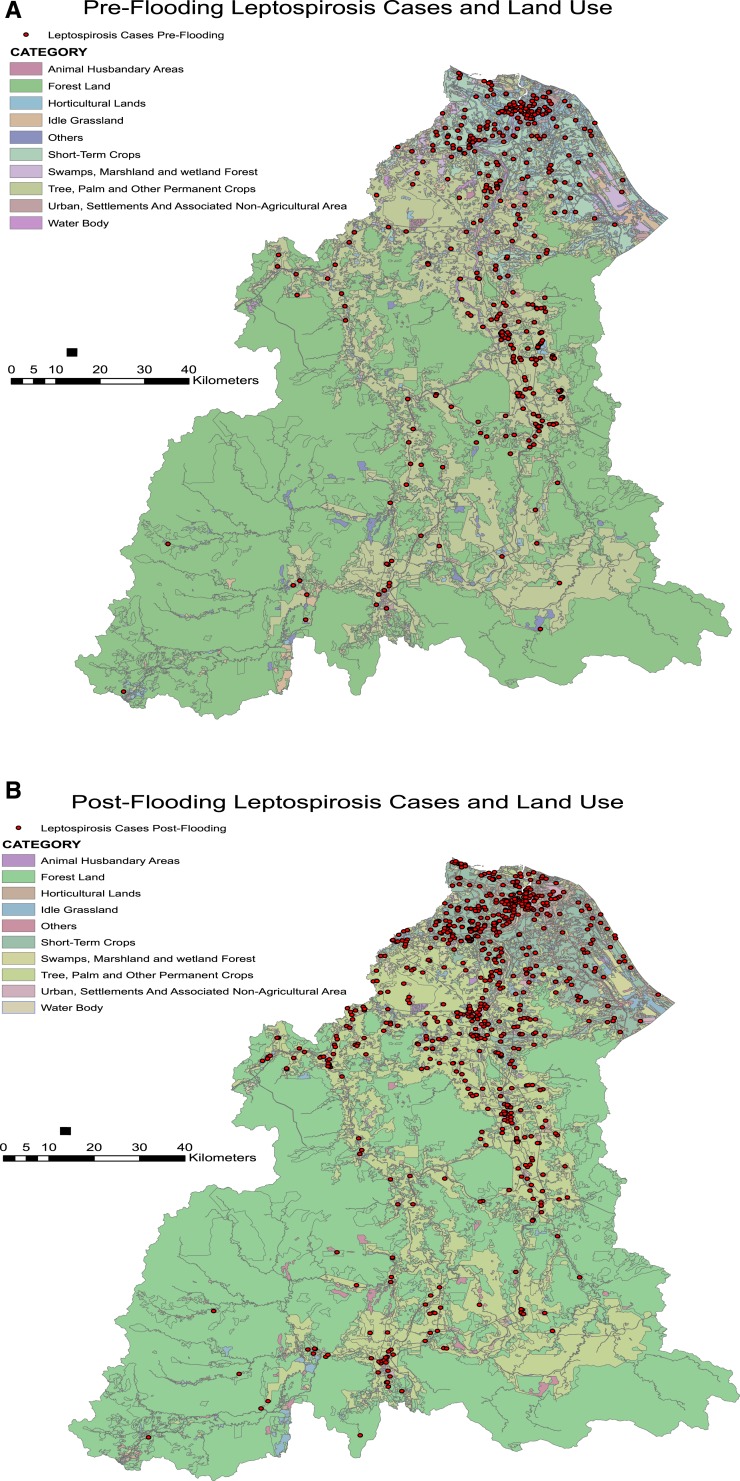
Another important factor was determining whether the incidence of leptospirosis throughout the study periods was associated with land use. Figure 9 shows the distribution of individual leptospirosis cases based on the land use where they were located. Table 7 shows the breakdown in the number of cases according to the land use areas they were located in the preflood and postflood periods. Table 7 shows that cases occurred highest among those living in horticultural lands in both study periods, contributing to over a third of the cases in each period. However, there was no significant association between types of land use and the occurrence of leptospirosis cases in the preflood and postflood periods.
Figure 9.
Distribution of leptospirosis cases according to land use. (A) Incidence map 3 months before the flood. (B) Incidence of leptospirosis 3 months postflooding. This figure appears in color at www.ajtmh.org.
Table 7.
Association between land use and leptospirosis incidence in the pre- and postflood periods
| Leptospirosis cases according to land use | ||||
|---|---|---|---|---|
| Pre | Post | |||
| Factors | n (%) | n (%) | χ2 (df) | P value |
| Land use | ||||
| Animal husbandary areas | 0 (0.0) | 1 (0.1) | 7.137 (9)* | 0.623 |
| Forest land | 12 (3.4) | 16 (2.2) | – | – |
| Horticultural lands | 130 (36.4) | 285 (39.3) | – | – |
| Idle grassland | 6 (1.7) | 24 (3.3) | – | – |
| Others | 1 (0.3) | 2 (0.3) | – | – |
| Short-term crops | 31 (8.7) | 76 (10.5) | – | – |
| Swamps, marshland and wetland forest | 2 (0.6) | 3 (0.4) | – | – |
| Tree, palm, and other permanent crops | 88 (24.6) | 167 (23.0) | – | – |
| Urban, settlements and associated non agricultural area | 83 (23.0) | 141 (19.4) | – | – |
| Water body | 5 (1.4) | 10 (1.4) | – | – |
| Total | 357 (100.0) | 725 (100.0) | – | – |
χ2 test with Yates Correction.
Environmental parameters and meteorological factors.
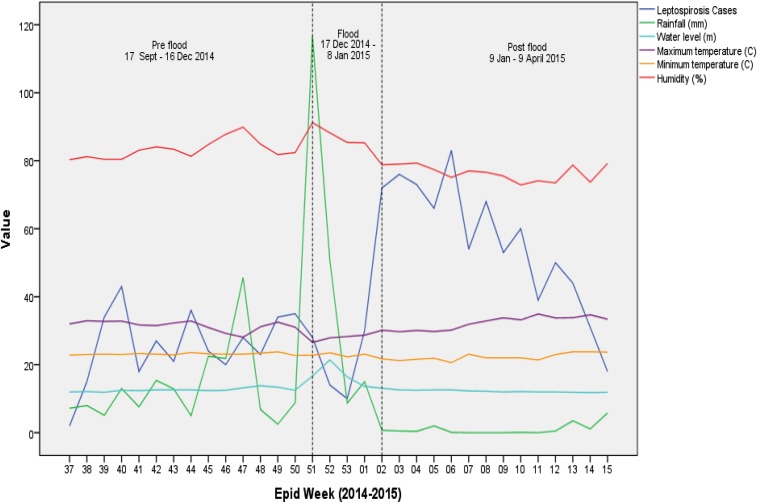
Analysis of the environmental parameters studied can be summarized in the following Figure 10. It shows the recorded average weekly rainfall (mm), river water level (m), humidity (%), and temperature (°C) along with the number of leptospirosis cases according to epidemiological week of incidence. After a soar in weekly average precipitation toward the end of 2014, it eventually led to a significant rise in water levels indicating the occurrence of flood. About 2 weeks later, we can see a surge in leptospirosis cases and the cases continued to increase in frequency about 3 months into the postflood period.
Figure 10.
Leptospirosis cases and environmental parameters according to epidemiological weeks. This figure appears in color at www.ajtmh.org.
Over the course of the different periods in our study, we noted that increase in rainfall was seen 1 week before the flooding. The highest total rainfall recorded for a week exceeding 1,000 mm was seen in Machang district 1 week before the flooding. All other areas recorded their record rainfall during the same week where weekly total rainfall was between 600 mm and 1,000 mm. This immense amount of rainfall within a week led to the flooding. Another peak of incidence ensued about 3 weeks of the first peak of incidence.
GLM using negative binomial regression was conducted after overdispersion was noted upon use of the Poisson linear regression and the results are shown in Table 8 below.
Table 8.
Weekly climatic parameters associated with incidence of leptospirosis
| Parameter | Model value | Std. error | 95% Confidence interval | Exp(B) | P value | |
|---|---|---|---|---|---|---|
| Lower | Upper | |||||
| (Intercept) | 22.150 | 1.4744 | 19.260 | 25.050 | 4.165 E9 | 0.000 |
| Max. temperature (°C) | −0.145 | 0.0281 | −0.200 | −0.90 | 0.865 | 0.000 |
| Min. temperature (°C) | 0.134 | 0.0499 | 0.037 | 0.232 | 1.144 | 0.007 |
| Humidity (%) | −0.196 | 0.0155 | −0.226 | −0.166 | 0.822 | 0.000 |
| Rainfall (mm) | 0.008 | 0.0025 | 0.003 | 0.013 | 1.008 | 0.002 |
| Water level (m) | 0.097 | 0.0317 | 0.035 | 0.160 | 1.102 | 0.002 |
The final model of the GLM is as follows where all variables are significant at P < 0.05:
In the final model, average rainfall, river water level, and minimum temperature were positively associated with the leptospirosis incidence while humidity and maximum temperature showed negative association with the incidence. With every increase of 1°C in minimum temperature, the incidence risk ratio of leptospirosis increases by 1.14. Every increase in 1 mm of rainfall and 1 m of river water level increases the incidence risk ratio of leptospirosis cases by 1.01 and 1.10, respectively. Meanwhile, with 1°C increase in weekly maximum temperature and one percent of weekly humidity, we can note an almost 1% reduction in the number of cases.
DISCUSSION
After a rainy season and flooding, leptospirosis cases have commonly increased in endemic developing countries as well as developed countries where the disease was usually uncommon. Extended heavy rain falls in early January 2015 has led to an outbreak of leptopsirosis in Guyana that caused eleven laboratory confirmed leptospirosis deaths.17 In 2009, the typhoon and flooding in Manila led to over 400 hospitalizations of leptospirosis cases.18 Outbreaks after heavy rainfall and flooding also occur in other parts of the world especially in developing Asian countries.5,19–22 Apart from that, outbreaks after rainy season and flooding have occurred in nonendemic areas such as Taiwan, Australia, and the United States.23–25
Outbreaks after flooding and monsoon season have led to an increase in incidence in certain groups of population. In our study, we found that young males in their productive age were the most affected. The same finding can be seen in many parts of the world after flooding. In India, following a case–control study after flood, two-thirds of leptospirosis cases were found among those aged 15–34 years.26 More cases among males with similar mean age of 31 were also found after an outbreak of leptospirosis after flood in the Philippines.17 The same finding can be seen in areas where leptospirosis is endemic without the occurrence of flood. A study of leptospirosis infection in an urban slum area in Salvador, Brazil, found that one of the groups with the highest prevalence were adolescent males aged 15–24 years.27 One explanation to this could be due to the increased exposure among this age group of population that dwells in flood waters or contaminated areas during rescue, transportation efforts, and cleanup process postflooding. However, it is noted that the incidence is higher among the elderly aging between 60 and 74, and this can also be seen in a study conducted in Yemen where the highest prevalence rate of Leptospira IgG antibodies was found among old population of above 58 years of age.28 In another study in Bulgaria, leptospirosis incidence among those aging from 60 to 78 constituted about 14% of their sample population and was associated with severe course and higher risk of death requiring prompt intensive treatment.29
We noted the surge in leptospirosis incidence during the different periods of our study. Although this does not portray the exact annual incidence of the disease, it shows the severity of incidence during the study duration that should be considered seriously. In Brazil, outbreaks occurred after heavy rain and flooding causing the incidence rates to skyrocket within 6 weeks, with certain areas recorded between 200 and 400 cases per 100,000 population.30 The incidence rates increased in many areas can be caused by many different interactions between the human population, animal host, leptospires, and the environment they share.31 One important fact is the displacement of the population during the flooding that can lead to overcrowding and poor sanitation practices in relocation centers. This might lead to the suitable conditions that lead to leptospirosis outbreaks in our study population. We were unable to record population displacement but we acknowledge the possibility of it causing the outbreaks of disease in our study.
Detecting spatial clusters were also important and we noted that leptospirosis cases were highly clustered after flooding. This similar finding can be found in a 5-year study on leptospirosis clustering in Rio de Janeiro, Brazil, where clusters occur more frequently during heavy rainfall and flooding season.27 Disease clustering analysis can also help in determining the transmission of disease and mapping of risk.32 We noted that the cases were highly clustered in the postflood period which indicates that neighborhood or peridomiciliary transmission might play a role. In addition, living near water bodies may also increase the risk of leptospirosis infection among the population in Kelantan. This can also be seen in another spatial epidemiology study conducted in Sri Lanka where outbreaks after heavy rainfall season were characterized by a shorter average distance to rivers.33
From our analysis, the density of cases in the postflood period were in the more urbanized central areas of Kelantan with close proximity to garbage accumulation and cleanup areas. Statistically, most leptospirosis cases occurred near garbage cleanup sites, and further distance from such garbage dumpsites reduced the possibility of cases occurring. This could probably be due to increased household transmission from more densely populated areas where the garbage accumulation areas provide favorable environmental condition which supports rodent growth and proliferation. Local sightings of rats which thrive in garbage dumpsites within urban areas among population exposed to floodwaters are significantly associated with leptospirosis in a study conducted in Mumbai, India.26 Residing in areas near open sewers in urban areas was also highly associated with the infection during rainy seasons in Sao Paolo, Brazil.34 In a case–control study of leptospirosis cases postflooding in India, the odds of contracting the disease were increased 4-folds among those living in close proximity to accumulated thrash in their surrounding.26 In a spatial analysis of outbreaks after flooding, areas with improved solid waste and sewage management elicit lower incidence rates of leptospirosis in a city in Brazil.30 Improved cooperation between local and municipality authorities as well as community and individual levels in improved solid waste and garbage management may help reduce leptospirosis incidence in the future. As for land use, we noted that cases occurred higher in the presence of vegetation i.e., crops and horticultural lands. This provides shrubs and shelters for rodents to inhabit, and this can also be seen in a study conducted in Indonesia.11
Climatic factors have been shown to influence leptospirosis incidence strongly and we can see similar relationships in our study, if not all. Increase in rainfalls exceeding 600 mm within a week in many areas has led to flooding and eventually leptospirosis incidence. In Kerala, India, disease outbreaks occurred 7–10 days after heavy rainfall.35 In Mumbai, India, a severe 944 mm rainfall within a day on the 26th of July 2005 led to an 8-fold increase in the incidence of leptospirosis a few weeks following the event.36 Warmer temperature has been shown to increase incidence, we noted that higher minimum temperature was associated significantly with the incidence. Surprisingly, humidity and rainfall were negatively associated with the outbreak of disease 3 months postflooding as compared with the same preflood period. Circumstantial differences after the flooding may play a role in causing this inverse relationship. We hypothesize that precipitation and flooding were more stronger in causing outbreaks when other environmental parameters that favor leptospirosis outbreak were absent, i.e., high humidity and temperature.31 The severe Kelantan flood of 2014 was an extreme weather event that was attributable to the global climate change in general. Climate change in the long run leads to more frequent extreme weather events such as flooding and this may cause more outbreaks of leptospirosis and other flood-related communicable diseases.37
CONCLUSION
Leptospirosis is one of the most common transmissible infections from animals to human. Exposure to contaminated environments where leptospira thrive increases the risk of contracting the disease. The interaction between human, animal, and bacteria in the environment can be enhanced during flooding leading to outbreaks and epidemics in areas where the infection is already endemic. We noted the disproportionate demographic characteristic of the disease which affects more younger males. In this study, we showed the areas where incidence of leptospirosis were high by comparing the pre- and postflood periods. This serves as an early indication for future preparedness and allocation of public health interventions in areas affected by flooding. Spatial mapping of hotspots and clustering analysis of leptospirosis outbreaks also offer aid in improved visualization of areas that require more assistance in environmental health management and services postflooding to help reduce the outbreak of the infection. Moreover, living in densely populated areas, in close proximity to water bodies and garbage accumulation contribute to the increased exposure of humans to the leptospira species leading to the infection. We found that the incidence of leptospirosis increase 2–3 weeks after heavy rainfall and flooding confirming the incubation period of the disease upon exposure. The ongoing climate change can lead to more frequent extreme weather events especially flooding in Malaysia. By looking at the possible climatic factors that may influence outbreaks, we can determine the disease outbreak patterns and help in future predictions of outbreaks after flooding. This together with improved disease surveillance may enhance our preparation of future disaster and reduce the incidence and outbreaks of the disease. In summary, understanding the spatial distribution and associated factors of leptospirosis can help improve future disease outbreak management after floods.
Acknowledgments:
This research is funded by Fundamental Research Grant Scheme (FRGS), Ministry of Higher Education Malaysia and ethical approval was obtained from Research and Ethics Committee of Faculty of Medicine UKM (FRGS/1/2015/SKK07/UKM/02/3) and Medical Research and Ethics Committee (MREC), Ministry of Health Malaysia. We would like to thank the Director General of Health Malaysia for his permission to publish this paper. We extend our highest gratitude to the Dean of Medical Faculty of the National University of Malaysia and the Director of the UN University-International Institute for Global Health for their support in this research. Our special thanks to Professor Virginia Murray of Public Health England for her continuous advice and insights into this research. Special appreciation to Rohayu Che Omar and Farrah Melissa Muharam from Universiti Tenaga Nasional and Universiti Putra Malaysia, respectively, for data and knowledge sharing.
REFERENCES
- 1.Azlee A, 2015. Worst floods in Kelantan, confirms NSC. Available at: http://www.themalaymailonline.com/print/malaysia/worst-floods-in-kelantan-confirms-nsc. Accessed March 4, 2015.
- 2.WHO , 2014. Leptospirosis Excerpt from “WHO Recommended Standards and Strategies for Surveillance, Prevention and Control of Communicable Diseases,” 1–4. Geneva, Switzerland: World Health Organization. [Google Scholar]
- 3.WHO , 2003. Human Leptospirosis: Guidance for Diagnosis, Surveillance and Control. Geneva, Switzerland: World Health Organization. [Google Scholar]
- 4.Lau C, 2009. Urbanisation, Climate Change, and Leptospirosis: Environmental Drivers of Infectious Disease Emergence. Universitas 21 International Graduate Research Conference: Sustainable Cities for the Future, 83–87. Available at: http://scholar.google.com/scholar?hl=en&btnG=Search&q=intitle:Urbanisation+,+climate+change+,+and+leptospirosis+:+environmental+drivers+of+infectious+disease+emergence#0. Accessed May 24, 2016.
- 5.Wahab ZA, 2015. Epidemiology and Current Situation of Leptospirosis in Malaysia. Persidangan Kesihatan Persekitaran Pihak Berkuasa Tempatan 2015, September 8–9, 2015, 1–67.
- 6.Nations U, 2015. Sendai Framework for Disaster Risk Reduction 2015–2030 United Nations, Adopted 15. Third UN World Conference on Disaster Risk Reduction. March 14–18, 2015, Miyagi, Japan, 1–37. [Google Scholar]
- 7.WHO , 1999. WHO Recommended Surveillance Standards WHO/CDS/CSR/ISR/99.2 Geneva, Switzerland: World Health Organization, 1–144. [Google Scholar]
- 8.Ministry of Health Malaysia , 2011. Guideline for the Diagnosis, Management, Prevention and Control of Leptospirosis in Malaysia. Putrajaya, Malaysia: Ministry of Health. [Google Scholar]
- 9.Pradhan B, Youssef AM, 2011. A 100-year maximum flood susceptibility mapping using integrated hydrological and hydrodynamic models: Kelantan River Corridor, Malaysia. J Flood Risk Manag 4: 189–202. [Google Scholar]
- 10.Anselin L, 1995. Local indicators of spatial association—LISA. Geogr Anal 27: 93–115. [Google Scholar]
- 11.Nur Fajriyah S, Udiyono A, Saraswati LD, 2017. Environmental and risk factors of leptospirosis: a spatial analysis in Semarang City. OP Conf. Ser.: Earth Environ. Sci. 55: 012013. [Google Scholar]
- 12.Dewan AM, Corner R, Hashizume M, Ongee ET, 2013. Typhoid fever and its association with environmental factors in the Dhaka metropolitan area of Bangladesh: a spatial and time-series approach. PLoS Negl Trop Dis 7: 12–15. [DOI] [PMC free article] [PubMed] [Google Scholar]
- 13.El-Fadel M, Ghanimeh S, Maroun R, Alameddine I, 2012. Climate change and temperature rise: implications on food- and water-borne diseases. Sci Total Environ 437: 15–21. [DOI] [PubMed] [Google Scholar]
- 14.IRT Group , 2015. SPSS Data Analysis Examples Negative Binomial Regression Available at: Http://www.ats.ucla.edu/stat/spss/dae/neg_binom.htm, 1–7. Accessed May 24, 2016.
- 15.Virtual Atlast of the Terrestrial Birds of Spain , 2002. The Negative Binomial Model, Stat 544, Lecture 17 Available at: avesbiodiv.mncn.csic.es/estadistica/negbin.pdf. Accessed May 24, 2016.
- 16.Lord D, Park BJ, 2012. Negative Binomial Regression Models and Estimation Methods. Probability density and likelihood functions, 1–15.
- 17.Dechet AM, et al. 2012. Leptospirosis outbreak following severe flooding: a rapid assessment and mass prophylaxis campaign; Guyana, January–February 2005. PLoS One 7: e39672, 1–7. [DOI] [PMC free article] [PubMed] [Google Scholar]
- 18.Amilasan AST, et al. 2012. Outbreak of leptospirosis after flood, the Philippines, 2009. Emerg Infect Dis 18: 91–94. [DOI] [PMC free article] [PubMed] [Google Scholar]
- 19.Agampodi SB, et al. 2014. Regional differences of leptospirosis in Sri Lanka: observations from a flood-associated outbreak in 2011. PLoS Negl Trop Dis 8: e2626. [DOI] [PMC free article] [PubMed] [Google Scholar]
- 20.Kost GJ, Katip P, Vinitwatanakhun C, 2012. Diagnostic testing strategies for health care delivery during the great Bangkok flood and other weather disasters. Point Care 11: 191–199. [Google Scholar]
- 21.Vijayachari P, Sugunan AP, Murhekar MV, Sharma S, Sehgal SC, 2004. Leptospirosis among schoolchildren of the Andaman & Nicobar Islands, India: low levels of morbidity and mortality among pre-exposed children during an epidemic. Epidemiol Infect 132: 1115–1120. [DOI] [PMC free article] [PubMed] [Google Scholar]
- 22.Pappas G, Papadimitriou P, Siozopoulou V, Christou L, Akritidis N, 2008. The globalization of leptospirosis: worldwide incidence trends. Int J Infect Dis 12: 351–357. [DOI] [PubMed] [Google Scholar]
- 23.Chiu CH, Wang YC, Yang YS, Chang FY, 2009. Leptospirosis after typhoon in Taiwan. J Med Sci 29: 131–134. [Google Scholar]
- 24.Gaynor K, Katz AR, Park SY, Nakata M, Clark TA, Effler PV, 2007. Leptospirosis on oahu: an outbreak associated with flooding of a university campus. Am J Trop Med Hyg 76: 882–885. [PubMed] [Google Scholar]
- 25.Smith JKG, Young MM, Wilson KL, Craig SB, 2013. Leptospirosis following a major flood in Central Queensland, Australia. Epidemiol Infect 141: 585–590. [DOI] [PMC free article] [PubMed] [Google Scholar]
- 26.Bhardwaj P, Kosambiya JK, Desai VK, 2008. A case control study to explore the risk factors for acquisition of leptospirosis in Surat City, after flood. Indian J Med Sci 62: 431–438. [PubMed] [Google Scholar]
- 27.Reis RB, et al. 2008. Impact of environment and social gradient on Leptospira infection in urban slums. PLoS Negl Trop Dis 2: e228. [DOI] [PMC free article] [PubMed] [Google Scholar]
- 28.Al-Robasi AA, Rohaim WD, Al-Danani DA, 2015. Seroprevalence of leptospira antibodies among populations at risk. J Microbiol Infect Dis 5: 1–4. [Google Scholar]
- 29.Gancheva GI, 2013. Leptospirosis in elderly patients. Braz J Infect Dis 17: 592–595. [DOI] [PMC free article] [PubMed] [Google Scholar]
- 30.Barcellos C, Sabroza PC, 2000. Socio-environmental determinants of the leptospirosis outbreak of 1996 in western Rio de Janeiro: a geographical approach. Int J Environ Health Res 10: 301–313. [DOI] [PubMed] [Google Scholar]
- 31.Lau CL, Smythe LD, Craig SB, Weinstein P, 2010. Climate change, flooding, urbanisation and leptospirosis: fuelling the fire? Trans R Soc Trop Med Hyg 104: 631–638. [DOI] [PubMed] [Google Scholar]
- 32.Lau CL, Clements ACA, Skelly C, Dobson AJ, Smythe LD, Weinstein P, 2012. Leptospirosis in American Samoa—estimating and mapping risk using environmental data. PLoS Negl Trop Dis 6: e1669. [DOI] [PMC free article] [PubMed] [Google Scholar]
- 33.Robertson C, Nelson TA, Stephen C, 2012. Spatial epidemiology of suspected clinical leptospirosis in Sri Lanka. Epidemiol Infect 140: 731–743. [DOI] [PubMed] [Google Scholar]
- 34.Sarkar U, et al. 2002. Population-based case-control investigation of risk factors for leptospirosis during an urban epidemic. Am J Trop Med Hyg 66: 605–610. [DOI] [PubMed] [Google Scholar]
- 35.Pappachan MJ, Sheela M, Aravindan KP, 2004. Relation of rainfall pattern and epidemic leptospirosis in the Indian state of Kerala. J Epidemiol Community Health 58: 1054. [DOI] [PMC free article] [PubMed] [Google Scholar]
- 36.Maskey M, Shastri JS, Saraswathi K, Surpam R, Vaidya N, 2006. Leptospirosis in Mumbai: post-deluge outbreak 2005. Indian J Med Microbiol 24: 337–338. [DOI] [PubMed] [Google Scholar]
- 37.Hashim JH, Hashim Z, 2015. Climate change, extreme weather events, and human health implications in the Asia Pacific region. Asia Pac J Public Health 28: 8S–14S. [DOI] [PubMed] [Google Scholar]


