Abstract.
Severe fever with thrombocytopenia syndrome (SFTS) is emerging in China. To explore the lagged effects and nonlinear association between temperature and SFTS, we collected data on ambient temperature and SFTS cases and analyzed the data using a distributed lag nonlinear model. A total of 1,933 SFTS cases were reported in the study area from 2011 to 2015. Our study revealed a nonlinear relationship between weekly temperature and SFTS. The exposure–response curve was an approximately reversed U-shaped peak at 23°C. High temperatures had acute and short-term effects, whereas low temperatures had persistent and long-term effects. The effects of lower temperatures (1.62°C and 6.97°C) could last 24 weeks, but the effect of 29.30°C was not significant at lag 8 weeks. Our results provide information to better understand the effect of temperature variation on SFTS and may have policy implications for disease prevention and control.
INTRODUCTION
Severe fever with thrombocytopenia syndrome (SFTS) is an emerging infectious disease which was first identified in 2009.1 It is caused by SFTS virus (SFTSV), which is classified in Bunyavirales order, family Phenuiviridae, genus Phlebovirus. Severe fever with thrombocytopenia syndrome virus consists of three segments of negative or ambisense polarity RNA, designated S, M, and L segments.2 The clinical symptoms of SFTS including fever, headache, fatigue, chill, lymphadenopathy, nausea, anorexia, myalgia, diarrhea, vomiting, abdominal pain, gingival hemorrhage, and conjunctival congestion are less specific.3 Some SFTS patients experienced self-limiting clinical course, whereas some patients died because of multiple organ failure.4,5 In China, a total of 5,360 laboratory-confirmed SFTS cases were reported and annual case numbers increased from 2011 to 2016.6 In addition, SFTS or SFTS-like patients have also been reported in South Korea, Japan, United Arab Emirates, and the United States.7–10
Although SFTSV is believed to be transmitted through direct contact with SFTS patients’ secretion or blood, and probable aerosol transmission, most SFTS cases were infected through tick bites.11–16 Severe fever with thrombocytopenia syndrome is a climate-sensitive disease and most cases were reported from April to October.6 Meteorological factors may influence SFTSV ecology both directly and indirectly by affecting tick growth dynamics, tick–human interactions, and virus replication. Distributed lag nonlinear models (DLNMs) represent a modeling framework to flexibly describe associations showing potentially nonlinear and delayed effects in time series data. This methodology rests on the definition of a crossbasis, a bidimensional functional space expressed by the combination of two sets of basis functions, which specify the relationships in the dimensions of predictor and lags, respectively. This framework is implemented in the R package dlnm, which provides functions to perform the broad range of models within the DLNM family and then to help interpret the results, with an emphasis on graphical representation.17 In this study, we used DLNM to examine the temporal lagged association between meteorological factors and SFTS. Results of this study may be useful for better understanding SFTSV ecology and provide scientific information for SFTS early warning and timely control.
MATERIALS AND METHODS
Study area.
In our previous study, we identified an area in the central region of China using SaTScan software (version 9.4.4). The area which consisted of 21 contiguous counties from Henan Province, Hubei Province, and Anhui Province had the highest SFTS incidence rate in China. A total of 1,933 SFTS cases were reported in this area from 2011 to 2015.
Data collection.
According to the national guideline for prevention and control for SFTS issued by the Chinese Ministry of Health in 2010, SFTS cases should be reported to the China Information System for Diseases Control and Prevention within 24 hours after diagnosis.18 Data on SFTS cases from January 2011 to December 2015 in the study area were obtained from the China Information System for Diseases Control and Prevention. All SFTS cases in this study were confirmed according to the guideline mentioned previously. Meteorological data including daily mean temperature, daily maximum temperature, daily minimum temperature, daily mean relative humidity, daily minimum relative humidity, and precipitation of the study area were collected from the China Meteorological Data Sharing Service System (http://data.cma.cn/).
Data analysis.
Descriptive analysis was used to describe the characteristics of SFTS cases and meteorological factors. Distributed lag nonlinear model in the R package (version 3.4.0) were used to graphically demonstrate the three-dimensional temperature–SFTS–lag associations. The “DLNM” command in the R package provides an internal function, “onebasis,” to generate the base matrices for modeling exposure–response and lag–response relationships, respectively, and combine them together through another function, “cross-basis,” which captures the exposure–lag–response dependency simultaneously. In this study, a natural cubic spline DLNM was used to model the nonlinear association between temperature and SFTS. Akaike information criterion was adopted to choose the degrees of freedom for temperature, relative humidity, precipitation, and lag. The final DLNM regression model was fitted with a family of quasi-Poisson distributions for over-dispersion and a log link. Seasonality and long-term trends were adjusted by including a factor of year and week ordinal in the model. The final composition of the function was a natural cubic spline of weekly mean temperature with three degrees of freedom and a natural cubic spline with three degrees of freedom for lag days. Four degrees of freedom were used to smooth weekly mean humidity and weekly precipitation. Trend is a variable of the year and the week ordinal used to control for seasonality and long-term trend. The mean temperatures were selected as the reference centering points for calculating relative risk (RR). The “DLNM” and “spline” packages in the R software (version 3.4.0) were used to create the DLNM model.
RESULTS
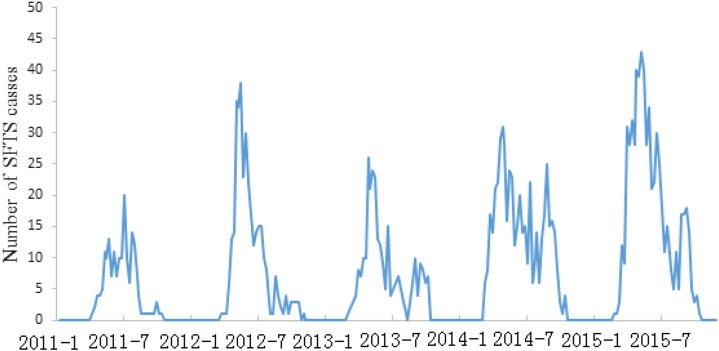
Between January 1, 2011, and December 30, 2015, a total of 1,933 SFTS cases were reported in the study area. There was a median of 3 weekly SFTS cases over the study period and the highest number of weekly SFTS cases was 43 (Table 1). As shown in Figure 1, the time series of weekly SFTS cases indicated a seasonal pattern. Although most SFTS cases occurred between the 17th week and the 40th week, the seasonal peak was found to differ from year to year.
Table 1.
Descriptive statistics for weekly SFTS cases and meteorological variables in the study area, 2011–2015
| Variable | Minimum | First quartile | Median | Third quartile | Maximum |
|---|---|---|---|---|---|
| Number of SFTS cases | 0 | 0 | 3 | 12 | 43 |
| Mean temperature (°C) | −1.35 | 6.97 | 17.70 | 23.97 | 32.83 |
| Maximum temperature (°C) | 1.61 | 13.25 | 23.70 | 28.67 | 39.17 |
| Minimum temperature (°C) | −4.40 | 3.26 | 12.89 | 20.48 | 28.66 |
| Mean relative humidity (%) | 39.54 | 66.20 | 72.26 | 78.23 | 93.09 |
| Maximum relative humidity (%) | 15.34 | 37.71 | 47.83 | 57.00 | 82.86 |
| Precipitation (mm) | 0 | 0.89 | 12.17 | 34.60 | 167.51 |
SFTS = severe fever with thrombocytopenia syndrome.
Figure 1.
Weekly time series of severe fever with thrombocytopenia syndrome (SFTS) cases from January 2011 to December 2015 in the study area. Weekly SFTS cases indicated a seasonal pattern and most cases occurred between the 17th week and the 40th week. This figure appears in color at www.ajtmh.org.
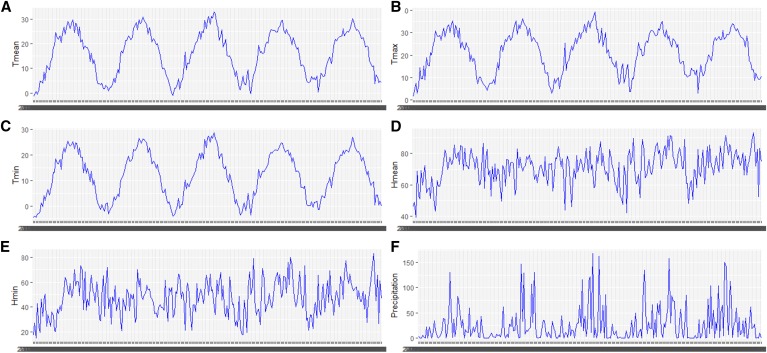
The median of weekly mean temperature, maximum temperature, minimum temperature, mean relative humidity, minimum relative humidity, and precipitation was 17.70°C, 23.70°C, 12.89°C, 72.26%, 47.83%, and 12.17 mm, respectively (Table 1). In addition, the minimum, the maximum, the first quartile, and the third quartile of these meteorological variables were also summarized in Table 1. According to the weekly time series of meteorological variables, these variables presented fluctuations and characterized seasonal patterns during the study period (Figure 2).
Figure 2.
Weekly time series of meteorological factors from January 2011 to December 2015 in the study area. (A) Weekly mean temperature in 2011–2015, (B) weekly maximum temperature in 2011–2015, (C) weekly minimum temperature in 2011–2015, (D) weekly mean relative humidity in 2011–2015, (E) weekly minimum relative humidity in 2011–2015, (F) weekly precipitation in 2011–2015. This figure appears in color at www.ajtmh.org.
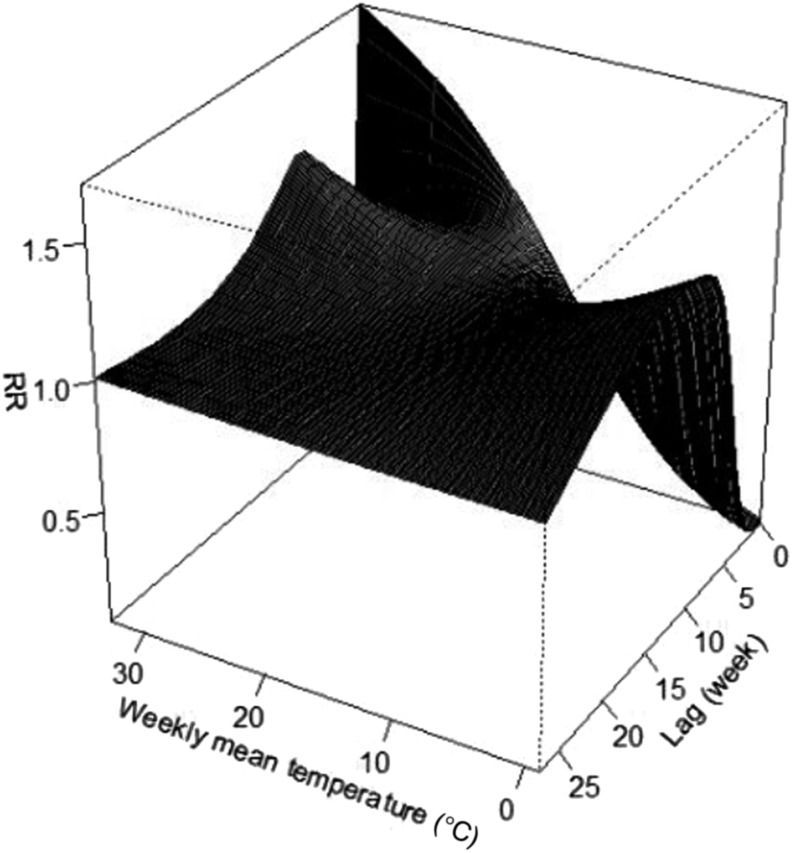
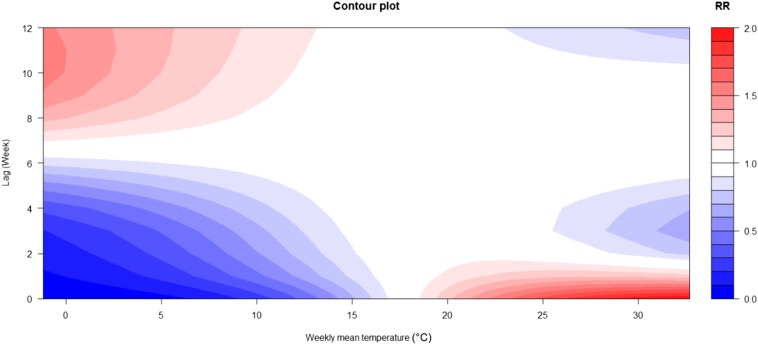
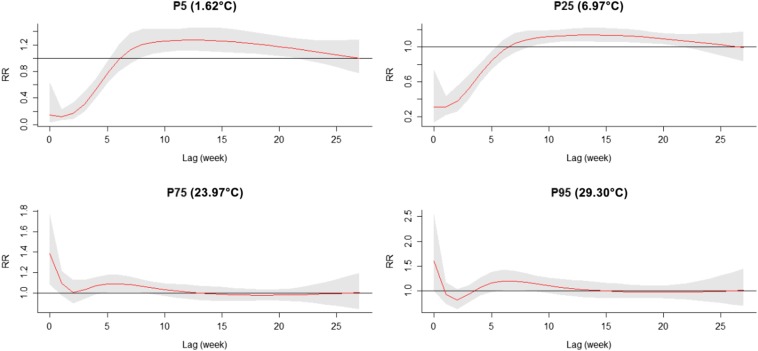
The three-dimensional relationship between weekly mean temperature and SFTS cases along 27 lag weeks was also analyzed (Figure 3). The estimated effects of temperature on SFTS incidence were nonlinear, with a larger RR at the higher temperature by lag 0. Of note, different temperatures showed different lag periods and the corresponding contour plots of RR at different lags and temperatures are summarized in Figure 4. The two figures indicated that the high temperatures had acute and short-term effects and declined quickly over time, whereas the effects in low temperature ranges were persistent over longer lag periods. Figure 5 illustrates the RR by lag at specific temperatures (1.62°C, 6.97°C, 23.97°C, and 29.30°C), corresponding approximately to the 5th, 25th, 75th, and 95th percentiles of weekly mean temperature distribution. The figure also suggests that the relationship between temperature and SFTS had a different lag pattern and high temperatures had short-term effects. The higher temperatures (23.97°C and 29.30°C) had the maximum RR for SFTS cases on the current week, which decreased quickly during the following weeks. However, the low temperatures (1.62°C and 6.97°C) had the minimum RR on the current week and had the maximum RR at lag 13 weeks, which decreased slowly during the following weeks. Details of RR at different temperatures and lag weeks are summarized in Table 2. The effects of lower temperatures (1.62°C and 6.97°C) could last 24 weeks, but the effect of 29.30°C was not significant at lag 8 weeks.
Figure 3.
Three-dimensional plot of the relationship between weekly mean temperature and severe fever with thrombocytopenia syndrome (SFTS) over 27 lag weeks. The estimated effects of temperature on SFTS incidence were nonlinear, with a larger relative risk (RR) at the high temperature.
Figure 4.
The contour plots of weekly mean temperature denotes relative risk. Higher temperatures had acute and short-term effects and declined quickly over time, whereas the effects in lower temperature ranges were persistent over longer lag periods. This figure appears in color at www.ajtmh.org.
Figure 5.
Plot of relative risk (RR) by lag at specific temperatures. The relationship between temperature and severe fever with thrombocytopenia syndrome (SFTS) showed a different lag pattern and high temperatures had short-term effects. The higher temperatures (23.97°C and 29.30°C) had the maximum RR for SFTS cases on the current week, which decreased quickly during the following weeks. However, the low temperatures (1.62°C and 6.97°C) had the minimum RR on the current week and had the maximum RR at lag 13 weeks, which decreased slowly during the following weeks. This figure appears in color at www.ajtmh.org.
Table 2.
The relative risks of different temperatures at different lag weeks
| RR (95% CI) of lag 0 | RR (95% CI) of lag 0–8 | RR (95% CI) of lag 0–16 | RR (95% CI) of lag 0–24 | |
|---|---|---|---|---|
| P5 (1.62°C) | 0.14 (0.03, 0.64) | 0 (0, 0.0048) | 0 (0, 0.05) | 0.01 (0, 0.39) |
| P25 (6.97°C) | 0.31 (0.13, 0.74) | 0.01 (0, 0.04) | 0.03 (0, 0.12) | 0.06 (0.01, 0.38) |
| P75 (23.97°C) | 1.39 (1.09, 1.77) | 2.31 (1.29, 4.12) | 2.49 (1.10, 5.65) | 2.19 (0.64, 7.47) |
| P95 (29.30°C) | 1.60 (1.01, 2.55) | 2.43 (0.70, 8.47) | 3.57 (0.48, 26.59) | 3.10 (0.16, 59.21) |
CI = confidence interval; RR = relative risk.
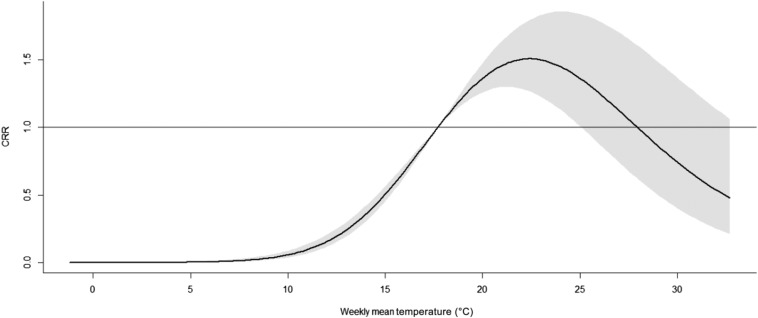
The RR of cumulative exposure to weekly mean temperature over 27 weeks for SFTS cases showed that the exposure–response curve had an approximately reversed U-shape (Figure 6). The RR increased with the increment of temperature and it reached the peak at 23°C and then turned to decrease.
Figure 6.
Overall relative risks of weekly mean temperature for total severe fever with thrombocytopenia syndrome cases over 27 weeks. The exposure–response curve was approximately reversed U-shaped. The relative risk increased with the increment of temperature and reached the peak at 23°C and then turned to decrease. CRR = cumulative relative risk.
DISCUSSION
Some previous studies informed that SFTS incidence was associated with meteorological factors and environmental factors. Liu et al.19 reported that the spatial variations of SFTS incidence were significantly associated with shrub, forest, and rain-fed cropland areas. Du et al.20 reported that the key environmental factors affecting SFTS occurrence were temperature, precipitation, land cover, normalized difference vegetation index, and duration of sunshine. Wang et al.21 identified the density of cattle, rain-fed cropland, built-up land, temperature, and relative humidity as independent risk factors for the distribution of SFTS. Zhai et al.22 suggested that monthly average atmospheric pressure, monthly average temperature, and monthly average relative humidity were associated with SFTS incidence. However, all these studies neglected the nonlinear relationship between factors and SFTS, and lagged effects of factors.
Distributed lag nonlinear model has been widely used in the analysis of the burden of ambient air pollution on years of life lost, effects of ambient temperature on stroke hospital admissions, short-term effect of ambient temperature on mortality, and so on.23–25 Furthermore, DLNM has also been used in the study of associations between meteorological factors and communicable diseases. Xiang et al.26 found reversed U-shaped nonlinear associations between ambient temperature, relative humidity, extreme wind velocity, and dengue. More researchers explored the associations between meteorological factors and hand, foot, and mouth disease.27–29 But no studies on the associations between meteorological factors and SFTS were conducted using DLNM to date.
In this study, we explored the association between temperature and SFTS incidence in the study area from 2011 to 2015. To the best of our knowledge, this is the first report targeted at lagged effects and the nonlinear associations between temperature and SFTS. The results showed that there were lagged effects of temperature on SFTS. Severe fever with thrombocytopenia syndrome virus is mainly transmitted through tick bites and temperature can influence tick population dynamics. Temperatures ranging 20–24°C may lead to higher tick densities and further breeding in subsequent generations. In addition, temperature may influence the incubation period of SFTSV and human exposure to ticks. Humans are more likely to spent time on outdoor activities at temperatures ranging 20–24°C. Therefore, the accumulative lag effect of temperature change on the risk of SFTSV transmission may be remarkable.
Of note, our results also indicated that different temperatures had different lag patterns, high temperatures had acute and short-term effects and declined quickly over time, whereas the effects at low temperature ranges were persistent over longer lag periods. Low temperatures had lagged effects for more than 24 weeks, but high temperatures had lagged effects for not more than 8 weeks. Further study is needed to investigate the underlying mechanism of these different lag patterns.
Reversed U-shaped nonlinear associations were found between weekly mean temperature and SFTS. This result indicates that there are threshold temperatures for SFTS transmission. Some factors may contribute to the result. Haemaphysalis longicornis is confirmed to be the main reservoir and vector for SFTSV.12 A previous study reported that the optimal temperature range for the growth and reproduction of H. longicornis was 20–24°C.30 The result that RR peaked at 23°C in our study is consistent with the result of that study.
There are several limitations to our study. First, the data on SFTS cases were collected from the China Information System for Diseases Control and Prevention, which is passive surveillance. Underreporting may occur because of poor detection capability and availability of health facilities. Second, our study was based on data collected from a contiguous area. The results from this study might not be generalized to other regions with different temperature zones. Third, our study examined the effect of temperature on SFTS on a weekly scale, which may affect the accuracy of exposure assessment.
In summary, our study revealed a nonlinear relationship between weekly temperature and SFTS. The exposure–response curve was approximately reversed U-shaped. High temperatures had acute and short-term effects, whereas low temperatures had persistent and long-term effects. Our study provides information to better understand the effect of temperature variation on SFTS and may have policy implications for disease prevention and control.
Ethics approval.
Ethical approval for the study was obtained from the Chinese Center for Control and Prevention Ethical Committee (No. 201214). All data were anonymized to protect patient confidentiality.
Acknowledgments:
We thank the staff members at the hospitals; local health departments; and county-, district-, prefecture-, and provincial-level CDCs for their valuable assistance in coordinating the data collection.
REFERENCES
- 1.Yu XJ, et al. 2011. Fever with thrombocytopenia associated with a novel bunyavirus in China. N Engl J Med 364: 1523–1532. [DOI] [PMC free article] [PubMed] [Google Scholar]
- 2.Xu B, et al. 2011. Metagenomic analysis of fever, thrombocytopenia and leukopenia syndrome (FTLS) in Henan province, China: discovery of a new bunyavirus. PLoS Pathog 7: e1002369. [DOI] [PMC free article] [PubMed] [Google Scholar]
- 3.Ding F, et al. 2013. Epidemiologic features of severe fever with thrombocytopenia syndrome in China, 2011–2012. Clin Infect Dis 56: 1682–1683. [DOI] [PubMed] [Google Scholar]
- 4.Liu K, et al. 2015. A national assessment of the epidemiology of severe fever with thrombocytopenia syndrome, China. Sci Rep 5: 9679. [DOI] [PMC free article] [PubMed] [Google Scholar]
- 5.Liu Q, He B, Huang SY, Wei F, Zhu X, 2014. Severe fever with thrombocytopenia syndrome, an emerging tick-borne zoonosis. Lancet Infect Dis 14: 763–772. [DOI] [PubMed] [Google Scholar]
- 6.Sun J, Lu L, Wu H, Yang J, Ren J, Liu Q, 2017. The changing epidemiological characteristics of severe fever with thrombocytopenia syndrome in China, 2011–2016. Sci Rep 7: 9236. [DOI] [PMC free article] [PubMed] [Google Scholar]
- 7.McMullan LK, et al. 2012. A new Phlebovirus associated with severe febrile illness in Missouri. N Engl J Med 367: 834–841. [DOI] [PubMed] [Google Scholar]
- 8.Takahashi T, et al. 2014. The first identification and retrospective study of severe fever with thrombocytopenia syndrome in Japan. J Infect Dis 209: 816–827. [DOI] [PMC free article] [PubMed] [Google Scholar]
- 9.Shin J, Kwon D, Youn SK, Park JH, 2015. Characteristics and factors associated with death among patients hospitalized for severe fever with thrombocytopenia syndrome, South Korea, 2013. Emerg Infect Dis 21: 1704–1710. [DOI] [PMC free article] [PubMed] [Google Scholar]
- 10.Denic S, Janbeih J, Nair S, Conca W, Tariq WU, Al-Salam S, 2011. Acute thrombocytopenia, leucopenia, and multiorgan dysfunction: the first case of SFTS bunyavirus outside China? Case Rep Infect Dis 2011: 204056. [DOI] [PMC free article] [PubMed] [Google Scholar]
- 11.Gai Z, et al. 2012. Person to person transmission of severe fever with thrombocytopenia syndrome bunyavirus through blood contact. Clin Infect Dis 54: 249–252. [DOI] [PMC free article] [PubMed] [Google Scholar]
- 12.Luo LM, et al. 2015. Haemaphysalis longicornis ticks as reservoir and vector of severe fever with thrombocytopenia syndrome virus in China. Emerg Infect Dis 21: 1770–1776. [DOI] [PMC free article] [PubMed] [Google Scholar]
- 13.Liu Y, Li Q, Hu W, Wu J, Wang Y, Mei L, Walker DH, Ren J, Wang Y, Yu XJ, 2012. Person-to-person transmission of severe fever with thrombocytopenia syndrome virus. Vector Borne Zoonotic Dis 12: 156–160. [DOI] [PubMed] [Google Scholar]
- 14.Gong Z, et al. 2015. Probable aerosol transmission of severe fever with thrombocytopenia syndrome virus in southeastern China. Clin Microbiol Infect 21: 1115–1120. [DOI] [PubMed] [Google Scholar]
- 15.Tang X, et al. 2013. Human-to-human transmission of severe fever with thrombocytopenia syndrome bunyavirus through contact with infectious blood. J Infect Dis 207: 736–739. [DOI] [PubMed] [Google Scholar]
- 16.Bao CJ, et al. 2011. A family cluster of infections by a newly recognized bunyavirus in eastern China, 2007: further evidence of person-to-person transmission. Clin Infect Dis 53: 1208–1214. [DOI] [PubMed] [Google Scholar]
- 17.Gasparrini A, 2011. Distributed lag linear and non-linear models in R: the package dlnm. J Stat Softw 43: 1–20. [PMC free article] [PubMed] [Google Scholar]
- 18.Chinese Ministry of Health , 2010. The National Guidelines for Control and Prevention of Severe Fever with Thrombocytopenia Syndrome Beijing, China: Chinese Ministry of Health. Available at: http://www.moh.gov.cn/mohwsyjbgs/s8348/201010/49272.shtml. Accessed September 29, 2010.
- 19.Liu K, et al. 2014. Epidemiologic features and environmental risk factors of severe fever with thrombocytopenia syndrome, Xinyang, China. PLoS Negl Trop Dis 8: e2820. [DOI] [PMC free article] [PubMed] [Google Scholar]
- 20.Du Z, Wang Z, Liu Y, Wang H, Xue F, Liu Y, 2014. Ecological niche modeling for predicting the potential risk areas of severe fever with thrombocytopenia syndrome. Int J Infect Dis 26: 1–8. [DOI] [PubMed] [Google Scholar]
- 21.Wang T, Li XL, Liu M, Song XJ, Zhang H, Wang YB, Tian BP, Xing XS, Li SY, 2017. Epidemiological characteristics and environmental risk factors of severe fever with thrombocytopenia syndrome in Hubei province, China, from 2011 to 2016. Front Microbiol 8: 387. [DOI] [PMC free article] [PubMed] [Google Scholar]
- 22.Zhai Y, Li F, Shang X, He F, Lin J, 2016. A study on the association between meteorological factors and severe fever with thrombocytopenia syndrome. Zhejiang Prev Med 28: 117–120. [Google Scholar]
- 23.Zhu J, et al. 2017. The burden of ambient air pollution on years of life lost in Wuxi, China, 2012–2015: a time-series study using a distributed lag non-linear model. Environ Pollut 224: 689–697. [DOI] [PubMed] [Google Scholar]
- 24.Guo P, Zheng M, Feng W, Wu J, Deng C, Luo G, Wang L, Pan B, Liu H, 2017. Effects of ambient temperature on stroke hospital admissions: results from a time-series analysis of 104,432 strokes in Guangzhou, China. Sci Total Environ 15: 307–315. [DOI] [PubMed] [Google Scholar]
- 25.Zhang Y, Li C, Feng R, Zhu Y, Wu K, Tan X, Ma L, 2016. The short-term effect of ambient temperature on mortality in Wuhan, China: a time-series study using a distributed lag non-linear model. Int J Environ Res Public Health 18: 13. [DOI] [PMC free article] [PubMed] [Google Scholar]
- 26.Xiang J, et al. 2017. Association between dengue fever incidence and meteorological factors in Guangzhou, China, 2005–2014. Environ Res 153: 17–26. [DOI] [PubMed] [Google Scholar]
- 27.Zhao D, et al. 2017. Impact of weather factors on hand, foot and mouth disease, and its role in short-term incidence trend forecast in Huainan city, Anhui province. Int J Biometeorol 61: 453–461. [DOI] [PubMed] [Google Scholar]
- 28.Huang R, Bian G, He T, Chen L, Xu G, 2016. Effects of meteorological parameters and PM10 on the incidence of hand, foot, and mouth disease in children in China. Int J Environ Res Public Health 13: 5. [DOI] [PMC free article] [PubMed] [Google Scholar]
- 29.Yin F, Zhang T, Liu L, Lv Q, Li X, 2016. The association between ambient temperature and childhood hand, foot, and mouth disease in Chengdu, China: a distributed lag non-linear analysis. Sci Rep 6: 27305. [DOI] [PMC free article] [PubMed] [Google Scholar]
- 30.Sun J, Wu H, Wang J, Cui B, Liu Q, 2010. Study on Haemaphysalis longicornis eclosion conditions and establishment of laboratory population. Chin Prev Med 11: 196–197. [Google Scholar]


