

Abstract
Neurons in different locations across the cortex are connected through polysynaptic networks involving both excitation and inhibition. To probe the functional impact of such networks we used optogenetic stimulation to trigger antidromic spikes in a local region of primary visual cortex. This local activity caused two effects at distal locations: summation and division. The balance between the two depended on visual contrast, and a normalization model precisely captured these effects.
Neurons in primary visual cortex (V1) receive cortical input not only from neighboring neurons but also from networks of distal intracortical connectivity1: horizontal connections within area V12,3,4 and feedback connections from higher visual areas5. These networks are generally polysynaptic and target both excitatory and inhibitory neurons6,7–10. It is not known whether their overall functional impact is activation or suppression and whether this impact is fixed or depends on other factors. To answer these questions, we measured the causal effect of connectivity across mouse visual cortex in multiple visual contexts.
To evoke spikes reliably and focally in a local region, we developed a novel approach based on antidromic optogenetic stimulation in vivo (Fig. 1). This method builds on previous studies using optogenetic axonal stimulation in vitro 11 and in vivo12. Using in utero electroporation, we expressed Channelrhodopsin-2-Venus (ChR2-Venus) in pyramidal neurons of one hemisphere9,11 (Fig. 1a), obtaining strong expression in layer 2/3 (L2/3, Fig. 1e). We then stimulated the callosal neurons in the binocular zone13 (BZ) using laser pulses targeted to their axon terminals in the contralateral hemisphere (Fig. 1d,f). Contralateral laser stimulation reliably elicited spikes in the BZ, first in layer 2/3 and then in layer 5 (Fig. 1g, Supplementary Figure 1). iGluR blockers abolished all spikes in the deeper layers but not in the superficial layers, confirming that the latter are antidromic (Fig. 1h, Supplementary Figure 1).
Fig. 1.
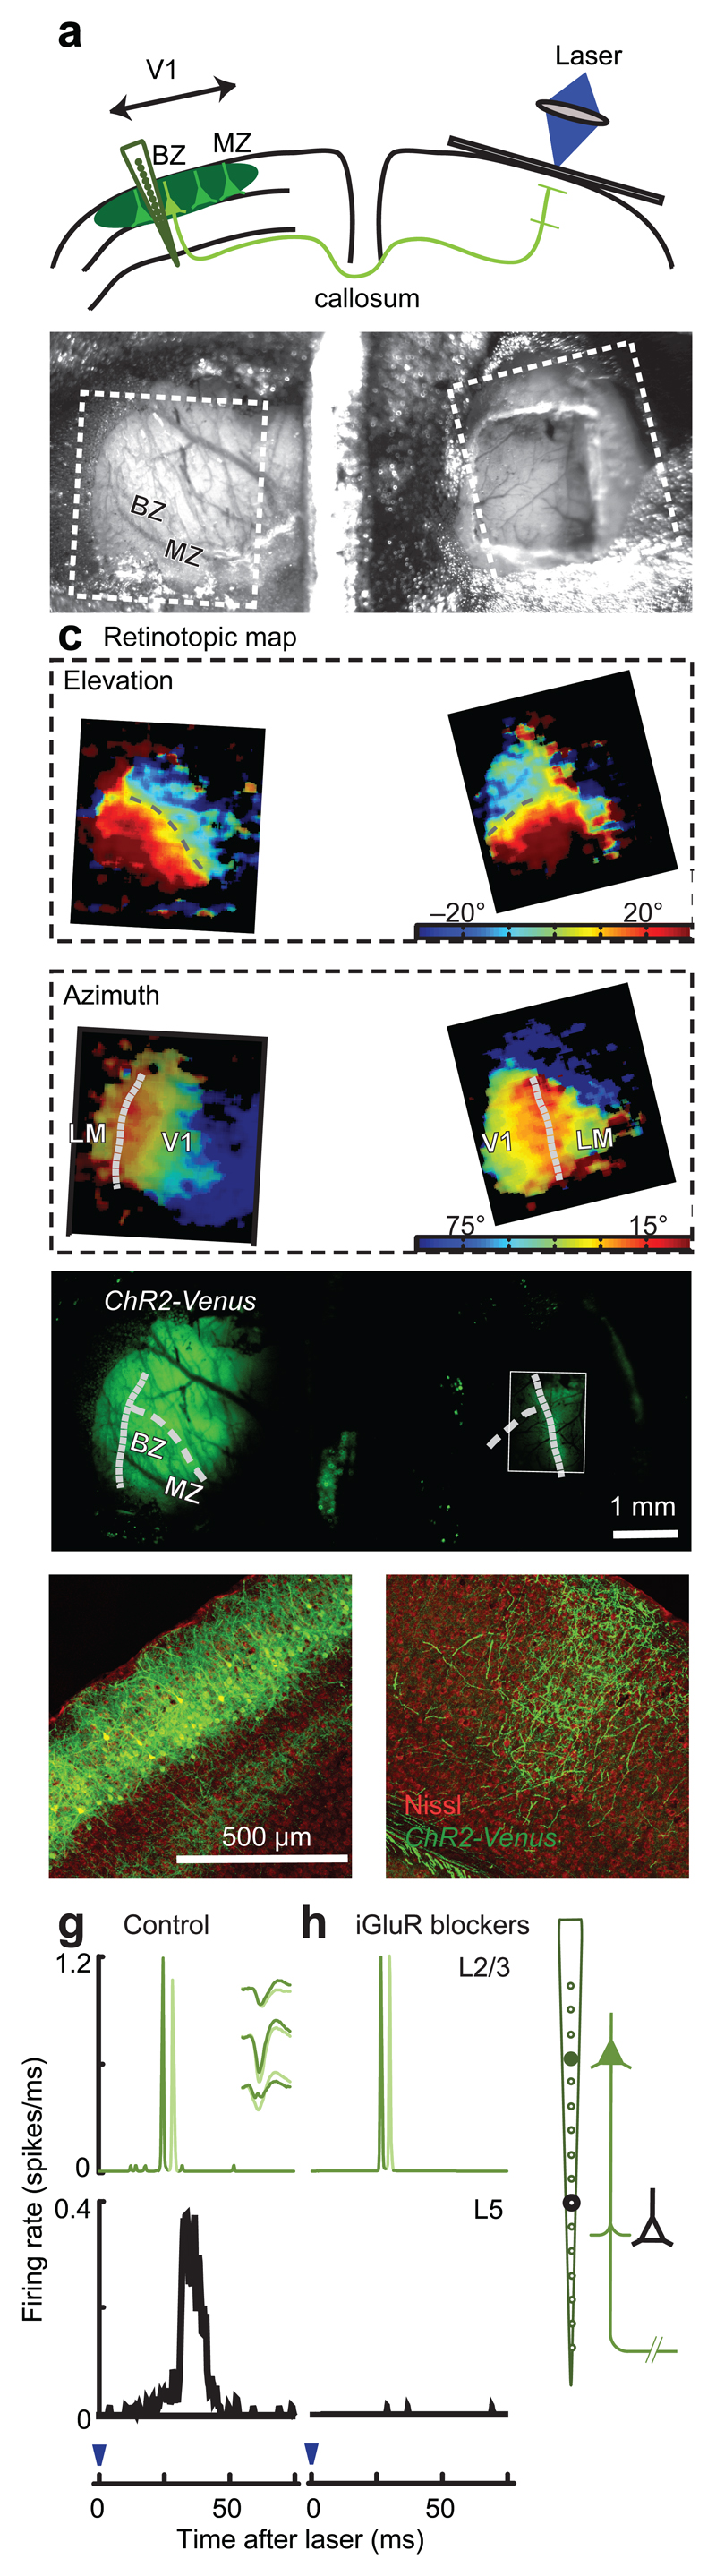
Optogenetic antidromic stimulation for probing cortical connectivity in V1. (a) The targets of optogenetic stimulation are L2/3 neurons in the callosal binocular zone (BZ) in the electroporated hemisphere. MZ: monocular zone. (b) Top view of the chamber allowing access to both hemispheres. Rectangles indicate regions in c. (c) Retinotopic maps obtained via intrinsic imaging. V1 and LM were determined based on reversal of retinotopy. Curves: representation of the vertical meridian (dotted) and horizontal meridian (dashed). (d) Fluorescence image showing expression of ChR2-Venus. Rectangle: callosal band, processed separately to enhance signals. Curves are replotted from c. (e,f) Coronal sections of electroporated (e) and contralateral (f) hemispheres (g) Response histograms for two units in putative L2/3 (top) and one in putative L5 (bottom). Inset: spike shapes of the two units. (g) Same, in the presence of iGluR blockers (CNQX, D-AP5).
The strong early activity evoked locally in the callosal region was often accompanied by weaker, delayed activity in distal V1 sites in the monocular zone (MZ, Fig. 2a-c, Supplementary Figure 2). When measured with local field potentials, this distal activation was stronger and more transient than the activation caused by visual stimuli placed on the vertical meridian; the latter, moreover, was not effective in producing spikes (Supplementary Figure 3).
Fig. 2.

Contrast-dependence of effects of distal activation. Electrodes were placed in the far MZ, and neurons there were stimulated with white noise visual stimuli. (a-c) Firing rate responses of three units in the far MZ (RF center = 85°, 55°, and 75°) to antidromic stimulation of the BZ (solid curves), in the absence of visual stimulation (0% contrast). Dashed curves: activity in control condition. In the first two units, distal stimulation caused activation. Inset: an experimental schematic. (d-f) Same, in the presence of visual contrast (25%, 50%, and 25% contrast). In all units the effect of distal stimulation became suppressive. In the second unit, suppression coexisted with activation. (g-i) Same, at higher contrast (50%, 100% and 50%). In all units the effect of distal stimulation was purely suppressive. Blue arrow: laser pulse time (0 ms). (j-l) Summary of the results for the three units, plotted as the difference in firing rate between control and laser conditions. (m) Summary of the results for all sites. Responses were averaged between 50 and 250 ms after laser onset, in the absence (control) and the presence (laser) of distal activation. Red bars are for sites with activation and suppression (n = 56) and blue for sites with suppression alone (n = 47).
We next repeated these experiments in the presence of increasing visual contrast, and found that the effect of distal intracortical connectivity changed from activation to progressively stronger suppression (Fig. 2d-m). For example, an MZ site that showed clear activation in the absence of visual stimuli (0% contrast, Fig. 2a) showed suppression when its activity was elevated with a stimulus of 25% or 50% contrast (Fig. 2d,g,j). These effects were common across sites (e.g. Fig. 2b,e,h,k), and even sites that showed no activation showed robust suppression (e.g. Fig. 2c,f,i,l, Supplementary Table). Overall, the population of neurons showed a gradual transition from activation to suppression in the presence of increasing contrast (Fig. 2m, Supplementary Figure 4). These effects were seen not only in multiunit activity but also in well-isolated neurons (Supplementary Figure 5).
Activation and suppression exhibited different spatial footprints. Whereas activation could be seen at all locations (first in the BZ and later in the MZ, with decreased amplitude), suppression was present only in the MZ, and especially in the far MZ (Supplementary Figure 6). Suppression, in other words, appeared only in regions that were directly driven by visual stimuli. Moreover, it appeared only when those stimuli had high contrast. This was not due solely to the higher firing rates: suppression was absent in the visual responses to a bar flashed after optogenetic stimulation (Supplementary Figure 7).
To summarize these contrast-dependent effects of distal intracortical connectivity we employed the model of divisive normalization14. In the model, the responses in the far MZ depend on local contrast c as
| (Eq. 1) |
where c50 and n control responsiveness to local contrast, λ indicates the strength of the distal optogenetic stimulation, p and q determine the degree to which the distal site provides activation and suppression.
The model provided good fits to the data, capturing the dependence of the responses on local contrast (Fig. 3a,b), and accounting for 96.4 ± 2.9% (n = 103) of the variance for the individual sites. At sites showing activation, it captured how increasing contrast changed the effect of the optogenetic stimulus from activation to suppression (Fig. 3a). At sites showing only suppression, the model correctly described how suppression effectively scaled the contrast of the visual stimulus, stretching the contrast response curve divisively on the abscissa (Fig. 3b). The two groups of sites shared the same denominator: the only parameter that varied across them was the activation factor p, which was zero in the sites that did not show activation (Fig. 3b).
Fig. 3.

Normalization summarizes the effects of distal activation. (a) Population response as a function of stimulus contrast, for sites showing activation at zero contrast. (b) Same, for sites showing only suppression. Curves: fit of the normalization model (Eq. 1). (c) Effects of changing laser power, for sites showing activation at zero contrast. (d) Same, for the remaining sites. Error bars are median ± median absolute deviation.
The normalization model also predicted the effects of changes in the strength of optogenetic stimulation (Fig. 3c,d). Reducing laser power had similar effects on activation and on suppression: it reduced both (Fig. 3c, Supplementary Figure 8). The model provided good fits to these data, explaining 93.8% of the variance, and capturing the effect of laser intensity with a single parameter, λ (which was set to 0, 0.54, and 1 for laser powers of 0, 25, and 100 mW).
These results demonstrate that the causal, functional effect of distal intracortical connectivity depends on the strength of sensory stimulation in the destination region. If this region is driven weakly, the effect is arithmetical summation. If instead this region is driven strongly, the effect is arithmetical division. For intermediate levels of drive, both effects are present. The exact strength of each is described by a simple normalization equation.
These findings may provide a basis for understanding how the responses of V1 neurons are shaped by lateral interactions across the visual field, and how these interactions depend on visual context14–20. Indeed, many of these interactions can be described by a similar normalization model14. Previous experiments, however, involved recording at one location in V1 while presenting stimuli at local and distal positions in the visual field. As such, these experiments could not clamp distal activity at a given level, and could not directly assess the causal role of this activity in eliciting activation or suppression.
We have introduced a new strategy to probe cortical function using antidromic optogenetic stimulation. This strategy presents fundamental advantages when investigating circuits with reciprocal connectivity: it imposes a level of activity in a local region regardless of the reciprocal inputs that it receives from distal regions. Moreover, because the antidromic stimulus is optogenetic, it is not corrupted by orthodromic effects.
Here, we paired antidromic optogenetic stimulation, with visual stimulation and with recordings at multiple V1 sites. This combination of techniques allowed us to characterize the causal effect, the functional impact, and the arithmetical properties of distal intracortical connectivity. Further research is required to understand the cellular and circuit mechanisms underlying these causal effects, and the behavioral advantages of these computations. Our method of antidromic optogenetic stimulation can play a useful role in enabling such further advances.
Online Methods
Approval for experiments with animals
Experiments were conducted according to the UK Animals (Scientific Procedures) Act, 1986 under personal and project licenses issued by the Home Office following ethical review.
In utero electroporation
In utero electroporation was performed as described previously21,22. E15.5 timed-pregnant C57BL/6 mice (Harlan, UK) were anesthetized with 2% isoflurane in oxygen. Up to 1 μl of DNA solution with Fast Green (Sigma, UK) was pressure-injected into one lateral ventricle of embryos. The solution9,11,23 contained pCAGGS-ChR2-Venus (Addgene 15753, 1.5 μg/μl) and pCAG-mCherry (0.5 μg/μl). Electroporation was achieved with 5 square pulses (50 V, 50 ms, 1 Hz, CUY21, NepaGene, Japan). We used mCherry fluorescence to screen for positive animals at P0. Mice were maintained with a light-dark cycle of 12:12 h, and up to 4 mice were kept in one cage after weaning.
Surgery
Electroporated mice (n = 19, both sexes, 1–2 month old) were anesthetized and prepared for experiments that commonly lasted 8–10 hours. For initial surgery (30-60 min), anesthesia was obtained with ketamine and xylazine. After a tracheotomy animals were placed in a stereotaxic frame, and anesthesia was switched to 2% isoflurane. Temperature was maintained at 37 °C using a feedback-controlled heating pad (TR-200, FST). Carprofen (10 mg/kg), atropine (0.3 mg/kg) and dexamethasone (2 mg/kg) were applied to prevent pain, secretions and brain edema. Eyes were covered with contact lenses (Pmma 003, Veterinary Speciality Products). The eyelids of the unstimulated eye were sutured. A head-plate was implanted to the skull with black dental cement (Ortho-Jet powder, Lang Dental). A cranial window was embedded at the callosal stimulation side (Fig.1b). Only animals showing a clear Venus-labeled callosal band (Fig.1d) (Ref. 22) were used for subsequent measurements.
Intrinsic imaging
In every animal, we obtained retinotopic maps for elevation and azimuth (Fig. 1c) to identify the location of V1 in both hemispheres (Fig.1c). Optical images were obtained using a CMOS camera (MV-D1024E-CL, PhotonFocus) controlled by custom software. We imaged the surface vascular pattern with green light (525 nm) and obtained intrinsic signal images with red light (625 nm, LEDC_HB02-G-R, Doric). Images were acquired at 10 Hz frame rate. The intrinsic signal was analyzed for 5 s after the onset of 4 s long visual stimuli.
Electrophysiology
Having identified the position of V1 we performed a craniotomy (usually 500 x 500 µm, 500 × 1750 µm for a multi-shank electrode) and a durotomy (for multi-shank electrodes), and covered the brain with 1% agarose. Anesthesia was then continued at a lower concentration of isoflurane (0.125–0.5%), supplemented with chlorprothixene (1 mg/kg, Sigma). A multichannel silicon probe mounted on a micromanipulator (Junior, Luigs&Neumann) was slowly advanced into the brain (depth 700–900 µm), and recording started 20 min after the insertion. Insertion was targeted to a retinotopic area with ˜20° elevation (the center of an LCD monitor) and azimuth of 0–90° within V1, based on retinotopic maps (Fig. 1d). Voltage signals were amplified and digitized at 30 kHz (Cerebus, Blackrock Microsystems). Probes had a single shank (A1x16-5mm-50-703, A1x32-Edge-5mm-50-177, NeuroNexus) or multiple shanks (A2x16-5mm-50-413, A4x8-5mm-50-400-413). With single-shank probes, insertion was occasionally performed twice in the same preparation.
For blockade of ionotropic glutamate receptors (iGluR), we applied a mixture of CNQX and D-AP5 (2 mM in HEPES-buffered ACSF, Tocris) to the dura surface without agarose. Pharmacological effects were evaluated at least 15 min after application.
Optogenetic stimulation
To stimulate callosal terminals optogenetically, we used a blue laser (MBL-III-473nm-150mW, CNI). The laser was directed into an optical fiber (200µm diameter), and laser output from the fiber was refocused onto callosal band with two convex lenses (f1/f2=0.33) at an incident angle of 30°, as an ellipse (666 µm in mediolateral axis, 770 µm in anteroposterior axis). Vertical retinotopic positions of recording and stimulating sites were aligned. Callosal neurons sending projections to the BZ of contralateral V1 are the target of this stimulation, and they are known to lie in the BZ (Ref. 24), mostly in V1 (Ref. 13).
We set the laser power at the focus point to 100 mW, providing ~250 mW/mm2 at the dura surface. This intensity attenuates by half within 100 µm inside cortical tissue25. We estimated from a previous report 23 that this intensity would activate < 70 % of ChR2-expressing axons. This intensity is reported to cause no damage even with illumination lasting 1 s (Ref. 26) or even 30 s (Ref. 27). Laser illumination lasted 2 ms and was controlled with a high-speed shutter (LS3T2, Uniblitz). A small fraction of laser output was monitored with a photodiode (PDA100A, Thorlabs). The interstimulus interval was > 3 s. In two animals, we also tested the effect of lower laser power (25 mW, Fig. 3c,d), using an ND filter (OD 0.6) mounted on a motorized wheel (FW103, Thorlabs).
Visual stimulation
Visual stimuli were presented on an LCD monitor (E2607WS, Iiyama, mean luminance 50 cd/m2, refresh rate 75Hz, gamma corrected), covering an angle of 100° horizontal and 65° vertical in the visual hemifield contralateral to the imaging or recording side.
For intrinsic imaging, flickering vertical black and white bars (spatial frequency 0.05 cycles/deg, temporal frequency 2 Hz, 100% contrast, duration 4 s) were presented at various azimuths, to obtain a horizontal retinotopic map. For a vertical map, we used horizontal bars.
For electrophysiology, we first presented a contrast-reversing square checkerboard (0.03 cpd, 2 Hz, 100%, 2 s) to identify the depth of presumed layer 4 (Ref. 28). We then presented flickering vertical or horizontal bars (0.06 cpd, 1 Hz, 100%, 1 s) to measure retinotopic tuning at the recording site (Supplementary Fig.2b). We then presented dynamic white noise (bright and dark 6° sized-squares, 10.7 frames/s, 1.6 s) covering the far monocular visual field (55–95° azimuth, Fig.2). The random noise was different across blocks but the same within blocks. There were at least 50 blocks, and each block involved 6–15 conditions in random order, the combination of 3-5 contrasts (0, 12, 25, 50 or 100%) and laser stimulation (0, 25 or 100 mW). The laser was activated 1 s after the noise onset.
Histology
After a terminal dose of ketamine/xylazine, mice (n = 3) were perfused with PBS, followed by 4% formaldehyde-PBS. Brains were harvested and placed in 30% sucrose solution for 24 hours. Coronal brain sections of 40 μm were cut using a cyrostat (CM1850, Leica), stained with Fluorescent Nissl (Invitrogen), and mounted in DAPI-containing Vectashield (Vector Labs). Confocal microscopy was performed on LSM 710 (Zeiss).
Data analysis
Data were analyzed in MATLAB (MathWorks). After bandpass filtering between 0.25–7.5 kHz, unit activity was extracted off-line using a template-matching algorithm based on a mean square distance metric17. This approach does not distinguish single neurons and multiunit activity, so we also performed detailed spike-sorting based on PCA analysis on one dataset (Supplementary Figure 5). The spike sorting algorithm, MaskedKlustaKwik is an improvement of KlustaKwik designed for dense electrode arrays (Kadir, S.N., Goodman, D.F.M., Schulman, J., Buzsaki, G., and Harris, K.D., Soc. Neurosci. Abs. 2012).
We pooled responses across neurons by considering the multiunit activity at each electrode site. We classified our units based on their retinotopic preferences, which could lie on the callosal zone (0–15° Ref. 24), the acallosal zone (> 15°), BZ (0–30°, Ref. 29) and MZ (> 30°). Firing rates were obtained at 12.5 ms resolution by smoothing spike trains with a Gaussian window (σ = 12.5 ms). In the callosal BZ, a higher resolution was also used (125 µs), to characterize the layer differences (Fig. 2e).
Local field potentials (LFPs) were low pass-filtered at 2 kHz. To obtain current source density (CSD) profiles30, we first subtracted a baseline component of LFP for each channel, using the 50 ms period before the laser stimulation or flickering checkerboard visual stimulation. Then, we duplicated the uppermost and lowermost LFP traces, and calculated the second derivative along the depth axis. To generate color images of CSD we also performed linear interpolation along the depth axis and Gaussian-smoothing. The cortical depth of presumed L4 was determined from the responses to flickering checkerboards as the earliest CSD sink or the earliest negative LFP deflection28. Units above the presumed L4 were classified as superficial, and below as deep.
To evaluate the effect of callosal laser stimulation on each unit, we considered the spike count per 25 ms-bin over a range of 0–600 ms after laser onset time. For each block and each visual contrast presented, we made pairwise comparisons of spike count between the conditions with and without laser stimulation (Wilcoxon signed rank test with Bonferroni correction, p < 0.05). For suppressive effects, we used 50 ms bin width because of the slower time course. We measured the effect of distal intracortical connectivity as the difference in firing rate between control condition and laser condition (Fig. 2, Supplementary Figure 4-6,). We normalized the difference curves in the far MZ (Fig.3e-j), by dividing by the r100 of the fitted contrast-response curve (see below).
Statistical analysis
All the statistical tests were non-parametric, and indicated in the main text or figure legend. Our sample size was always larger than the minimum size that can yield p < 0.05 for each test. Data and bar plots were shown as median ± median absolute deviation, because they are robust to outliers.
Model fits
For units in the far MZ, we considered the firing rate 50–250 ms after laser onset time, when a maximal change could be expected (Supplementary Figure 6a, Fig. 2m). We first fit the firing rate of the control condition (no laser) with a hyperbolic ratio function11
where r0 is the baseline firing rate, rmax is the maximum rate, c50 is the semisaturation contrast, and n is a constant determining the slope of the function. The values of r0 and r100 were then used to normalize each unit’s response to values R ranging from 0 to 1. We then fitted the control responses together with the responses measured with laser stimulation using the full normalization equation11 (Equation 1). We imposed the same c50 and n, and obtained parameters p and q. To fit population curves in Fig. 3a,b, we fit the three curves simultaneously. For response with different laser power (0, 25 and 100 mW, Fig. 3c,d), we imposed the same c50, n, p and q, while allowing for changes in λ (0 for control, 1 for 100mW, and intermediate for 25 mW).
Model parameters were obtained by weighted least squares fit, and fit quality was assessed by the percentage of variance in the responses R explained by the model predictions m:
where the indices i indicate one of visual contrasts and R̅ is the mean of the responses.
Supplementary Material
Acknowledgments
We thank Toshihiko Hosoya and Hisato Maruoka for training us in in utero electroporation, Andrea Benucci for help with intrinsic imaging, Shabnam Kadir, Michael Krumin, Neel Dhruv and Kenneth Harris for help with spike sorting, Charu Reddy, Bilal Haider, James Cottam, Ikuko Smith, Matteo Rizzi and members of the laboratory of Robin Ali for technical help, Karel Svoboda for a gift of pCAGGS-ChR2-Venus, Hiroshi Kawasaki for a gift of pCAG-mCherry, and Massimo Scanziani and members of our laboratories for helpful suggestions. This work was supported by the Medical Research Council, the European Research Council and the Wellcome Trust. MC holds the GlaxoSmithKline / Fight for Sight chair in Visual Neuroscience.
Footnotes
Author Contributions
T.K.S., M.H. and M.C. designed the study. T.K.S. performed the experiments. T.K.S and M.C. analyzed the data. T.K.S., M.H. and M.C. wrote the paper.
Competing Financial interests
The authors declare no competing financial interests.
References
- 1.Schuz A, Chaimow D, Liewald D, Dortenman M. Cereb Cortex. 2006;16:1474–1486. doi: 10.1093/cercor/bhj085. [DOI] [PubMed] [Google Scholar]
- 2.Gilbert CD, Wiesel TN. J Neurosci. 1989;9:2432–2442. doi: 10.1523/JNEUROSCI.09-07-02432.1989. [DOI] [PMC free article] [PubMed] [Google Scholar]
- 3.Bosking WH, Zhang Y, Schofield B, Fitzpatrick D. J Neurosci. 1997;17:2112–2127. doi: 10.1523/JNEUROSCI.17-06-02112.1997. [DOI] [PMC free article] [PubMed] [Google Scholar]
- 4.Adesnik H, Bruns W, Taniguchi H, Huang ZJ, Scanziani M. Nature. 2012;490:226–231. doi: 10.1038/nature11526. [DOI] [PMC free article] [PubMed] [Google Scholar]
- 5.Angelucci A, Bressloff PC. Prog Brain Res. 2006;154:93–120. doi: 10.1016/S0079-6123(06)54005-1. [DOI] [PubMed] [Google Scholar]
- 6.McGuire BA, Gilbert CD, Rivlin PK, Wiesel TN. J Comp Neurol. 1991;305:370–392. doi: 10.1002/cne.903050303. [DOI] [PubMed] [Google Scholar]
- 7.Anderson JC, Martin KA. J Neurosci. 2009;29:11283–11293. doi: 10.1523/JNEUROSCI.5757-08.2009. [DOI] [PMC free article] [PubMed] [Google Scholar]
- 8.Hirsch JA, Gilbert CD. J Neurosci. 1991;11:1800–1809. doi: 10.1523/JNEUROSCI.11-06-01800.1991. [DOI] [PMC free article] [PubMed] [Google Scholar]
- 9.Adesnik H, Scanziani M. Nature. 2010;464:1155–1160. doi: 10.1038/nature08935. [DOI] [PMC free article] [PubMed] [Google Scholar]
- 10.Dong H, Shao Z, Nerbonne JM, Burkhalter A. J Comp Neurol. 2004;475:361–373. doi: 10.1002/cne.20164. [DOI] [PubMed] [Google Scholar]
- 11.Petreanu L, Huber D, Sobczyk A, Svoboda K. Nat Neurosci. 2007;10:663–668. doi: 10.1038/nn1891. [DOI] [PubMed] [Google Scholar]
- 12.Lee JH, et al. Nature. 2010;465:788–792. doi: 10.1038/nature09108. [DOI] [PMC free article] [PubMed] [Google Scholar]
- 13.Olavarria JF, Hiroi R. J Comp Neurol. 2003;459:156–172. doi: 10.1002/cne.10615. [DOI] [PubMed] [Google Scholar]
- 14.Carandini M, Heeger DJ. Nat Rev Neurosci. 2012;13:51–62. doi: 10.1038/nrn3136. [DOI] [PMC free article] [PubMed] [Google Scholar]
- 15.Levitt JB, Lund JS. Nature. 1996;387:73–76. doi: 10.1038/387073a0. [DOI] [PubMed] [Google Scholar]
- 16.Sceniak MP, Ringach DL, Hawken MJ, Shapley R. Nat Neurosci. 1999;2:733–739. doi: 10.1038/11197. [DOI] [PubMed] [Google Scholar]
- 17.Nauhaus I, Busse L, Carandini M, Ringach DL. Nat Neurosci. 2009;12:70–76. doi: 10.1038/nn.2232. [DOI] [PMC free article] [PubMed] [Google Scholar]
- 18.Kapadia MK, Westheimer G, Gilbert CD. Proc Natl Acad Sci USA. 1999;96:12073–12078. doi: 10.1073/pnas.96.21.12073. [DOI] [PMC free article] [PubMed] [Google Scholar]
- 19.Somers DC, et al. Cereb Cortex. 1998;8:204–217. doi: 10.1093/cercor/8.3.204. [DOI] [PubMed] [Google Scholar]
- 20.Polat U, Mizobe K, Pettet MW, Kasamatsu T, Norcia AM. Nature. 1998;391:580–584. doi: 10.1038/35372. [DOI] [PubMed] [Google Scholar]
- 21.Saito T, Nakatsuji N. Dev Biol. 2001;240:237–246. doi: 10.1006/dbio.2001.0439. [DOI] [PubMed] [Google Scholar]
- 22.Mizuno H, Hirano T, Tagawa Y. J Neurosci. 2007;27:6760–6770. doi: 10.1523/JNEUROSCI.1215-07.2007. [DOI] [PMC free article] [PubMed] [Google Scholar]
- 23.Huber D, et al. Nature. 2008;451:61–64. doi: 10.1038/nature06445. [DOI] [PMC free article] [PubMed] [Google Scholar]
- 24.Wang Q, Burkhalter A. J Comp Neurol. 2007;502:339–357. doi: 10.1002/cne.21286. [DOI] [PubMed] [Google Scholar]
- 25.Aravanis AM, et al. J Neural Eng. 2007;4:S143–156. doi: 10.1088/1741-2560/4/3/S02. [DOI] [PubMed] [Google Scholar]
- 26.Diester I, et al. Nat Neurosci. 2011;14:387–397. doi: 10.1038/nn.2749. [DOI] [PMC free article] [PubMed] [Google Scholar]
- 27.Anikeeva P, et al. Nat Neurosci. 2012;15:163–170. doi: 10.1038/nn.2992. [DOI] [PMC free article] [PubMed] [Google Scholar]
- 28.Niell CM, Stryker MP. J Neurosci. 2008;28:7520–7536. doi: 10.1523/JNEUROSCI.0623-08.2008. [DOI] [PMC free article] [PubMed] [Google Scholar]
- 29.Wagor E, Mangini NJ, Pearlman AL. J Comp Neurol. 1980;193:187–202. doi: 10.1002/cne.901930113. [DOI] [PubMed] [Google Scholar]
- 30.Bereshpolova Y, Amitai Y, Gusev AG, Stoelzel CR, Swadlow HA. J Neurosci. 2007;27:9392–9399. doi: 10.1523/JNEUROSCI.2218-07.2007. [DOI] [PMC free article] [PubMed] [Google Scholar]
Associated Data
This section collects any data citations, data availability statements, or supplementary materials included in this article.