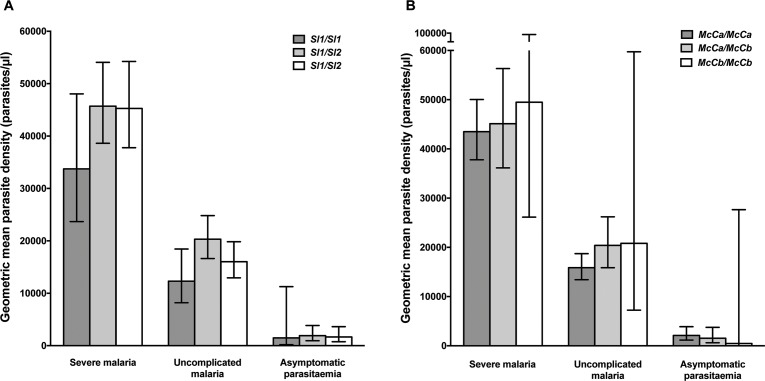
Figure 6. Parasite densities by Sl and McC genotypes.
Geometric mean parasite densities in the Kenyan case-control study (severe malaria) and longitudinal disease cohort study (uncomplicated malaria and asymptomatic parasitaemia) by A) Sl genotypes and B) McC genotypes. The data on severe malaria includes 1695 children: (Sl1/Sl1 (175), Sl1/Sl2 (793), Sl2/Sl2 (727) and McCa/McCa (1167), McCa/McCb (478) and McCb/McCb (50). The data on uncomplicated malaria includes 162 children: (Sl1/Sl1 (16) , Sl1/Sl2 (75), Sl2/Sl2 (71) contributing 124, 488 and 461 episodes respectively and McCa/McCa (107), McCa/McCb (49) and McCb/McCb (6) contributing 699, 349 and 25 episodes, respectively. The data on asymptomatic parasitaemia includes 57 children: (Sl1/Sl1 (5), Sl1/Sl2 (26), Sl2/Sl2 (26) contributing 6, 35 and 35 episodes, respectively, and McCa/McCa (34), McCa/McCb (20) and McCb/McCb (3) contributing 47, 25 and 4 episodes, respectively. Differences in parasite densities by genotype were tested by linear regression analysis with adjustment for HbAS, age as a continuous variable and ABO blood group in the severe malaria cases, HbAS and season (defined into 3-monthly blocks) in the uncomplicated malaria samples and HbAS and ABO blood group in the asymptomatic parasitaemia samples. Data were adjusted for within-person-clustering of events in the uncomplicated malaria and asymptomatic parasitaemia studies. Bars represent 95% confidence intervals.

