Abstract
Most flying-spot optical coherence tomography and optical coherence microscopy (OCM) systems use a symmetric confocal geometry, where the detection path retraces the illumination path starting from and ending with the spatial mode of a single-mode optical fiber. Here we describe a visible light OCM instrument that breaks this symmetry to improve transverse resolution without sacrificing collection efficiency in scattering tissue. This was achieved by overfilling a water immersion objective on the illumination path while maintaining a conventional Gaussian mode detection path (1∕e2 intensity diameter ∼0.82 Airy disks), enabling ∼1.1 μm full width at half-maximum (FWHM) transverse resolution. At the same time, a ∼0.9 μm FWHM axial resolution in tissue, achieved by a broadband visible light source, enabled femtoliter volume resolution. We characterized this instrument according to paraxial coherent microscopy theory and, finally, used it to image the meningeal layers, intravascular red blood cell-free layer, and myelinated axons in the mouse neocortex in vivo through the thinned skull.
OCIS codes: (110.4500) Optical coherence tomography, (170.3880) Medical and biological imaging, (140.7300) Visible lasers
Optical coherence tomography (OCT) [1] performs high-resolution cross-sectional imaging of biological tissue using backscattered light. The tissue penetration depth of quasi-ballistic light measured by OCT ranges from hundreds of micrometers to a few millimeters, depending on the center wavelength, λ0. Thus, a low numerical aperture (NA) is typically used to achieve a depth-of-field (DOF ∼ λ0∕NA2) larger than this penetration depth.
Unlike confocal microscopy, which achieves axial resolution by a confocal pinhole, axial resolution in OCT also derives from the coherence length of a broadband light source. For low NAs, OCT axial resolution is independent of the NA. Low NA enables a large DOF, with the caveat of poor transverse resolution (∼λ0∕2NA). In a version of OCT known as optical coherence microscopy (OCM) [2], high NA objectives improve transverse resolution at the expense of DOF. High transverse resolution OCM has revealed cortical myelination and neuronal cell bodies through intrinsic scattering in the rodent cortex [3–5].
While near-infrared (NIR) and infrared (IR) light image deep in highly scattering brain tissue [4], visible light enables finer resolutions. For a set wavelength bandwidth (Δλ), the OCT axial resolution improves at shorter wavelengths ( ) [6,7]. The diffraction limit (NA = 1) for transverse resolution also improves at shorter wavelengths (∼λ0∕2). Moreover, with a smaller λ0, a target transverse resolution is achieved with a lower NA and larger DOF. However, higher visible light scattering and absorption reduce the penetration depth of quasi-ballistic light used in OCM. Thus, visible light OCM confers advantages for imaging superficial tissue with high volume resolution and a limited penetration depth. While early visible light OCT studies aimed for low resolution spectroscopy [8], more recent visible light OCT and OCM systems have been designed to accommodate higher resolution objectives [7,9].
With few exceptions [10–12], conventional flying-spot OCT and OCM systems use a symmetric confocal imaging geometry, where the detection path retraces the illumination path, resulting in identical illumination and detection point spread functions (PSFs). While such a configuration facilitates optical alignment, this strategy has disadvantages. In particular, to avoid loss of light on the return path, the magnified detection mode, which acts as a confocal pinhole, is usually chosen to be similar to or larger than the Airy disk (diameter of 1.22λ0∕NA), which contains ∼84% of the power diffracted from a circular aperture. If detection and illumination paths are symmetric, this choice results in a non-uniform illumination profile at the limiting aperture, with intensity decreasing away from the optical axis. Thus, the available NA is not utilized effectively, and transverse resolution suffers. In this Letter, by breaking this symmetry, we overfill the aperture to achieve a magnified illumination mode much smaller than the Airy disk, while maintaining a magnified detection mode comparable to the Airy disk for efficient collection. Relative to a conventional design, this strategy improves resolution with a more uniform illumination profile and maintains collection efficiency. As maximum tissue irradiance is limited by potentially unwanted biological responses [13] and since our light source has power to spare, the loss in incident power caused by overfilling can easily be compensated for with no other associated performance tradeoffs.
The three-dimensional (3D) confocal field point spread function (PSF), h(x, y, z), excluding coherence effects, is determined by the illumination and detection modes, imaged onto the sample with magnifications Mill and Mdet, respectively [14]:
| (1) |
where hill (x, y, z) and hdet (x, y, z) are the illumination and detection Airy field patterns, respectively; x and y are transverse dimensions; z is the axial dimension; ∗∗ denotes two-dimensional (2D) transverse convolution; and mf pill(x∕Mill, y∕Mill) and mf pdet (x∕Mdet, y∕Mdet) are magnified mode field patterns (mfp) for illumination and detection, respectively. The terms in square brackets are the illumination and detection PSFs, respectively.
If identical fibers are used in the illumination and detection arms, mfpill = mfpdet. The 1∕e2 mode intensity diameter of the photonic crystal fiber (PCF) used here (LMA5, NKT Photonics, Birkerød, Denmark) is ∼5 μm at 575 nm, with negligible variation across the wavelength, unlike step-index single-mode fibers. For each path, we utilize a two-telescope scanning microscope design, including a distinct collimator (fcoll,ill = 16∕30∕60 mm, fcoll,det = 16 mm), a shared scan lens (fscan = 50 mm), a shared tube lens (ftube = 150 mm), and a shared objective lens (fOBJ = 18 mm for a 10 × ∕0.3 NA water immersion objective). The overfill factor, defined as the ratio of the 1∕e2 intensity beam diameter to the back aperture of the objective (10.8 mm), which is also the limiting aperture, was varied by changing the focal length of the illumination collimator. (The back aperture diameter was verified by wide-angle illumination through a pinhole at the objective focal plane.) The overall magnification of the illumination path is Mill = fOBJ∕ftube × fscan∕fcoll,ill.
While the collimated beam diameter increases with the collimator focal length (fcoll,ill), the objective back aperture limits the entrance beam size. Conventionally, in OCT the focal length of the collimator is chosen so that he overfill factor is <1, ensuring an approximately Gaussian illumination profile, minimal illumination loss, and optimal detection efficiency. With an overfill factor >1, however, the intensity profile at the limiting aperture is more uniform, thus more effectively using the available NA. In this Letter, the longest focal length collimator achieved a 2.44 overfill factor. The overall magnification of the detection path is Mdet = fOBJ∕ftube × fscan/fcoll,det, where fcoll,det is the focal length of the collimator before the detection fiber. By keeping fcoll,det small, the Airy disk remains comparable to or smaller than the magnified detection mode, which acts as a confocal pinhole. Here Mdet is 0.4. The Airy disk diameter, defined by the zero-crossings of hill and hdet in the focal plane, is 1.22λ0∕NA ∼ 2.3 μm. The magnified 1∕e2 mode intensity diameter of the detection fiber corresponds to 0.82 Airy disk diameters. In confocal microscopy, a similar choice ensures a balance between collection efficiency and resolution [15].
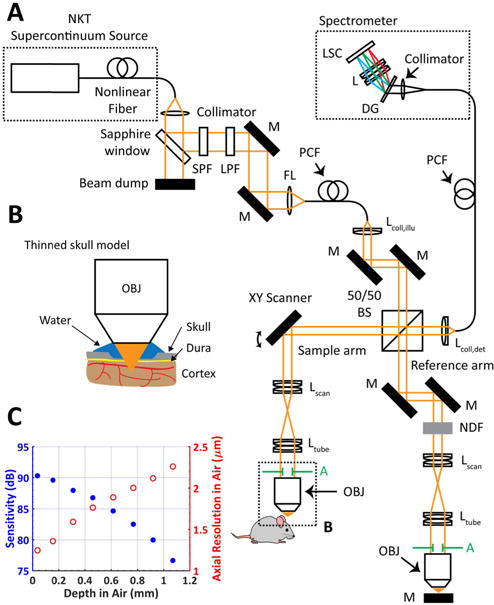
A benchtop visible light spectral/Fourier domain OCM system, employing a free-space beam splitter to separate illumination and detection paths [Fig. 1(A)], was constructed for in vivo imaging of the mouse brain. The system used a supercontinuum (SC) light source (SuperK EXW12, NKT Photonics). The collimated output beam, ∼0.6 mm 1∕e2 intensity diameter at visible wavelengths, was first attenuated by 91% via a 45° Fresnel reflection from an uncoated sapphire window, spectrally filtered to create a visible light spectrum centered at 575 nm, and then coupled into a single-mode PCF. The output of this fiber was then re-collimated into the free-space OCM Michelson interferometer by one of three achromatic doublets (fcoll,ill = 16∕30∕60 mm). The light was split by an anti-reflection coated, non-polarizing, 50/50 beam splitter between the sample and reference arms. In the sample arm, the beam was scanned by a 2D galvanometer scanner (Cambridge Technology) before being expanded 3× by an afocal telescope and focused onto the sample by a 10 × ∕0.3 NA Olympus water immersion objective. The reference arm contained a variable neutral density filter (NDF) and identical optics to the sample arm. The back-reflected beams from both arms were combined by the beam splitter and collected by another collimator-coupled single-mode PCF. The PCF output was directed to a custom-made spectrometer consisting of a 30 mm achromatic doublet, a volume transmission grating (1800 lpmm, Wasatch Photonics, Logan, U.S.), a focusing lens (75 mm achromatic doublet pair), and a complementary metaloxide semiconductor line scan camera (Basler SPL 4096–140 km). The acquisition window of the line scan camera was reduced to 3072 pixels to mitigate data saving time and storage requirements, with a line rate of 70 kHz. The calibrated spectral sampling interval of the system was 0.067 nm, which provided an imaging depth of 1.2 mm in air, or 0.77 μm per pixel after Fourier transformation. Data acquisition was synchronized with scanning as previously described [16]. The average power at the sample for imaging was <1 mW.
Fig. 1.

(A) Visible light OCM system for mouse neocortical imaging with ∼1.13 femtoliter volume resolution. After ∼9% reflection by a sapphire window, light from the SC source traversed a short-pass filter (SPF) and a long-pass filter (LPF) before fiber coupling. The light was split by an anti-reflection coated, non-polarizing, 50/50 beam splitter into the sample and reference arms of a Michelson interferometer. In the sample arm, the beam was scanned by a 2D galvanometer scanner, expanded 3× by a lens pair, and focused on the sample by a 10× water immersion objective with a 10.8 mm diameter back aperture. (M, mirror; L, lens; FL, focusing lens; DG, diffraction grating; LSC, line-scan camera; NDF, neutral density filter; BS, beam splitter; A, limiting aperture). (B) Zoom of the minimally invasive thinned skull model for mouse neocortical imaging. (C) Sensitivity (blue filled circles) and axial resolution (red open circles) are maintained over the light penetration depth of a few hundred micrometers.
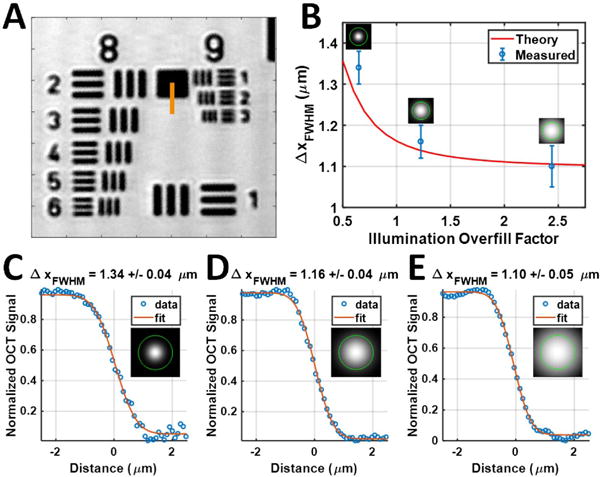
Using illumination collimators with three different focal lengths (fcoll,ill = 16, 30, and 60 mm), we tested three different overfill factors (0.65, 1.23, and 2.44, respectively). The transverse resolution for each collimator was validated by analyzing the edge response function from a high-resolution negative 1951 USAF resolution target (Fig. 2). The transverse resolution for the overfill factor of 2.44 was found to be 1.1 μm, ∼18% better than the symmetric confocal geometry. The axial resolution of the system in air was estimated by measuring the FWHM of the reflectance PSF from a mirror. The best axial resolution was 1.25 μm in air (estimated to be 0.93 μm in tissue with n = 1.38) near the zero delay position, leading to an approximately isotropic volumetric resolution of 1.1 μm(x) × 1.1 μm(y) × 0.93 μm(z) = 1.13 fL.
Fig. 2.

Characterization of transverse resolutions. (A) 1951 USAF resolution test target imaged with an overfill factor of 2.44. (B) By increasing the overfill factor to utilize the objective NA more fully, the theoretical and measured transverse resolutions improved accordingly. (C)–(E) Edge response functions were fit along the orange line in (A) using the error function (erf) to estimate the FWHM of the transverse resolution for overfill factors of (C) 0.65, (D) 1.23, and (E) 2.44. Illumination intensity profiles are shown relative to the back aperture of the objective (green circle).
After the resolution of our visible light OCM system was validated, a C57BL/6 wild type mouse model (N = 3, male, 24–29 g, Charles River) was imaged in vivo. Mice were anesthetized with isoflurane (1–1.5% v/v), adjusted to maintain an appropriate depth of anesthesia, delivered via a gas mixture of 80% medical air and 20% oxygen. Mice were secured in a custom stereotactic frame, and a thinned skull window [17] was created over the parietal cortex to avoid the cerebral edema and inflammation that may result from opening the skull and dura [18]. Compared to visible light reflectance confocal microscopy [19], coherence gating of out-of-focus and multiply scattered light by visible light OCM enables imaging through a more turbid, but less invasive, thinned skull preparation, which preserves both intracranial pressure and the physiological status of neural tissue. In some animals, a 3 mL∕kg injection of Intralipid 20%, an OCT plasma tracer [20], was administered via the tail vein to visualize blood plasma. Procedures and protocols were approved by UC Davis Institutional Animal Care and Use Committee. The OCM scanning protocol (70 kHz A-line rate) sampled each location in a 3D volume over time by acquiring 20 repeated B-scans, each consisting of 1000 A-scans, at 1000 y-locations, yielding a four-dimensional data set with dimensions of 1000 × 1000 × 3072 × 20.
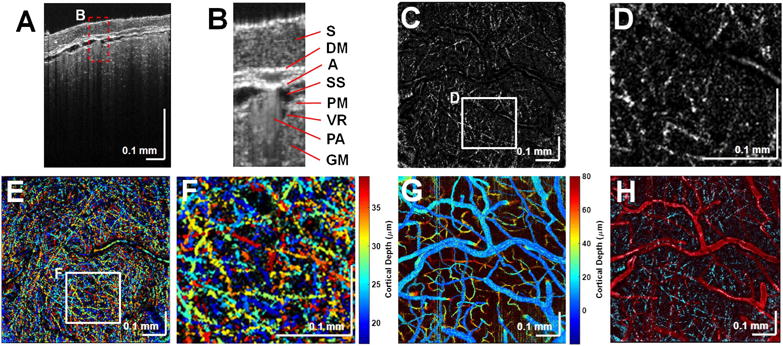
The mouse neocortex was imaged through the thinned skull [Fig. 3(A)]. The ultrahigh axial resolution enabled visualization of the meningeal layers [labeled in Fig. 3(B)]. After background correction and attenuation compensation of OCM data, by performing a maximum intensity projection (MIP) over a 6 μm thick cortical volume, myelinated axons were visualized in the en face plane [Figs. 3(C) and 3(D)] due to their high lipid content and strong backscattering. An MIP over a 22 μm thick volume in cortical layer I was then color-coded by depth to better visualize individual fibers at different depths by their differing colors [Figs. 3(E) and 3(F)]. Vasculature was visualized by an inter-frame, complex high-pass filtering angiography algorithm [4,20], applied to the sequence of 20 repeated B-scans and, similarly, color-coded by depth [Fig. 3(G)]. Myelinated axons were also displayed in cyan with the vasculature in red [Fig. 3(H)] to enable registration.
Fig. 3.

Structural cross-sectional imaging of (A) the mouse neocortex with (B) labeled meningeal layers. S, skull; DM, dura mater; A, arachnoid; SS, subarachnoid space; GM, gray matter; PM, pia mater; PA, pial artery; and VR, Virchow–Robin space (dark region next to PA). Myelin is shown in 6 μm thick en face MIPs (C) and (D). (E) Depth-encoded color display of myelinated axons and (F) zoomed-in version of the white box in (E). (G) Depth-encoded color display of the angiogram. (H) Overlay of the en face MIPs of the angiogram (red) and the myelinated axons (cyan).
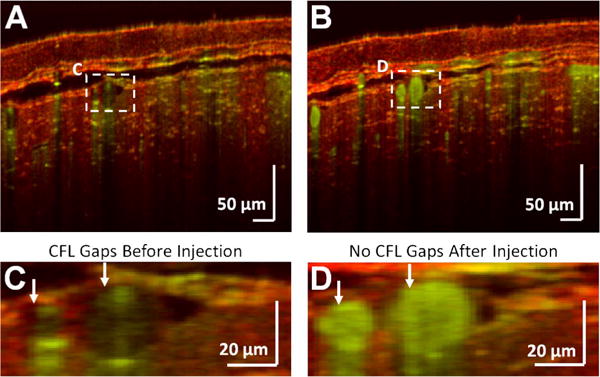
Microvasculature was visualized before [Fig. 4(A)] and after [Fig. 4(B)] an injection of Intralipid 20%, a highly scattering plasma tracer. The femtoliter-scale volume resolution revealed a dark, low scattering, plasma-dominated cell-free layer (CFL) [21] [Fig. 4(C)] prior to injection, which disappeared after injection [Fig. 4(D)]. In vivo measurements of this layer, caused by migration of red blood cells away from the vessel wall, may help to predict effective blood viscosity in vivo.
Fig. 4.

Visualization of surface vasculature. OCM angiography reveals microvessels just beneath the skull (A) before and (B) after plasma tracer injection. A zoomed-in view of the macrovasculature from (A) and (B) are shown (C) before and (D) after injection of a plasma tracer which highlights the CFL. The structural OCM signal is shown in red, and the angiogram signal is shown in green.
One potential disadvantage of overfilling the illumination aperture is the presence of transverse sidelobes in the PSF; however, we did not observe sidelobes in our images. Sidelobes may be further mitigated by the detection a PSF term [Eq. (1)], a chromatic interference effect that has been previously described [10], or additional aberrations. In addition, mismatched illumination and detection modes reduced system sensitivity, as assessed by a specular reflection, by 0.7 and 1.3 dB for overfill factors of 1.23 and 2.44, respectively, compared to the case of matched illumination and detection modes (overfill factor of 0.65). However, the impact of this mode mismatch is less clear in the case of multi-directional, non-specular, tissue scattering.
In conclusion, we described a visible light OCM instrument for in vivo mouse brain imaging with isotropic femtoliter volume resolution in tissue, achieved by asymmetric illumination and detection paths. Fine structures, including meningeal layers, myelinated axons, and the vascular CFL in cortical layer I were imaged through the thinned skull, with a single, fixed focal plane. Visible light OCM improves volume resolution relative to NIR and IR OCM, and improves the DOF and penetration depth in scattering tissue relative to reflectance confocal microscopy. These results suggest that the illumination aperture should be overfilled to improve OCM/OCT transverse resolution, particularly if the light source has extra power to spare to compensate for illumination power loss at the limiting aperture.
Acknowledgments
Funding
National Institutes of Health (NIH) (EB023591, EY025231, EY025477, EY028287, NS094681, NS105043); Glaucoma Research Foundation (GRF) (Catalyst for a Cure).
References
- 1.Huang D, Swanson EA, Lin CP, Schuman JS, Stinson WG, Chang W, Hee MR, Flotte T, Gregory K, Puliafito CA, Fujimoto JG. Science. 1991;254:1178. doi: 10.1126/science.1957169. [DOI] [PMC free article] [PubMed] [Google Scholar]
- 2.Izatt JA, Hee MR, Owen GM, Swanson EA, Fujimoto JG. Opt Lett. 1994;19:590. doi: 10.1364/ol.19.000590. [DOI] [PubMed] [Google Scholar]
- 3.Ben Arous J, Binding J, Leger JF, Casado M, Topilko P, Gigan S, Boccara AC, Bourdieu L. J Biomed Opt. 2011;16:116012. doi: 10.1117/1.3650770. [DOI] [PubMed] [Google Scholar]
- 4.Srinivasan VJ, Radhakrishnan H, Jiang JY, Barry S, Cable AE. Opt Express. 2012;20:2220. doi: 10.1364/OE.20.002220. [DOI] [PMC free article] [PubMed] [Google Scholar]
- 5.Min E, Lee J, Vavilin A, Jung S, Shin S, Kim J, Jung W. Opt Lett. 2015;40:4420. doi: 10.1364/OL.40.004420. [DOI] [PubMed] [Google Scholar]
- 6.Povazay B, Bizheva K, Unterhuber A, Hermann B, Sattmann H, Fercher AF, Drexler W, Apolonski A, Wadsworth WJ, Knight JC, Russell PS, Vetterlein M, Scherzer E. Opt Lett. 2002;27:1800. doi: 10.1364/ol.27.001800. [DOI] [PubMed] [Google Scholar]
- 7.Lichtenegger A, Harper DJ, Augustin M, Eugui P, Muck M, Gesperger J, Hitzenberger CK, Woehrer A, Baumann B. Biomed Opt Express. 2017;8:4007. doi: 10.1364/BOE.8.004007. [DOI] [PMC free article] [PubMed] [Google Scholar]
- 8.Robles FE, Wilson C, Grant G, Wax A. Nat Photonics. 2011;5:744. doi: 10.1038/nphoton.2011.257. [DOI] [PMC free article] [PubMed] [Google Scholar]
- 9.Liu Q, Chen S, Soetikno B, Liu W, Tong S, Zhang H. IEEE Trans Biomed Eng PP. 2017:1. doi: 10.1109/TBME.2017.2706976. [DOI] [PMC free article] [PubMed] [Google Scholar]
- 10.Leitgeb RA, Villiger M, Bachmann AH, Steinmann L, Lasser T. Opt Lett. 2006;31:2450. doi: 10.1364/ol.31.002450. [DOI] [PubMed] [Google Scholar]
- 11.Villiger M, Pache C, Lasser T. Opt Lett. 2010;35:3489. doi: 10.1364/OL.35.003489. [DOI] [PubMed] [Google Scholar]
- 12.Marchand PJ, Bouwens A, Szlag D, Nguyen D, Descloux A, Sison M, Coquoz S, Extermann J, Lasser T. Biomed Opt Express. 2017;8:3343. doi: 10.1364/BOE.8.003343. [DOI] [PMC free article] [PubMed] [Google Scholar]
- 13.Rungta RL, Osmanski BF, Boido D, Tanter M, Charpak S. Nat Commun. 2017;8:14191. doi: 10.1038/ncomms14191. [DOI] [PMC free article] [PubMed] [Google Scholar]
- 14.Wilson T, Sheppard C. Theory and Practice of Scanning Optical Microscopy. Academic; 1984. p. 213. [Google Scholar]
- 15.Conchello JA, Lichtman JW. Nat Methods. 2005;2:920. doi: 10.1038/nmeth815. [DOI] [PubMed] [Google Scholar]
- 16.Chong SP, Merkle CW, Cooke DF, Zhang T, Radhakrishnan H, Krubitzer L, Srinivasan VJ. Opt Lett. 2015;40:4911. doi: 10.1364/OL.40.004911. [DOI] [PMC free article] [PubMed] [Google Scholar]
- 17.Drew PJ, Shih AY, Driscoll JD, Knutsen PM, Blinder P, Davalos D, Akassoglou K, Tsai PS, Kleinfeld D. Nat Methods. 2010;7:981. doi: 10.1038/nmeth.1530. [DOI] [PMC free article] [PubMed] [Google Scholar]
- 18.Xu HT, Pan F, Yang G, Gan WB. Nat Neurosci. 2007;10:549. doi: 10.1038/nn1883. [DOI] [PubMed] [Google Scholar]
- 19.Schain AJ, Hill RA, Grutzendler J. Nat Med. 2014;20:443. doi: 10.1038/nm.3495. [DOI] [PMC free article] [PubMed] [Google Scholar]
- 20.Merkle CW, Srinivasan VJ. Neuroimage. 2016;125:350. doi: 10.1016/j.neuroimage.2015.10.017. [DOI] [PMC free article] [PubMed] [Google Scholar]
- 21.Fedosov DA, Caswell B, Popel AS, Karniadakis GE. Microcirculation. 2010;17:615. doi: 10.1111/j.1549-8719.2010.00056.x. [DOI] [PMC free article] [PubMed] [Google Scholar]


