

Abstract
Objectives
Many studies have reported the increased presence of gastrointestinal (GI) symptoms in children with autism spectrum disorders (ASD). Altered microbiome profiles, pro-inflammatory responses and impaired intestinal permeability have been observed in children with ASD and co-morbid GI symptoms, yet few studies have compared these findings to ASD children without GI issues or similarly aged typical developing children. The aim of this study was to determine whether there are biological signatures in terms of immune dysfunction and microbiota composition in children with ASD with GI symptoms.
Methods
Children were enrolled in one of four groups: ASD and GI symptoms of irregular bowel habits (ASDGI), children with ASD but without current or previous GI symptoms (ASDNoGI), typically developing children with GI symptoms (TDGI) and typically developing children without current or previous GI symptoms (TDNoGI). Peripheral blood mononuclear cells (PBMC) were isolated from the blood, stimulated and assessed for cytokine production, while stool samples were analyzed for microbial composition.
Results
Following Toll-Like receptor (TLR)-4 stimulation, the ASDGI group produced increased levels of mucosa-relevant cytokines including IL-5, IL-15 and IL-17 compared to ASDNoGI. The production of the regulatory cytokine TGFβ1 was decreased in the ASDGI group compared with both the ASDNoGI and TDNoGI groups. Analysis of the microbiome at the family level revealed differences in microbiome composition between ASD and TD children with GI symptoms; furthermore, a predictive metagenome functional content analysis revealed that pathways were differentially represented between ASD and TD subjects, independently of the presence of GI symptoms. The ASDGI also showed an over-representation of the gene encoding zonulin, a molecule regulating gut permeability, compared to the other groups.
Conclusions
Overall our findings suggest that children with ASD who experience GI symptoms have an imbalance in their immune response, possibly influenced by or influencing metagenomic changes, and may have a propensity to impaired gut barrier function which may contribute to their symptoms and clinical outcome.
Keywords: ASD, Autism, Cytokines, Gastrointestinal, Immune, Mucosal Immunity, Microbiota, zonulin
1. Introduction
Autism spectrum disorders (ASD) are neurodevelopmental disorders defined by social impairments and the presence of repetitive or stereotyped behaviors. ASD currently affects 1 out of every 68 children in the U.S.(Wingate 2014). The etiology(ies) for the majority of ASD cases are unknown; however, it is generally accepted that both genetic and environmental factors contribute to ASD risk (Abrahams and Geschwind 2008, Geschwind 2008, Landrigan 2010, Hallmayer et al. 2011). Although ASD is primarily considered a condition that affects the brain, co-morbid features in other organs have been described including those within the gastrointestinal (GI) tract (Gillberg and and Billstedt 2000, Bauman 2010, Ballard et al. 2016, Hirata et al. 2016, Mannion and Leader 2016).
Historically, in his original case series, Kanner described vomiting and feeding issues in 6 out of 11 children with autism, a seventh case having diarrhea after small pox vaccination, while another was “obsessed with his feces” (Kanner 1943). Epidemiological studies investigating rates of GI symptoms in children with ASD have varied widely, with the frequency reported at anywhere from 20 to 70% (Horvath and Perman 2002, Molloy and Manning-Courtney 2003, Parracho et al. 2005, Niehus and Lord 2006, Valicenti-McDermott et al. 2006, Xue et al. 2008, Buie et al. 2010, Coury et al. 2012, Chaidez et al. 2014). The differences in reported rates are most likely due to study type (retrospective vs. prospective), how symptoms were reported (parental report vs. medical records), time-span for experiencing the symptoms, age of participants in the study, lack of standardization regarding the description and definitions of GI symptomology, and differences between population-based case control studies and studies set in specialist pediatric gastroenterology clinics that may introduce certain referral biases (Mannion et al. 2013, Rose and Ashwood 2015). In a recent large population based case-control study conducted within a defined geographic region, data from nearly 1,000 children indicated that those with ASD are 6 to 8 times more likely to have frequent GI symptoms in the past 6 months including gaseousness/bloating, diarrhea, constipation and sensitivity to foods when compared to age-, sex-, region-matched typically developed children (Chaidez et al. 2014). Moreover, the prevalence of clinically diagnosed inflammatory bowel disease (IBD) was shown to be increased in ASD based on data from 3 large study populations (23).
Further reports have indicated that children with ASD and GI symptoms are more likely to experience sleep disturbance, sudden irritability, unexplained crying, aggressive behavior and score worse on behavioral assessments than children with ASD without GI symptoms (Horvath and Perman 2002, Chaidez et al. 2014). Analogous findings of behavioral and neurological problems are seen in other diseases characterized by GI dysfunction (Bushara 2005, Genuis and Bouchard 2010) and support a link between GI dysfunction and behavioral changes. Hans Asperger reported that children with celiac disease also often exhibit psychological problems (Asperger 1961). Anxiety, depression, epilepsy, severe progressive neuropathy, gait ataxia, and limb ataxia are also seen in adult patients with celiac disease (Hallert and Derefeldt 1982, Hadjivassiliou et al. 2002, Bushara 2005, Fasano and Catassi 2005, Genuis and Bouchard 2010). In individuals with diseases/syndromes such as irritable bowel syndrome (IBS), ulcerative colitis and Crohn’s disease, psychiatric symptoms have also been reported (Ringel and Drossman 2001, Ringel and Drossman 2002).
Studies focused on assessing the underlying pathology of GI dysfunction in children with ASD have demonstrated low α-1-antitrypsin concentrations suggestive of intestinal protein loss (Walker-Smith and Andrews 1972), increased intestinal permeability as measured by a lactulose:mannitol test (D’Eufemia et al. 1996, de Magistris et al. 2010) and the presence of a diffuse inflammation of the intestinal tract found after endoscopy or colonoscopy as part of clinical work up for GI symptoms (reviewed in (Buie et al. 2010)). The precise nature of this inflammation has been controversial and much debated. However, controversy notwithstanding, evidence from histological, immunohistochemical and flow cytometry studies have suggested a subtle, pan-enteric infiltration of activated lymphocytes, monocytes, natural killer (NK) cells and eosinophils into the walls of the GI tract in children with ASD and GI symptoms, compared with typically developing children with similar GI symptoms (Furlano et al. 2001, Torrente et al. 2002, Ashwood et al. 2003, Ashwood et al. 2004, Torrente et al. 2004).
There are also indications that individuals with ASD and GI symptoms have altered intestinal microbiota, including reports of higher Clostridium counts in the feces compared to controls (Finegold et al. 2002, Finegold et al. 2010), differences in the Clostridium groups C. bolteae and C. cluster I and XI (Song et al. 2004), a higher incidence of C. histolyticum (Parracho et al. 2005), decreased unclassified Veillonellaceae, Prevotella, Coprococcus and unclassified Prevotellaceae species (Kang et al. 2013), altered Bacteroides/Firmicutes ratios and increased desulfovibrio (Finegold et al. 2010, Tomova et al. 2015), and increased Sutterella and Ruminococcus torques (Wang et al. 2013) compared with controls. Interestingly, one study reported dysbiosis and decreased levels of transcripts for disaccharidases in the mucoepithelium layer in children with ASD and GI symptoms and postulated that decreases in host enzymes could contribute to the dysbiosis (Williams et al. 2011). Taken as a whole, these data suggest that dysbiosis may be a feature of children with ASD who have GI symptoms, but the exact nature and specificity of the microbiota changes or whether these changes are also found in children with ASD without GI symptoms are still far from clear.
Currently, it is not well understood whether children with ASD and GI symptoms are a unique phenotype within ASD or if this is a co-morbidity unrelated to neurodevelopment. Herein we sought to further understand whether the GI microbiota and peripheral immune response are altered in children with ASD and GI symptoms, and to establish whether there are biological signatures in terms of immune dysfunction and microbiota composition compared to children with ASD without GI symptoms. We evaluated differences in the microbiota, the gene encoding zonulin, a molecule regulating gut permeability and peripheral immune response in a well-characterized cohort of children with ASD, both with and without irregular bowel movements, as compared to age equivalent typically developing children.
Methods
2.1. Subjects
Participants for this study were recruited through UC Davis MIND Institute and had all been previously enrolled in the Childhood Autism Risk from Genetics and Environment (CHARGE) study (Hertz-Picciotto et al. 2006). Participants were recruited from 4 groups, 1) children with ASD and GI symptoms of irregular bowel movements (ASDGI); 2) children with ASD and no GI symptoms (ASDNoGI); 3) typically developing children with GI symptoms of irregular bowel movements (TDGI), and; 4) typically developing children without GI symptoms (TDNoGI) (Table 1). A total of 103 participants were included in this study ranging in age from 3 years old to 12 years old, with 88 participants providing both stool and blood samples, 12 participants had only blood analyzed and 3 participants had only stool samples analyzed. After exclusions (see below) only 87 of the 100 blood samples had adequate cell numbers to run the cellular assays. A diagnosis of autism spectrum disorder was confirmed at the UC Davis MIND Institute by trained staff using the Autism Diagnostic Interview-Revised (ADI-R), and the Autism Diagnostic Observation Schedule (ADOS) at the time of enrollment into the original CHARGE study. All subjects were diagnosed prior to 2013 and based on DSM IV. To exclude behavioral and developmental characteristics of ASD in the typically developing group, the Social Communication Questionnaire (SCQ) was used as a screen. Participants in the TD groups had to score within the typical range, i.e. below 15, on the SCQ and above 70 on the Mullen Scales of Early Learning (MSEL) and Vineland Adaptive Behavior Score (VABS). Participants were randomly recruited from the CHARGE database based on inclusion/exclusion criteria (see below) and typically developing children were frequency matched to ASD cases based on age, sex and birth location. Previous data taken during enrollment in CHARGE were used to initially screen for inclusion criteria, families were contacted only if they had given consent to be contacted about further studies. A telephone interview, along with GI and health questionnaires were used to assess participant eligibility into the current study (outlined below). All participants were also assessed using the Aberrant Behavior Checklist (ABC) to assess impairments within the domains of irritability, lethargy, social withdrawal, stereotypic behavior, hyperactivity and inappropriate speech at the time of enrollment into the current study. Medications and/or behavioral therapies used at the time of enrollment or within the previous year were collected and recorded. Participants were excluded if they had a known diagnosis of other GI pathology (celiac disease or IBD), use of antibiotics or antifungal medications within the prior month, medications affecting GI transit (stool softeners), and/or recent evidence of a GI infection based on stool laboratory tests performed by the child’s physician. In addition, participants were excluded if there was evidence of a seizure disorder, genetic disorders (i.e. Fragile X syndrome, Tuberous Sclerosis Complex), liver or pancreatic disease, cystic fibrosis, or chronic infection. Children receiving nutritional monitoring and prescribed dietary interventions under the guidance of trained nutrionists/clinicians, medications, or complementary alternative treatments such as supplements other than a standard daily multivitamin/mineral tablet were also excluded. However, for children who were receiving nutritional modifications that were not overseen by a trained nutritionist, the dietary changes were documented but the participants were not excluded from the study. Similarly, children whose parents reported suspected food sensitivities/intolerances that had not been diagnosed through clinical assessment were also not excluded, but were documented.
Table 1.
Demographics of the study participants.
| Demographics | ||||||||
|---|---|---|---|---|---|---|---|---|
| ASDNOGI | ASDGI | TDNOGI | TDGI | ASDNOGI | ASDGI | TDNOGI | TDGI | |
|
| ||||||||
| Blood | Stool | |||||||
| # of subjects | 26 | 20 | 35 | 6 | 29 | 21 | 34 | 7 |
| Age (median) | 7.83 | 5.71 | 6.75 | 5.17*# | 7.75 | 6.58 | 7.09 | 5.08*# |
| IQR | (5.46 - 11.23) | (4.77 - 9.06) | (5.50 - 8.33) | (4.10 - 6.00) | (5.25 - 10.54) | (4.79 - 8.86) | (5.56 - 8.50) | (4.33 - 5.83) |
| # males | 19 | 15 | 24 | 5 | 25 | 17 | 32 | 6 |
| Constipation | NA | 8 | NA | 3 | NA | 7 | NA | 4 |
| Diarrhea | NA | 4 | NA | 1 | NA | 5 | NA | 1 |
| Both (D+C) | NA | 0 | NA | 0 | NA | 1 | NA | 0 |
| IBS like | NA | 8 | NA | 2 | NA | 8 | NA | 2 |
significantly different from ASD (p < 0.05)
significantly different from TD (p < 0.05)
2.2. GI symptom evaluation
At the time of recruitment into the current study, the parents or legal guardians of the study participants were asked to complete the CHARGE GI history (GIH) survey and GI symptom survey, based upon Rome III Diagnostic Questionnaire for the Pediatric Functional GI Disorders (Walker LS 2006). The GIH has been reported elsewhere (Chaidez et al. 2014) and rates the frequency of the following symptoms; abdominal pain, gaseousness/bloating, diarrhea, constipation, pain on stooling, vomiting, sensitivity to foods, difficulty swallowing, blood in stool and blood in vomit on a Likert scale [(0) = never, (1) = rarely, (2) = sometimes, (3) = frequently and (4) = always)]. Parents/guardians were asked if the participants experienced any allergies to foods, if their diet was restricted, by whom (child, parent or doctor) and for what reason; if any foods caused or worsened symptoms, if the child had any strong food dislikes and what they were, and finally, if any clinical GI diagnosis had ever been given. Parents/guardians answered each of the questions for both current (within the past three months) and previous experiences. The GI symptom survey consisted of 7 sections, each section had 1 to 6 questions to determine if the participant met the criteria for constipation, diarrhea or irritable bowel syndrome (IBS). All questions were multiple choice with the options of answering yes, no or don’t know. Sections 1 and 2 determined eligibility criteria for constipation. Sections 3 and 4 determined eligibility criteria for diarrhea. Sections 5 and 6 determined IBS like symptoms if present. Lastly, section 7 asked if stooling had been consistent for the last 6 months (see Supplemental Figure 1 for more detail).
Participants who met the criteria for constipation, diarrhea or IBS on the GI history and symptom surveys were placed in their corresponding GI group (ASDGI or TDGI), participants who did not meet criteria for constipation, diarrhea or IBS, and had consistent stooling patterns for the past 6 months were placed in their corresponding no GI group (ASDNoGI or TDNoGI). Participants who did not meet the criteria for constipation, diarrhea or IBS, but had inconsistent stooling patterns during the last 6 months were excluded from this study.
This study was approved by institutional review boards for the State of California and the University of California, Davis. Informed consent is obtained from a legal guardian for all study participants prior to data collection in accordance with the UC Davis IRB protocol.
1.3. Blood collection and cellular assays
Peripheral blood was collected from each subject in acid-citrate dextrose Vacutainers (BD Biosciences; San Jose, Ca). Blood was processed to isolate peripheral blood mononuclear cells (PBMC). Blood was centrifuged at 2100 rpm for 10 minutes, plasma was harvested and the remaining blood cells were layered on lymphocyte separation medium (Corning; Manassas, VA), and centrifuged at 1700 rpm for 30 minutes. PBMC were collected from the buffy layer and washed with Hanks balanced salt solution (Corning; Manassas, VA). PBMC were plated in a 96 well plate at a concentration of 300,000 cells/well in complete media (RPMI 1640 (Invitrogen; Carlsbad, CA) with 10% Fetal Bovine Serum (Corning; Manassas, VA), 100 IU/ml penicillin (Invitrogen; Carlsbad, CA) and 100 IU/ml streptomycin (Invitrogen; Carlsbad, CA)). PBMC were cultured for 24 hours with either 1 μg/mL LPS (Sigma-Aldrich; St. Louis, MO) (a Toll-like receptor (TLR)-4 agonist), 3 μg/mL peptidoglycan (PGN) (Sigma-Aldrich; St. Louis, MO) (a Nucleotide-binding oligomerization domain-containing protein (NOD) ligand), 10 μg/mL phytohemagglutinin (PHA) (Sigma-Aldrich; St. Louis, MO) (a T-cell activator), or in media alone.
1.4. Cytokine Analysis
Following cell culture, supernatants were collected and stored at −80 °C until analysis of the cytokines. To assess pro-inflammatory responses following stimulation, the cytokines IL-1α, IL-1β, IL-6, IL-12 (p40 & p70) and tumor necrosis factor (TNF)α were measured. To assess T cell responses IFNγ (TH1), IL-4 and IL-13 (TH2) were analyzed, and; to assess immune regulation IL-10 and transforming growth factor (TGF)β1 were measured. In addition, IL-5, IL-15 and IL-17 cytokine levels were assessed because they have been implicated in mucosal homeostasis, inflammation and disease. Cytokine analysis was performed using a multiplexing bead immunoassay (Millipore, Billerica, MA). Samples were run according to manufacturer’s protocol. Briefly, 25 μL of sample were incubated with antibody coupled fluorescent beads, washed and incubated with biotinylated detection antibodies followed by streptavidin– phycoerythrin. The beads were then `analyzed using flow-based Luminex™ 100 suspension array system (Bio-Plex 200; Bio-Rad Laboratories, Inc.). Standard curves were generated by Bio-plex Manager software to determine unknown sample concentration, reference cytokines were provided by the manufacturer in the kit. TGFβ1 concentration was determined by a separate kit from the other cytokines due to additional processing steps recommended by the manufacturer. Samples underwent an acidification step prior to being assessed for TGFβ1. Acid-activation is needed to cleave the latent form of TGFβ in order to detect active TGFβ1 by the antibodies used in the Millipore kit (Hale-Donze et al. 2001). 20 μL of sample was incubated with 10 μL of 1N HCl (Fisher Scientific; Pittsburg, PA) for 30 minutes followed by the addition of 10 μL of 1.2N NaOH (Fisher Scientific; Pittsburg, PA) with 0.5M HEPES (Sigma-Aldrich; St. Louis, MO) to return samples to a neutral pH. The minimum detectable amount for the cytokines were as follows: IFNγ 0.8 pg/mL, IL-10 1.1 pg/mL, IL-12p40 7.4 pg/mL, IL-12p70 0.6 pg/mL, IL-13 1.3 pg/mL, IL-15 1.2 pg/mL, IL-17 0.7 pg/mL, IL-1α 9.4 pg/mL, IL-1β 0.8 pg/mL, IL-4 4.5 pg/mL, IL-5 0.5 pg/mL, IL-6 0.9 pg/mL, TGFβ1 9.3 pg/mL and TNFα 0.7 pg/mL. Sample concentrations that were below the limit of detection were given a proxy value as half the limit of detection for statistical comparisons.
Due to the low frequency of GI symptoms in TD children (Chaidez et al. 2014), we were only successful in recruiting 6 TDGI children for the immune assays; in addition, many of the TDGI participants were significantly younger than the other groups, perhaps reflecting the transient GI symptoms in this population (Table 1). Preliminary comparisons between TD and TDGI for induced cytokine levels after stimulation revealed very little differences between the two groups (Supplemental Figure 2). Due to concerns of age and sample size we choose to focus cytokine comparisons of the ASD groups to the TDNoGI group and did not include the TDGI group in further analysis.
1.5. Haptoglobin (Zonulin) Genotyping
Haptoglobin (Hp) genotype was determined by immunoblot. Immuno blot analysis was performed as routinely described; briefly, plasma samples were electrophoresed through a 4–20% gradient SDS polyacrylamide gel and transferred onto polyvinylidene difluoride membranes (Millipore, Bedford, MA, USA). Membranes were blocked in blocking buffer (Tris-buffered saline, 0.1% Tween 20, 5% BSA). The blots were incubated with polyclonal anti-human haptoglobin (Sigma-Aldrich; St. Louis, MO) diluted in blocking buffer (1:5000). After washing, membranes were incubated with anti-rabbit Alexa Fluor 488 (Life Technologies; Carlsbad, CA) diluted in blocking buffer (1:5000). Western blot signal was visualized using an infrared scan LI-COR Odyssey (LI-COR, Lincon, Nebraska, USA).
2.6. Microbiome Analysis
Parents were given collection containers to collect stool samples at home including tubes containing RNA later. Once stool was collected, samples were immediately placed in the freezer and brought back frozen to the clinic within 24 hrs. Total DNA was extracted from 0.25 grams of stool samples that had been preserved and transported in RNA later with PowerSoil DNA isolation kit (Mobio).
Amplification of the V3-V4 regions of the 16S rRNA gene was performed according to Fadrosh et al.(Fadrosh et al. 2014) using a dual-barcode system with fusion primers 338F and 806R. Amplicons were subsequently sequenced on Illumina MiSeq using the 300 bp paired-end protocol at the Genomic Resource Center at the University of Maryland School of Medicine Institute for Genome Sciences. Raw reads were preprocessed to remove the first 3 and last 3 bases if their phred score was lower than 3, read end was trimmed if the average phred quality score of 4 consecutive bases are below 15. Paired reads were retained if their length was at least 75% of their original length after trimming, which were then assembled using FLASH (Magoc and Salzberg 2011) with overlap by ~90bp on average. Assembled reads were de-multiplexed by binning sequences with the same barcode and quality trimmed in QIIME (version 1.8.0) (Caporaso et al. 2010) (for details, please refer to Fadrosh et al. (Fadrosh et al. under review)). Similar sequences with less than 3% dissimilarity were clustered together using USEARCH (v5.2.32) (Edgar 2010) and de novo chimera detection was conducted in UCHIME v5.1 (Edgar et al. 2011). The taxonomic ranks were assigned to each sequence using Ribosomal Database Project (RDP) Naïve Bayes Classifier v.2.2 (Wang et al. 2007), using 0.8 confidence values as the cutoff to a pre-built greengenes database of 16S rRNA sequences (Aug, 2013 vers.) (McDonald et al. 2012).
The heatmap, bar plot were generated using statistical package R (v3.2.1) and Phyloseq R packages (McMurdie and Holmes 2013). The predicted metagenome functional content from 16S rRNA marker gene was performed using PICRUSt (Langille et al. 2013). A Cohen-Friendly association plot (Cohen 1980, Friendly 1992) was produced in R to indicate deviations from independence of KEGG functional categories that are mostly differentially presented among different categories.
2.7. Statistical analysis
Analysis of the data using a Shapiro-Wilk test indicated that distribution of the cytokine data was not normally distributed. Neither log transformation nor square-root transformation normalized all cytokine distributions. Therefore, the Kruskal-Wallis rank sum test was used to compare cytokine levels between groups. Data are expressed as median values (interquartile ranges). A Mann-Whitney non-parametric U-test (with a Holm step down procedure to correct for multiple comparisons) was used in post-hoc analyses to compare cytokine levels between groups and adjusted P values < 0.05 were considered statistically significant. Outliers were removed using ROUT. The behavioral data (ABC subscales) were also analyzed using a Mann-Whitney non parametric U-test, outliers were removed using ROUT. The microbiota data were subjected to two-way ANOVA. These tests are made at the 0.05 significance level using ranked lase discovery rate (FDR) correction for multiple comparisons. The haptoglobin genotype data was analyzed using a two tailed chi-square test.
3. Results
3.1. Immune stimulation assays
3.1.1 Basal stimulation (media alone)
In cell culture supernatants from PBMC cultured with media alone, reduced TGFβ1 production was observed in the ASDGI group compared with both ASDNoGI and TDNoGI children (p < 0.05) (Figure 1). We also noted a trend for increased IL-6 in ASDGI compared to TDNoGI but did not reach statistical significance (p = 0.0932) (Table 2).
Figure 1.
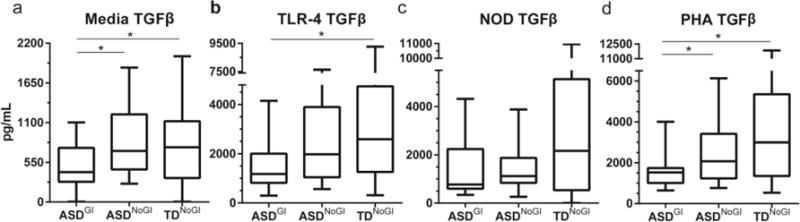
TGFβ1 production after 24 hours of stimulation with media alone; TLR-4 agonist, LPS; NOD agonist, PGN; or T cell mitogen, PHA. Comparing medians and interquartile range between ASDNOGI, ASDGI and TDNOGI. Concentration of TGFβ1 shown in pg/mL. * denotes p-value < 0.05.
Table 2.
Comparison of PBMC cytokine production in media after 24 hours in vitro between ASD without GI symptoms (ASDNOGI), ASD with GI symptoms (ASDGI) and typically developing children without GI (TDNOGI). Data presented as median and interquartile ranges.
| Media | |||
|---|---|---|---|
| ASDNOGI Median (IQR) |
ASDGI Median (IQR) |
TDNOGI Median (IQR) |
|
| IL-1α | 4.70 (4.70-4.70) |
4.70 (4.70-4.70) |
4.70 (4.70-4.70) |
| IL-1β | 0.40 (0.40-2.0) |
0.40 (0.40-4.33) |
0.40 (0.40-1.21) |
| IL-6 | 3.73 (1.52-15.73) |
9.65 (4.05-17.18) |
5.25 (2.62-9.44) |
| IL-12p40 | 3.70 (3.70-3.70) |
3.70 (3.70-3.70) |
3.70 (3.70-3.70) |
| IL-12p70 | 0.30 (0.30-0.39) |
0.30 (0.30-0.73) |
0.30 (0.30-0.63) |
| TNFα | 4.47 (2.91-10.04) |
8.03 (3.66-17.58) |
6.53 (3.74-9.65) |
| IFNγ | 1.93 (0.40-5.96) |
1.36 (0.62-2.19) |
1.26 (0.4-2.72) |
| IL-4 | 2.25 (2.25-2.25) |
2.25 (2.25-2.25) |
2.25 (2.25-2.25) |
| IL-13 | 0.65 (0.65-0.92) |
0.65# (0.65-0.65) |
0.65 (0.65-1.57) |
| IL-10 | 4.84 (3.89-7.34) |
5.93 (4.08-6.97) |
6.32 (4.11-9.81) |
| TGFβ | 2,070* (1,235-3,409) |
1,523# (1,009-1,738) |
2996 (1,347-5,351) |
| IL-5 | 0.25 (0.25-0.25) |
0.25 (0.25-0.25) |
0.25 (0.25-0.25) |
| IL-15 | 0.60 (0.60-0.60) |
0.60 (0.60-0.60) |
0.60 (0.60-0.60) |
| IL-17 | 0.35 (0.35-0.35) |
0.35 (0.35-0.35) |
0.35 (0.35-0.35) |
p value < 0.05 when comparing ASD GI with ASD no GI
p value < 0.05 when comparing ASD GI with TD
p value < 0.05 when comparing ASD no GI with TD
3.1.2. TLR 4 Stimulation
Following stimulation with TLR-4 ligand, (Table 3), supernatants from PBMC cultures from the ASDNoGI group produced approximately 1.5 fold more IL-1α (p = 0.0003) and TNFα (p = 0.0254), as well as significantly increased IL-1β (p = 0.0027) compared to TDNoGI (Figure 2a-c). Production of IL-6 also trended towards an elevation in the ASDNoGI group compared to the TDNoGI group but did not reach significance. Decreased levels of mucosa-associated cytokines were observed in ASDNoGI compared with TDNoGI, including IL-15, IL-17 (p < 0.02; Figure 2d-e) and IL-12p70 (p < 0.02; Table 3).
Table 3.
Comparison of PBMC cytokine production after 24 hours of stimulation with TLR-4 agonist between ASDNOGI, ASDGI and TDNOGI. Data presented as median and interquartile ranges.
| TLR4 (LPS) | |||
|---|---|---|---|
| ASDNOGI Median (IQR) |
ASDGI Median (IQR) |
TDNOGI Median (IQR) |
|
| IL-1α | 3,959‡* (3,615-4,376) |
3,160 (1,602-4,036) |
2,660 (1,115-3,913) |
| IL-1β | 12,506‡ (9,304-17,562) |
10,727 (7,888-15,632) |
9,782 (6,370-12,298) |
| IL-6 | 35,049 (26,923-46,236) |
33,143 (20,277-41,781) |
31,468 (21,858-47,848) |
| IL-12p40 | 43.69 (19.39-75.11) |
39.28 (19.39-96.25) |
57.64 (36.21-75.11) |
| IL-12p70 | 5.35‡ (3.34-7.46) |
7.46 (3.588-9.65) |
7.63 (5.35-9.65) |
| TNFα | 4,072‡ (2,904-5,139) |
4,084 (2,765-5,959) |
3,071 (2,074-3,989) |
| IFNγ | 159.90 (53.63-293.20) |
253.50 (85.24-878) |
168.90 (75.51-288.20) |
| IL-4 | 2.25 (2.25-4.16) |
2.25 (2.25-11.13) |
2.25 (2.25-11.13) |
| IL-13 | 19.50 (13.48-28.99) |
20.80 (15.14-30.88) |
19.50 (14.16-24.65) |
| IL-10 | 9,253 (4,421-10,885) |
6,151 (3,007-10,047) |
6,048 (3,904-8,017) |
| TGFβ | 1,981 (1,043-3,899) |
1,179# (820.70-2,010) |
2,590 (1,261-4,745) |
| IL-5 | 1.36* (0.25-3.39) |
3.39# (2.61-6.35) |
2.43 (1.62-3.05) |
| IL-15 | 19.50‡ (13.48-28.99) |
20.80 (15.14-30.88) |
19.50 (14.16-24.65) |
| IL-17 | 0.35‡* (0.35-0.35) |
0.48# (0.35-3.24) |
3.28 (1.00-6.145) |
p value < 0.05 when comparing ASD GI with ASD no GI
p value < 0.05 when comparing ASD GI with TD
p value < 0.05 when comparing ASD no GI with TD
Figure 2.
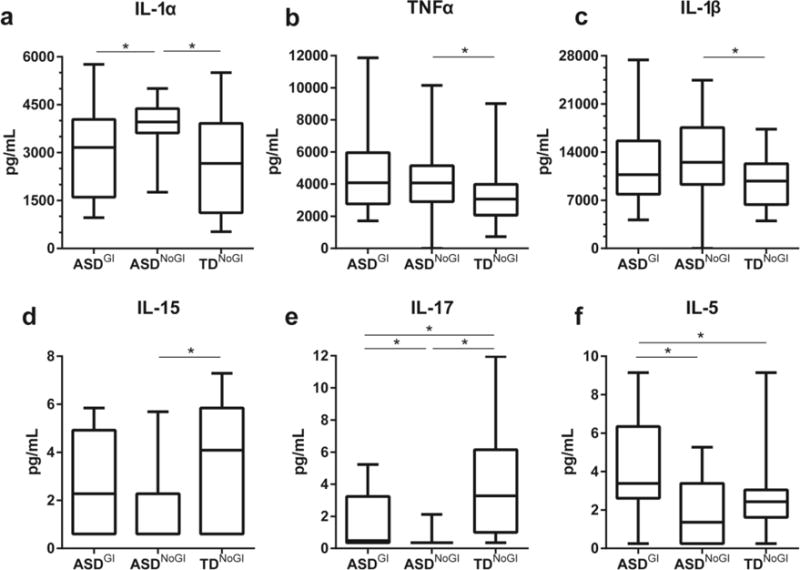
Induced cytokine responses after stimulation with TLR-4 agonist LPS. Showing responses from IL-1α (a), TNFα (b), IL-1β (c), IL-15 (d), IL-17 (e) and IL-5 (f). Concentrations shown in pg/mL. Data depicted as box and whisker graphs. *denotes p-value < 0.05.
When comparing the ASDGI group with the ASDNoGI group we found significant increases in the production of a number of cytokines, including IL-5 (p = 0.0006; Figure 2f), IL-17(p = 0.0057; Figure 2e) and a non-significant trend for IFNγ (p = 0.0531) and IL-15 (p = 0.0829; Figure 2d). Levels of IL-1α were decreased in ASDGI compared to ASDNoGI (p = 0.0150; Figure 2a). Compared to TDNoGI cytokine production in ASDGI was increased for IL-5 (p = 0.0021; Figure 2f) and there was a non-significant trend towards increased production of IFNγ (p = 0.0820) and TNFα (p =0.0546); however, IL-17 was decreased (p = 0.0186; Figures 2e).
Of note, TGFβ1 was decreased in ASDGI compared with both ASDNoGI and TDNoGI (p < 0.007; Figure 1).
3.1.3. NOD 1&2 Stimulation
In general, following NOD stimulation, cytokine production in supernatants from PBMC cultures of the ASDNoGI group was lower when compared with either ASDGI or TDNoGI (Table 4). ASDNoGI produced less than a third of the amount of IL-1α and IL-1β (p < 0.001), was decreased for IL-6, IL-12p40, TNFα, IFNγ (p < 0.03), and there was a non-significant trend for decreased IL-5, IL-10 and IL-13 (p < 0.08) when compared with TDNoGI (Figure 3a-f). In ASDGI there was a 3-fold increase in production of IL-1β, more than double the amount of IFNγ (p < 0.02), and a non-significant trend for increased TNFα (p = 0.0647) compared to the ASDNoGI group (Figure 3b,e &f). Regulatory cytokines IL-10 and TGFβ were decreased in the ASDGI group compared to TDNoGI; however, differences were not significant after statistical correction for multiple comparisons.
Table 4.
Comparison of PBMC cytokine production after 24 hours of stimulation with NOD agonist between ASD, ASDGI and TD. Data presented as median and interquartile ranges.
| NOD 1&2 (PGN) | |||
|---|---|---|---|
| ASDNOGI Median (IQR) |
ASDGI Median (IQR) |
TDNOGI Median (IQR) |
|
| IL-1α | 31.09‡ (4.70-103.40) |
58.80 (4.70-576.40) |
104.30 (60.65-395.80) |
| IL-1β | 202.6‡* (31.81-327.70) |
638.90 (156.40-6415) |
713.10 (286.70-3596) |
| IL-6 | 5,702 (2,187-10,883) |
6,974 (5,174-12,261) |
8,919 (6,570-15,244) |
| IL- 12p40 | 10.82‡ (3.70-36.47) |
24.18 (3.70-38.21) |
24.29 (10.82-51.06) |
| IL- 12p70 | 0.30‡* (0.30-0.30) |
0.30 (0.30-4.00) |
0.30 (0.30-5.80) |
| TNFα | 324.10‡ (102.7-1,022) |
488.60 (255-3,053) |
850.40 (385.50-1,442) |
| IFNγ | 40.82‡* (15.06-58.19) |
114.70 (30.37-461.60) |
72.63 (43.72-192) |
| IL-4 | 2.25 (2.25-2.25) |
2.25 (2.25-2.25) |
2.25 (2.25-2.25) |
| IL-13 | 20.76 (8.29-28.01) |
16.17 (8.29-57.57) |
29.32 (9.66-58.75) |
| IL-10 | 434.60 (163.60-1,080) |
473.10 (273.60-1,046) |
719.40 (466.20-1,271) |
| TGFβ | 1,118 (837.20-1,877) |
771.10 (595.80-2,243) |
2,169 (535.40-5,136) |
| IL-5 | 2.22 (1.22-3.21) |
2.43 (1.72-4.67) |
2.72 (2.02-4.99) |
| IL-15 | 0.60 (0.60-2.58) |
0.60 (0.60-3.51) |
2.38 (0.60-3.51) |
| IL-17 | 23.79 (8.13-57.22) |
15.66 (7.21-30.28) |
16.72 (5.59-29.54) |
p value < 0.05 when comparing ASD GI with ASD no GI
p value < 0.05 when comparing ASD GI with TD
p value < 0.05 when comparing ASD no GI with TD
Figure 3.
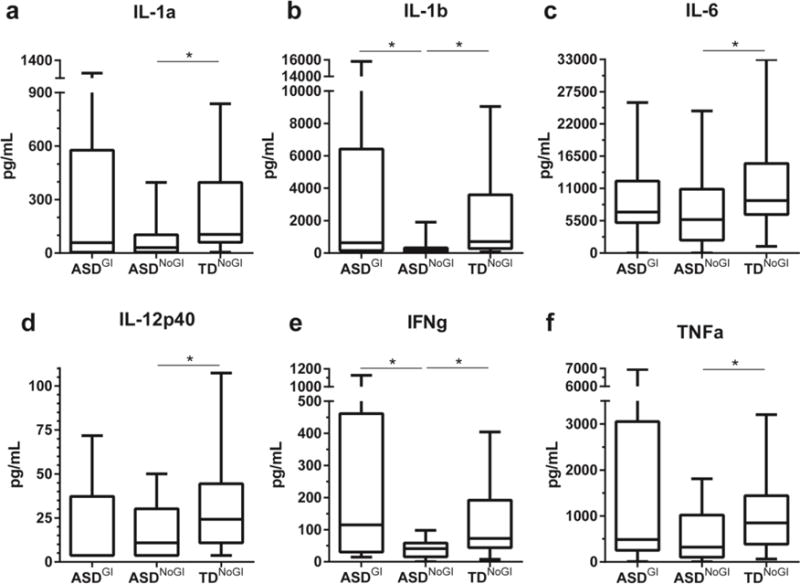
Induced cytokine responses after stimulation with NOD1 & 2 agonist PGN. Showing responses from IL-1α (a), IL-1β (b), IL-6 (c), IL-12p40 (d), IFNγ (e) and TNFα (f). Concentrations shown in pg/mL. Data depicted as box and whisker graphs. *denotes p-value < 0.05.
3.1.4. PHA stimulation
Overall, there were few significant differences between groups following PHA stimulation (Table 5). We found increased IL-15 in the ASDNoGI group compared to the TDNoGI group (p = 0.0033). Increased production of the TH1 cytokine IFNγ and decreased regulatory cytokine production of TGFβ1 was observed in the ASDGI group compared with the TDNoGI group (p < 0.01). We also found similar findings of, decreased TGFβ1 and increased IFNγ in ASDGI compared to ASDNoGI (p < 0.04).
Table 5.
Comparison of PBMC cytokine production after 24 hours of stimulation with T-cell mitogen between ASDNOGI, ASDGI and TDNOGI. Data presented as median and interquartile ranges.
| PHA | |||
|---|---|---|---|
| ASDNOGI Median (IQR) |
ASDGI Median (IQR) |
TDNOGI Median (IQR) |
|
| IL-1α | 64.17 (4.70-97.35) |
40.11 (4.70-85.84) |
52.50 (4.70-77.40) |
| IL-1β | 419.50 (205.00-732.80) |
578.90 (329.30-771.40) |
405.00 (236.70-709.30) |
| IL-6 | 6,851 (5,085-8,863) |
6,338 (5,814-11,464) |
6,434 (5,060-9,977) |
| IL-12p40 | 3.70‡ (3.70-3.70) |
3.70# (3.70-3.70) |
3.70 (3.70-20.97) |
| IL-12p70 | 21.65 (17.05-28.68) |
21.65 (12.56-28.94) |
17.05 (14.23-27.01) |
| TNFα | 1,438 (900.00-2,205) |
1,706 (985.20-2,851) |
1,477 (581.20-2,215) |
| IFNγ | 810.30* (431.20-1,208) |
1283# (822.80-1,747) |
591.80 (395-1,284) |
| IL-4 | 558.50 (228.00-893.90) |
462.30 (392.20-682.90) |
488.60 (292.50-899.60) |
| IL-13 | 1,590 (870.80-2,472) |
1,452 (1,116-2,743) |
1,621 (1,223-2,518) |
| IL-10 | 2,020 (1,501-3,739) |
2,585 (1,694-3,452) |
2,452 (2,035-3,323) |
| TGFβ | 2,070* (1,235-3,409) |
1,523# (1,009-1,738) |
2,996 (1,347-5,351) |
| IL-5 | 205.10 (129.60-331.70) |
224.60 (120.80-429.30) |
237.20 (180-496.80) |
| IL-15 | 12.31‡ (6.40-16.20) |
6.88 (1.195-15.23) |
6.10 (2.98-8.43) |
| IL-17 | 408.50 (265.60-647.50) |
412.10 (277.90-583.30) |
408.50 (279.20-731.60) |
p value < 0.05 when comparing ASD GI with ASD no GI
p value < 0.05 when comparing ASD GI with TD
p value < 0.05 when comparing ASD no GI with TD
3.2. Behavioral Scores
After comparing results of the ABC assessment between the two ASD groups, we found that ASDGI had more atypical behavioral scores compared to ASDNoGI (Figure 4). Children in the ASDGI group had increased ABC subscale scores for irritability and agitation, social withdrawal and lethargy and hyperactivity and noncompliance (p < 0.02; Figure 4a-c) compared with ASDNoGI.
Figure 4.
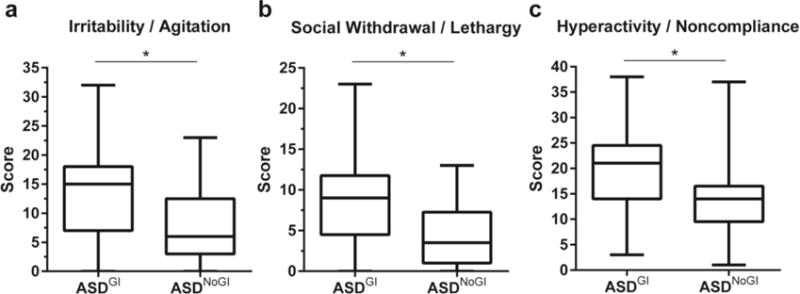
ABC subscale comparisons between ASDNOGI and ASDGI. Showing irritability/agitation scores (a); social withdrawal/lethargy scores (b); and hyperactivity/noncompliance sores (c). Data depicted as box and whisker graphs. *denotes p-value < 0.05.
3.3. Haptoglobin analysis
Analysis of Hp genotypes showed a trend of over-representation of the Hp2 gene in ASD subjects over TD groups independent of GI status that did not reach statistical significance (p = 0.077; Supplemental Table 1). However, there was a significant different distribution between ASDGI compared to TDGI (p < 0.01) with an over representation of the Hp2-2 genotype and under-representation of the Hp1-1 genotype in children with ASDGI. No difference was observed between ASDNoGI and TDNoGI or ASDGI and ASDNoGI.
3.4. Microbiome analysis
Gap statistic analysis revealed the presence of three clusters in our samples (Supplemental Figure 3) that correlate with three previously described microbial enterotypes (Arumugam et al. 2011). The first cluster was Bacteroides enriched, while the second cluster lacked any defined dominant bacterial genera. Finally, the third cluster appeared to be dominated by Prevotella. Interestingly, we observed two subgroups within the second cluster that were represented exclusively by children with an ASD diagnosis, irrespective of GI symptoms (i.e. combined group of ASDGI plus ASDNoGI) (Figure 5a). In the third cluster a predominance of subjects without GI symptoms was observed, irrespective of their neurodevelopmental status (i.e. ASDNoGI plus TDNoGI) (Figure 5b). When subjects were segregated based on the presence or absence of GI symptoms, relative abundance analysis showed differences in the microbiome composition at the family level between ASDGI and TDGI children (Figure 6). Specifically, Bacteriodaceae, Lachnospiraceae, Prevotellaceae and Ruminococcaceae appeared more abundant in the ASDGI group compared to the TDGI. Interestingly, the same differences were not detected between ASDNoGI and TDNoGI groups. The Cohen-Friendly association plot was used to predict metagenome functional content in our data set (Supplemental Figure 4). These analyses showed strong differences in some pathway representations between ASDGI and TDGI subjects, and between ASDNoGI and TDNoGI. Specifically, the transporters pathways appeared under-represented while the amino sugars and nucleotide sugars pathways were over-represented in ASDGI compared to ASDNoGI. The starch and sucrose metabolism pathways were also under-represented in ASDNoGI, but slightly up-regulated in ASDGI. Finally, the pathways correlated to the two components system were strongly up-regulated in TDGI and under-represented in ASDGI.
Figure 5.
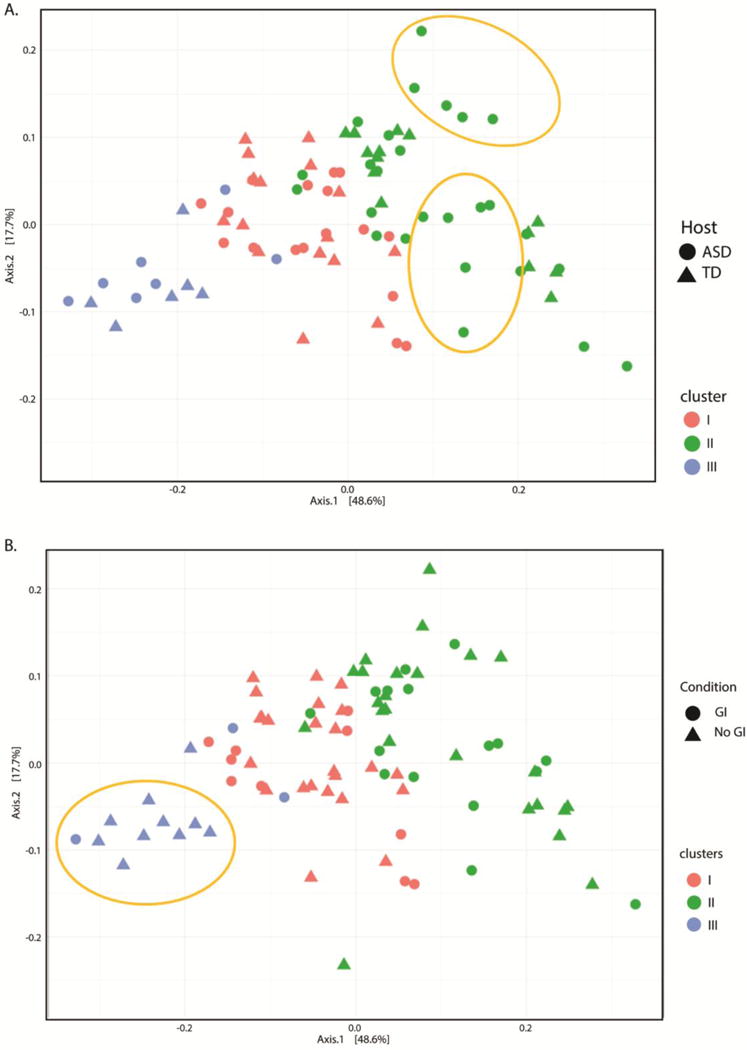
Principal Coordinates analysis of Unifrac distances between samples. (a) Samples colored by cluster’s association and shaped by neurodevelopmental condition. (b) Samples colored by cluster’s association and shaped by presence of GI symptoms. In gold potential subgroups of autistic patients included in cluster two and predominance of subjects without GI symptoms in cluster three,
Figure 6.
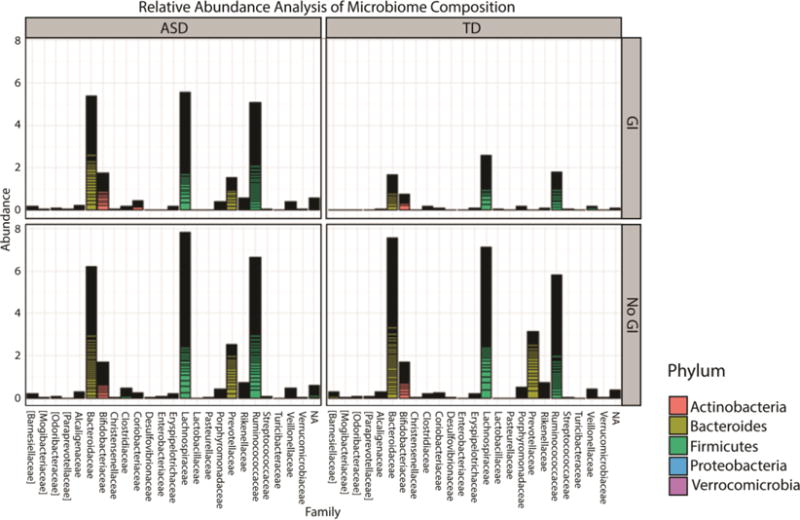
Bar plot showing the relative abundance at family level in the gastrointestinal microbiota of samples collected from different categories of subjects
4. Discussion
We report herein that children with ASDGI produced elevated levels of mucosa relevant cytokines, including IL-5, IL15 and IL-17, after exposure to the TLR-4 agonist LPS when compared to children with ASDNoGI. Moreover, production of TGFβ1 was consistently decreased in children with ASDGI under the majority of conditions examined when compared to both ASDNoGI and TDNoGI. In addition to our immune findings, we found differences in microbiome composition in ASDGI compared to TDGI and differences in several transporters and metabolomic pathways in ASDGI patients compared to ASDNoGI. The ASDGI group also scored higher for irritability and agitation, social withdrawal and lethargy, and hyperactivity and noncompliance on the ABC subscales compared to children in the ASDNoGI group. These preliminary data suggest a possible relationship between the microbiome, immune system and behavioral outcome in ASD.
There is a two-way connection between the microbiota and mucosal immune function. In addition to their symbiotic role during development, this complex relationship continues to ensure homeostasis throughout life. For instance, the immune response can shape the composition of the gut microbiota through several different mechanisms including, production of antimicrobial molecules such as REGIIIα, α-defensins and β-defensins, IgA, and T cells that are specific for commensal bacteria (Hooper et al. 2012, Ostaff et al. 2013). In addition, an inflammatory response and the production of reactive oxygen species along with other immune molecules can lead to preferential growth of certain bacterial species, thus contributing to the composition of the microflora. For example, host-derived nitrate has been found to favor E. Coli growth in mice (Spees et al. 2013, Winter et al. 2013), whereas mice with a mutation in the Nos2 gene and are deficient in inducible nitric oxide synthase, do not support E. coli growth (Winter et al. 2013). Furthermore, alterations in NOD2, NLRP6 and TLR immune pathways can lead to dysbiosis and have been linked to several GI conditions (Netea et al. 2004, Eckmann and Karin 2005, Vijay-Kumar et al. 2010, Elinav et al. 2011, Jiang et al. 2013).
Conversely, the microbiota is crucial to ensure a fully developed immune system (Lee and Mazmanian 2010). Germ free (GF) mice show many immune abnormalities such as altered development of gut associated lymphoid tissue (GALT), with smaller and fewer Peyer’s patches, smaller mesenteric lymph nodes, the absence of isolated lymphoid follicles, as well as deficiencies in secretory IgA, reduced intraepithelial CD8+ T cells and reduced lamina propria immune cells, including CD4+ T cells (Lee and Mazmanian 2010, Hooper et al. 2012). Reduced CD4+ T cell and smaller germinal centers are seen in the spleens of GF mice demonstrating that the microflora is responsible for influencing the systemic/peripheral immune system in addition to GALT (Lee and Mazmanian 2010). GF mice also exhibit behavioral abnormalities including impairments in social behaviors, specifically in social avoidance and decreased preference for social novelty (Desbonnet et al. 2014). Interestingly, deficits in social avoidance were reversed after bacterial colonization and establishment of the microbiota in GF mice.
The increased production of IL-5, IL-15 and IL-17 in ASDGI compared to ASDNoGI has a number of implications for mucosal immune function. IL-5 is an important cytokine for antibody class switching and promotes class switching to IgA, the major antibody class in mucosal tissues (Harriman et al. 1988). IgA has been demonstrated to play a role in intestinal protection from pathogenic bacteria, viruses and toxins as well as helping to maintain intestinal homeostasis (Mantis et al. 2011). IL-15 is produced by innate immune cells such as macrophages, dendritic cells (DC) and epithelial cells; and promotes T cell proliferation, survival and cytokine production. It is also involved in the upregulation of NK cell cytokine production, cytotoxicity and survival, as well as B cell survival and isotype switching (Stevceva et al. 2006). In the gut, IL-15 can induce proliferation of intestinal epithelial cells and can influence the expression of the mucosal adhesion integrin, αEβ7, on intraepithelial T cells (Stevceva et al. 2006). IL-15 has also been found to be overexpressed in the gut mucosa of patients with celiac disease, and is thought to contribute to epithelial damage (Mention et al. 2003). Furthermore, a recent study demonstrated that IL-15 blocks induced regulatory T cell (Tregs) generation in the gut by inducing IL-12p70 and IL-23 production in DC (DePaolo et al. 2011). Normally, DC located in the mesenteric lymph nodes induce the generation of Tregs after being primed by TGFβ1 and retinoic acid (RA) (Coombes and Powrie 2008). However, in the presence of IL-15, RA increases pro-inflammatory cytokine production leading to TH1 skewing, or with the additional presence of IL-6 leads to TH17 differentiation (DePaolo et al. 2011). Lastly, increased IL-17 was observed in ASDGI compared to ASDNoGI and is an important inflammatory mucosal cytokine and has been implicated in GI disorders such as Crohn’s disease, celiac disease and IBD (Iwakura and Ishigame 2006, O’Connor et al. 2010, Lahdenpera et al. 2012, Huppler et al. 2014). IL-17 is important for priming T cells and recruitment of neutrophils, and also acts on endothelial cells, epithelial cells, neutrophils and macrophages to produce inflammatory cytokines such as IL-1, IL-6 and TNFα (Iwakura and Ishigame 2006, O’Connor et al. 2010). Recent research in a mouse model evaluating the role immune responses have on fetal development, discovered direct injection of IL-17 into the developing brain resulted in early brain overgrowth and ASD-relevant behaviors (Choi et al. 2016). The effects of increased IL-17 in ASDGI, therefore, may have behavioral as well as mucosal consequences.
A major difference between the ASD groups (ASDGI and ASDNoGI) was the decreased production of TGFβ1 that occurred in many of the stimulatory conditions tested, and strongly suggests an imbalance in immune regulation. We, and others, have previously reported finding decreased TGFβ1 levels in plasma of adults and children with ASD (Okada et al. 2007, Ashwood et al. 2008) and the relationship between low plasma levels of TGFβ1 and worse behavior scores (Ashwood et al. 2008). Furthermore, recent studies investigating microRNAs (miRNAs) in individuals with ASD have found differentially expressed miRNAs in individuals with ASD in various tissue samples, which implied alterations in the control of TGFβ1 pathways (Mundalil Vasu et al. 2014, Ander et al. 2015, Huang et al. 2015). TGFβ signaling plays an important role in neurodevelopment as well as immune homeostasis. The TGFβ family participates in regulating neural outgrowth, synapse formation, initiate axon formation, neural migration and may also play a part in synaptogenesis and hippocampal synaptic plasticity (Krieglstein et al. 2011). Reduced TGFβ1 could potentially impact many of these processes, as well as disrupt control of inflammatory immune responses that can also elicit changes in neuronal function.
On a cellular level, the increased IL-17 and decreased TGFβ1 may represent a shift in T cell subsets, moving away from Tregs and towards a more inflammatory TH17 cell. One recent study reported finding decreased expression of the transcription factor necessary for Tregs, while finding increases in transcription factors important for TH1, TH2 and TH17 lineages (Ahmad et al. 2016). Maintaining homeostasis in the gut is a crucial balancing act providing tolerance to important beneficial microbes and resisting potential pathogenic microbes, and one that rest on the ability of the immune system to make this distinction and respond appropriately. Traditionally, the transcription factor RORγt is expressed and involved in the differentiation of TH17 cells while Foxp3 is involved in regulatory T cell differentiation (Korn et al. 2009, Harrison and Powrie 2013). However, recent studies have also found populations of T cells in the gut that express both Rorγt and Foxp3, produce the regulatory cytokine IL-10 instead of IL-17 and are functionally equivalent to Tregs (Lochner et al. 2008). The microbiota play an important role in the induction of Rorγ+ Tregs demonstrated by the decreased proportion of colonic Rorγ+ T cells seen in GF mice, and subsequent increases after colonization by various bacterial species (Sefik et al. 2015), again, reiterating the importance of the immune-microbiota relationship. Studies investigating the stability of Foxp3 have also shown that a subset of cells that once expressed Foxp3 and express signature Tregs surface molecules such as folate receptor 4, CD103 and cytotoxic T lymphocyte-associated antigen could lose Foxp3 expression and take on an activated-memory T cell phenotype under inflammatory conditions, but may also retain the ability to upregulate Foxp3 and regain a Tregs phenotype (Komatsu et al. 2009, Zhou et al. 2009). Better understanding of the plasticity of Tregs in ASD and what factors contribute to shifts in these cell populations in ASD should be investigated further.
While this study was mainly focused on characterizing differences in the ASDGI subgroup, we also found children in the ASDNoGI group exhibit increased levels of IL-1α, IL-1β and TNFα after TLR-4 stimulation with LPS. Other studies that have looked at induced responses of peripheral immune cells also reported findings of increased innate cytokine production such as TNFα, IL-1β, and IL-6 (Jyonouchi et al. 2001, Jyonouchi et al. 2002, Enstrom et al. 2010, Jyonouchi et al. 2014). In a previous study utilizing a younger cohort of children, 2 to 5 years of age, we found elevated cytokine production, notably IL-1β, after TLR-4 stimulation of isolated blood monocytes from children with ASD (Enstrom et al. 2010). This current study also points to increased innate responses in children with ASDNoGI and may also lend support to the idea that increased immune responses persists over time.
Loss of function mutations in NOD genes have been associated with increased susceptibility for Crohn’s disease, a GI disorder characterized by severe GI inflammation (Eckmann and Karin 2005). We used PGN to stimulate an innate immune response via signaling through intracellular NOD receptors, NOD1 and NOD2 similar to work by others (McDonald et al. 2005, Sorbara and Philpott 2011). Compared with TDNoGI children, decreased cytokine responses were noted in the ASDNoGI group. NOD2 activation in specialized epithelial cells, including paneth cells, results in increased production of antimicrobial molecules such as defensins, that can shape the microbiota (Eckmann and Karin 2005). Such activation, also leads to cytokine production, including the anti-inflammatory cytokine IL-10, a decrease in which may lead to inflammation (Netea et al. 2004). Interestingly, a study looking at PBMC in ASD children found that those who have marked behavioral fluctuations and GI symptoms have downregulated immune responses to certain immune stimuli making them more vulnerable to infection (Jyonouchi et al. 2011). Our study highlights context dependent stimulation in ASD that may relate to specific signaling pathways as mentioned above. Further research on the reasons for such differential responses to a range of immune stimuli that are observed in different ASD subsets is warranted.
From the analysis of the microbiome, we were able to identify three different clusters in our set of data; one cluster showing a predominance of samples with GI symptoms and another cluster containing two subgroups comprised exclusively by ASD subjects. Similarly to what other studies have found (Wang et al. 2014, Rosenfeld 2015, Son et al. 2015), our data showed differences in the microbiome composition of children with ASD when compared to TD groups, irrespective of GI symptoms. In the ASDGI group compared to the TDGI, relative abundance analyses were different for several bacterial families (namely increased Bacteriodaceae, Lachnospiraceae, Ruminococcaceae and Prevocellaceae). However, these data should be approached cautiously due to the limited sample size and younger age of the TDGI group. Interestingly, we did not detect the same differences between ASDNoGI and TDNoGI individuals. In addition, Cohen Friendly analysis showed that some microbiome related biological pathways were differentially represented between groups. Differences in pathway analysis occurred both in trait conditions (i.e. ASD or TD) and in state conditions (i.e. with or without GI symptoms), suggesting that the alterations in the pathways processes are also related to the presence of ASD and not simply to dysbiosis in the GI tract. These disparate pathways may also interact with the reported alterations of several other signaling pathways associated with ASD such as mTOR (Takei and Nawa 2014), Erk1/2 (Pinto et al. 2014), and growth factors important to neurodevelopment (Sadakata and Furuichi 2009).
Based on the lactulose:mannitol test, increased GI permeability has been demonstrated in ASD and may be another mechanism whereby microbiota and the immune system interact in some children. Zonulin, a molecule that regulates intestinal permeability, is the precursor of haptoglobin 2 (pre-Hp2) (Tripathi et al. 2009). Two co-dominant allele variants, termed HP1 and HP2, the latter unique to the human species, are variously distributed in the general population, resulting in three genotypes, HP1-1 (~20%), HP2-1 (~50%), and HP2-2 (~30%) (Melamed-Frank et al. 2001). The structural arrangements of the ensuing α1/α2 variants with a non-polymorphic β chain vary considerably across the three phenotypes, carrying important functional and biologic implications (Papp et al. 2008, Polticelli et al. 2008). Several studies have suggested that the presence of the HP2 allele correlates with higher risk to develop immune-mediated diseases (Blum et al. 2008, Papp et al. 2008) and HP2 homozygosis is associated with poor prognosis (Delanghe et al. 1998, Kasvosve et al. 2000) and decreased longevity (Napolioni et al. 2011). We observed a non-significant trend for over-representation of the HP2 gene product in all ASD patients and a significant difference between ASDGI and TDGI. With the identification of zonulin as pre-Hp2 it can be postulated that the presence of the HP2 gene (either in heterozygosis or homozygosis) may lead to predisposition of increase intestinal permeability. Loss of gut barrier function could facilitate the pathogenic bacteria and/or their components (including endotoxins), as well as food-derived peptides into the intestinal mucosal and eventually blood stream leading to subsequent increased interactions with immune cells. Increased blood levels of LPS, a byproduct of the cell walls of gram negative bacteria, has been found in some ASD children; a finding that was associated with increased IL-6 production (Emanuele et al. 2010). Additionally, the HP gene is under IL-6 regulation (Oliviero and Cortese 1989) and therefore the increased IL-6 in ASDGI children may lead to the overexpression of the zonulin (HP2) gene in patients who have at least one copy. A local immune response in the gut can contribute to the degradation of intestinal barrier which may lead to increased transit of intestinal bacterial products in ASD. Cytokines such as IL-6 are known to modify neuronal function and have been associated with increased behavioral impairment in ASD (Onore et al. 2012). Thus, intestinal bacteria may communicate indirectly with the CNS by way of the mucosal and peripheral immune system that could stimulate vagal sensory nerve fibers in the intestine (Goehler et al. 2000).
Commensal and pathogenic microbes can impact the gut through the release of Short-chain fatty acids (SCFA) (MacFabe, 2015). SCFA influence the gut and other organs by affecting metabolism and mitochondria function, acting as signaling molecules, reducing GI motility and modulating immune cells (Vinolo et al. 2011, den Besten et al. 2013, MacFabe 2015). The most common SCFA produced in the gut are propionic acid (PPA), butyric acid and acetic acid (MacFabe 2015). GI symptoms and metabolic disorders often co-occur within ASD (Frye et al. 2013, Frye et al. 2015, Rose et al. 2017). While SCFA have been shown to have beneficial influences/impact on health, concentration and host factors play a role. For example, one study found PPA exposure on lymphoblastic cell lines increased ATP-linked respiration, reserve capacity and maximal respiration; factors which are important to production of energy and a cells ability to adapt to metabolic stressors. However, increased concentrations of PPA also increased proton leaking and increased reactive oxygen species (ROS) which negatively impact mitochondria. Therefore, at certain concentrations PPA can be beneficial to the cell, but at high concentrations there may be a negative effect (Frye et al. 2016). Host factors also contribute, as children with ASD showed a more robust response to PPA with increases in ATP-linked respiration, reserve capacity and maximal respiration, however, under oxidative conditions the beneficial effects from PPA were lost, as proton leak respiration increased leading to a reduction in reserve capacity (Frye et al. 2016). A follow up study from the same group found that PPA exposure to lymphoblastic cells from children with ASD who demonstrated atypical mitochondrial responses, resulted in upregulation of genes associated with immune activation, including genes responsible for immunoglobulin production and regulating T cells (Frye et al. 2017). The interplay between GI, immune and metabolic function warrants further analyses in large cohort studies. While we are excited about our study findings we feel it’s important to note a few limitations. Our study is limited by small sample sizes that impacted how we could stratify our study population. As in other studies it was difficult to recruit typically developing children who experience GI issues due to their low frequency in the general population. Due to limited numbers we were unable to further break down groups to compare differences between specific symptoms clusters (e.g. constipation vs. diarrhea vs. IBS), or microbial composition, etc. This study also primarily consists of males and while the ratios are consistent with the gender ratio of ASD, we did not have sufficient statistical power to analyze sex differences due to the low number of females per group. Finally, our study included a wide age group, ranging from 3 years of age to 12 years of age, with larger sample sizes it may have been possible to compare data across age. Despite these limitations we feel that this study provides valuable insights for children with ASD and GI symptoms.
5. Conclusions
We found several differences when comparing children with ASD who exhibit GI symptoms vs. those that did not. The most notable of these was the reduced regulatory TGFβ1 response of the ASDGI groups following stimulation. We also noted an increase in the production of cytokines linked to mucosal inflammation after TLR-4 stimulation in children with ASDGI symptoms relative to children with ASDNoGI. Our analysis of the microbiome underscore the relationship between the presence of GI symptoms and the host microflora, and suggest a possible role of dysbiosis in the co-morbidity of GI issues in ASD.
Supplementary Material
Supplemental Table 1: Distribution of Hp genotypes in ASD and TD children. (% shown in parentheses)
Supplemental Figure 1: Flow chart depicting GI Survey questions asked to all study participates. Questions were prompted and recorded by trained staff. Participants were asked to answer with yes, no or I don’t know for all questions with the exception of those which asked for a specific date. The survey began with the constipation section, followed by the diarrhea section and then IBS. Participates answered questions for all sections even if they had already met the criteria for an earlier section. Only one participant met the criteria for more than one category, an individual with ASD qualified for both constipation and Diarrhea. Participants must have been experiencing symptoms for at least 6 months in order to meet criteria for specific category.
Supplemental Figure 2: Heat map depicting differences between typically developing children without GI symptoms (TDNOGI) and typically developed with GI symptoms (TDGI). Red indicates a significant (p < 0.05) increase in cytokine production in the TDGI group compared to TDNOGI; blue indicates a significant (p < 0.05) decrease in cytokine production in the TDGI group compared to TDNOGI. Data presented as medians.
Supplemental Figure 3: Gap statistic analysis was used to estimate the correct number of cluster in the set of 16s data.
Supplemental Figure 4: Cohen-Friendly association plot representing pathways representations in different groups of subjects. The height of each rectangle is proportional to the normalized differences of the observed and expected counts, denoting the extent of deviation from the baseline and the width is proportional to the square root of expected counts. The black rectangle indicate that the observed frequency is higher than expected, therefore suggesting an enrichment in the category, while red rectangles denote depletion in that category.
Highlights.
Children with ASD and GI symptoms have lower levels of regulatory immune cytokines compared to ASD without GI or healthy typically developing children
Increased mucosa-related inflammatory cytokines were also found in children with ASD and GI co-morbidities compared to ASD without GI.
ASDGI had over-representation of the zonulin encoding HP2 gene and a trend toward over-expression of IL-6, making them at higher risk to increased gut permeability
The microbiota composition of ASDGI differed from the other three groups and was mechanistically linked to altered pathways possibly involved in ASD pathogenesis and chronic gut inflammation.
Acknowledgments
We would like to thank the participants and their families for their participation in the study and the staff of both the University of California Davis M.I.N.D. Institute and the CHARGE project for their technical support. This study was funded by Autism Speaks Foundation (Grant #7567), NIH grants #R21HD086669, R21ES025560, R01ES015359, P30ES23513, U54HD079125, UL1TR001860, R01DK048373 and P01ES011269; Jane Botsford Johnson Foundation, Jonty Foundation and Peter Emch Foundation.
Footnotes
Publisher's Disclaimer: This is a PDF file of an unedited manuscript that has been accepted for publication. As a service to our customers we are providing this early version of the manuscript. The manuscript will undergo copyediting, typesetting, and review of the resulting proof before it is published in its final citable form. Please note that during the production process errors may be discovered which could affect the content, and all legal disclaimers that apply to the journal pertain.
References
- Abrahams BS, Geschwind DH. Advances in autism genetics: on the threshold of a new neurobiology. Nat Rev Genet. 2008;9(5):341–355. doi: 10.1038/nrg2346. [DOI] [PMC free article] [PubMed] [Google Scholar]
- Ahmad SF, Zoheir KM, Ansari MA, Nadeem A, Bakheet SA, Al-Ayadhi LY, Alzahrani MZ, Al-Shabanah OA, Al-Harbi MM, Attia SM. Dysregulation of Th1, Th2, Th17, and T regulatory cell-related transcription factor signaling in children with autism. Mol Neurobiol. 2016 doi: 10.1007/s12035-016-9977-0. [DOI] [PubMed] [Google Scholar]
- Ander BP, Barger N, Stamova B, Sharp FR, Schumann CM. Atypical miRNA expression in temporal cortex associated with dysregulation of immune, cell cycle, and other pathways in autism spectrum disorders. Mol Autism. 2015;6:37. doi: 10.1186/s13229-015-0029-9. [DOI] [PMC free article] [PubMed] [Google Scholar]
- Arumugam M, Raes J, Pelletier E, Le Paslier D, Yamada T, Mende DR, Fernandes GR, Tap J, Bruls T, Batto JM, Bertalan M, Borruel N, Casellas F, Fernandez L, Gautier L, Hansen T, Hattori M, Hayashi T, Kleerebezem M, Kurokawa K, Leclerc M, Levenez F, Manichanh C, Nielsen HB, Nielsen T, Pons N, Poulain J, Qin J, Sicheritz-Ponten T, Tims S, Torrents D, Ugarte E, Zoetendal EG, Wang J, Guarner F, Pedersen O, de Vos WM, Brunak S, Dore J, Weissenbach J, Ehrlich SD, Bork P. Enterotypes of the human gut microbiome. Nature. 2011;473(7346):174–180. doi: 10.1038/nature09944. [DOI] [PMC free article] [PubMed] [Google Scholar]
- Ashwood P, Anthony A, Pellicer AA, Torrente F, Walker-Smith JA, Wakefield AJ. Intestinal lymphocyte populations in children with regressive autism: evidence for extensive mucosal immunopathology. J Clin Immunol. 2003;23(6):504–517. doi: 10.1023/b:joci.0000010427.05143.bb. [DOI] [PubMed] [Google Scholar]
- Ashwood P, Anthony A, Torrente F, Wakefield AJ. Spontaneous mucosal lymphocyte cytokine profiles in children with autism and gastrointestinal symptoms: mucosal immune activation and reduced counter regulatory interleukin-10. J Clin Immunol. 2004;24(6):664–673. doi: 10.1007/s10875-004-6241-6. [DOI] [PubMed] [Google Scholar]
- Ashwood P, Enstrom A, Krakowiak P, Hertz-Picciotto I, Hansen RL, Croen LA, Ozonoff S, Pessah IN, Van de Water J. Decreased transforming growth factor beta1 in autism: a potential link between immune dysregulation and impairment in clinical behavioral outcomes. J Neuroimmunol. 2008;204(1-2):149–153. doi: 10.1016/j.jneuroim.2008.07.006. [DOI] [PMC free article] [PubMed] [Google Scholar]
- Asperger H. Psychopathology of children with coeliac disease. Ann Paediatr. 1961;197:346–351. [PubMed] [Google Scholar]
- Ballard J, Crane DR, Harper JM, Fawcett D, Sandberg J. Mental health service utilization in autism spectrum disorders. Research in Autism Spectrum Disorders. 2016;23:84–93. [Google Scholar]
- Bauman ML. Medical comorbidities in autism: challenges to diagnosis and treatment. Neurotherapeutics. 2010;7(3):320–327. doi: 10.1016/j.nurt.2010.06.001. [DOI] [PMC free article] [PubMed] [Google Scholar]
- Blum S, Milman U, Shapira C, Levy AP. Pharmacogenomic application of the haptoglobin genotype in the prevention of diabetic cardiovascular disease. Pharmacogenomics. 2008;9(8):989–991. doi: 10.2217/14622416.9.8.989. [DOI] [PubMed] [Google Scholar]
- Buie T, Campbell DB, Fuchs GJ, 3rd, Furuta GT, Levy J, Vandewater J, Whitaker AH, Atkins D, Bauman ML, Beaudet AL, Carr EG, Gershon MD, Hyman SL, Jirapinyo P, Jyonouchi H, Kooros K, Kushak R, Levitt P, Levy SE, Lewis JD, Murray KF, Natowicz MR, Sabra A, Wershil BK, Weston SC, Zeltzer L, Winter H. Evaluation, diagnosis, and treatment of gastrointestinal disorders in individuals with ASDs: a consensus report. Pediatrics. 2010;125(Suppl 1):S1–18. doi: 10.1542/peds.2009-1878C. [DOI] [PubMed] [Google Scholar]
- Bushara KO. Neurologic presentation of celiac disease. Gastroenterology. 2005;128(4 Suppl 1):S92–97. doi: 10.1053/j.gastro.2005.02.018. [DOI] [PubMed] [Google Scholar]
- Caporaso JG, Kuczynski J, Stombaugh J, Bittinger K, Bushman FD, Costello EK, Fierer N, Pena AG, Goodrich JK, Gordon JI, Huttley GA, Kelley ST, Knights D, Koenig JE, Ley RE, Lozupone CA, McDonald D, Muegge BD, Pirrung M, Reeder J, Sevinsky JR, Turnbaugh PJ, Walters WA, Widmann J, Yatsunenko T, Zaneveld J, Knight R. QIIME allows analysis of high-throughput community sequencing data. Nat Methods. 2010;7(5):335–336. doi: 10.1038/nmeth.f.303. [DOI] [PMC free article] [PubMed] [Google Scholar]
- Chaidez V, Hansen RL, Hertz-Picciotto I. Gastrointestinal problems in children with autism, developmental delays or typical development. J Autism Dev Disord. 2014;44(5):1117–1127. doi: 10.1007/s10803-013-1973-x. [DOI] [PMC free article] [PubMed] [Google Scholar]
- Choi GB, Yim YS, Wong H, Kim S, Kim H, Kim SV, Hoeffer CA, Littman DR, Huh JR. The maternal interleukin-17a pathway in mice promotes autism-like phenotypes in offspring. Science. 2016 doi: 10.1126/science.aad0314. [DOI] [PMC free article] [PubMed] [Google Scholar]
- Cohen A. On the graphical display of the significant components in a two-way contingency table. Communications in Statistics—Theory and Methods. 1980;A9:1025–1041. [Google Scholar]
- Coombes JL, Powrie F. Dendritic cells in intestinal immune regulation. Nat Rev Immunol. 2008;8(6):435–446. doi: 10.1038/nri2335. [DOI] [PMC free article] [PubMed] [Google Scholar]
- Coury DL, Ashwood P, Fasano A, Fuchs G, Geraghty M, Kaul A, Mawe G, Patterson P, Jones NE. Gastrointestinal conditions in children with autism spectrum disorder: developing a research agenda. Pediatrics. 2012;130(Suppl 2):S160–168. doi: 10.1542/peds.2012-0900N. [DOI] [PubMed] [Google Scholar]
- D’Eufemia P, Celli M, Finocchiaro R, Pacifico L, Viozzi L, Zaccagnini M, Cardi E, Giardini O. Abnormal intestinal permeability in children with autism. Acta Paediatr. 1996;85(9):1076–1079. doi: 10.1111/j.1651-2227.1996.tb14220.x. [DOI] [PubMed] [Google Scholar]
- de Magistris L, Familiari V, Pascotto A, Sapone A, Frolli A, Iardino P, Carteni M, Rosa M De, Francavilla R, Riegler G, Militerni R, Bravaccio C. Alterations of the intestinal barrier in patients with autism spectrum disorders and in their first-degree relatives. J Pediatr Gastroenterol Nutr. 2010;51(4):418–424. doi: 10.1097/MPG.0b013e3181dcc4a5. [DOI] [PubMed] [Google Scholar]
- Delanghe JR, Langlois MR, Boelaert JR, Van Acker J, Van Wanzeele F, van der Groen G, Hemmer R, Verhofstede C, De Buyzere M, De Bacquer D, Arendt V, Plum J. Haptoglobin polymorphism, iron metabolism and mortality in HIV infection. AIDS. 1998;12(9):1027–1032. [PubMed] [Google Scholar]
- den Besten G, van Eunen K, Groen AK, Venema K, Reijngoud DJ, Bakker BM. The role of short-chain fatty acids in the interplay between diet, gut microbiota, and host energy metabolism. J Lipid Res. 2013;54(9):2325–2340. doi: 10.1194/jlr.R036012. [DOI] [PMC free article] [PubMed] [Google Scholar]
- DePaolo RW, Abadie V, Tang F, Fehlner-Peach H, Hall JA, Wang W, Marietta EV, Kasarda DD, Waldmann TA, Murray JA, Semrad C, Kupfer SS, Belkaid Y, Guandalini S, Jabri B. Co-adjuvant effects of retinoic acid and IL-15 induce inflammatory immunity to dietary antigens. Nature. 2011;471(7337):220–224. doi: 10.1038/nature09849. [DOI] [PMC free article] [PubMed] [Google Scholar]
- Desbonnet L, Clarke G, Shanahan F, Dinan TG, Cryan JF. Microbiota is essential for social development in the mouse. Mol Psychiatry. 2014;19(2):146–148. doi: 10.1038/mp.2013.65. [DOI] [PMC free article] [PubMed] [Google Scholar]
- Eckmann L, Karin M. NOD2 and Crohn’s disease: loss or gain of function? Immunity. 2005;22(6):661–667. doi: 10.1016/j.immuni.2005.06.004. [DOI] [PubMed] [Google Scholar]
- Edgar RC. Search and clustering orders of magnitude faster than BLAST. Bioinformatics. 2010;26(19):2460–2461. doi: 10.1093/bioinformatics/btq461. [DOI] [PubMed] [Google Scholar]
- Edgar RC, Haas BJ, Clemente JC, Quince C, Knight R. UCHIME improves sensitivity and speed of chimera detection. Bioinformatics. 2011;27(16):2194–2200. doi: 10.1093/bioinformatics/btr381. [DOI] [PMC free article] [PubMed] [Google Scholar]
- Elinav E, Strowig T, Kau Andrew L, Henao-Mejia J, Thaiss Christoph A, Booth Carmen J, Peaper David R, Bertin J, Eisenbarth Stephanie C, Gordon Jeffrey I, Flavell Richard A. NLRP6 Inflammasome Regulates Colonic Microbial Ecology and Risk for Colitis. Cell. 2011;145(5):745–757. doi: 10.1016/j.cell.2011.04.022. [DOI] [PMC free article] [PubMed] [Google Scholar]
- Emanuele E, Orsi P, Boso M, Broglia D, Brondino N, Barale F, di Nemi SU, Politi P. Low-grade endotoxemia in patients with severe autism. Neurosci Lett. 2010;471(3):162–165. doi: 10.1016/j.neulet.2010.01.033. [DOI] [PubMed] [Google Scholar]
- Enstrom AM, Onore CE, Van de Water JA, Ashwood P. Differential monocyte responses to TLR ligands in children with autism spectrum disorders. Brain Behav Immun. 2010;24(1):64–71. doi: 10.1016/j.bbi.2009.08.001. [DOI] [PMC free article] [PubMed] [Google Scholar]
- Fadrosh D, Ma B, Gajer P, Sengamalay N, Ott S, Brotman RM, Ravel J. An Improved Dual-Indexing Approach for Multiplexed 16S rRNA Gene Sequencing on the Illumina MiSeq Platform. doi: 10.1186/2049-2618-2-6. under review. [DOI] [PMC free article] [PubMed] [Google Scholar]
- Fadrosh DW, Ma B, Gajer P, Sengamalay N, Ott S, Brotman RM, Ravel J. An improved dual-indexing approach for multiplexed 16S rRNA gene sequencing on the Illumina MiSeq platform. Microbiome. 2014;2(1):6. doi: 10.1186/2049-2618-2-6. [DOI] [PMC free article] [PubMed] [Google Scholar]
- Fasano A, Catassi C. Coeliac disease in children. Best Pract Res Clin Gastroenterol. 2005;19(3):467–478. doi: 10.1016/j.bpg.2005.01.008. [DOI] [PubMed] [Google Scholar]
- Finegold SM, Dowd SE, Gontcharova V, Liu C, Henley KE, Wolcott RD, Youn E, Summanen PH, Granpeesheh D, Dixon D, Liu M, Molitoris DR, Green JA., 3rd Pyrosequencing study of fecal microflora of autistic and control children. Anaerobe. 2010;16(4):444–453. doi: 10.1016/j.anaerobe.2010.06.008. [DOI] [PubMed] [Google Scholar]
- Finegold SM, Molitoris D, Song Y, Liu C, Vaisanen ML, Bolte E, McTeague M, Sandler R, Wexler H, Marlowe EM, Collins MD, Lawson PA, Summanen P, Baysallar M, Tomzynski TJ, Read E, Johnson E, Rolfe R, Nasir P, Shah H, Haake DA, Manning P, Kaul A. Gastrointestinal microflora studies in late-onset autism. Clin Infect Dis. 2002;35(Suppl 1):S6–S16. doi: 10.1086/341914. [DOI] [PubMed] [Google Scholar]
- Friendly M. Graphical methods for categorical data. SAS User Group International Conference Proceedings. 1992;17:190–200. [Google Scholar]
- Frye RE, Melnyk S, MacFabe DF. Unique acyl-carnitine profiles are potential biomarkers for acquired mitochondrial disease in autism spectrum disorder. Translational Psychiatry. 2013;3(1):e220. doi: 10.1038/tp.2012.143. [DOI] [PMC free article] [PubMed] [Google Scholar]
- Frye RE, Nankova B, Bhattacharyya S, Rose S, Bennuri SC, MacFabe DF. Modulation of Immunological Pathways in Autistic and Neurotypical Lymphoblastoid Cell Lines by the Enteric Microbiome Metabolite Propionic Acid. Frontiers in Immunology. 2017;8(1670) doi: 10.3389/fimmu.2017.01670. [DOI] [PMC free article] [PubMed] [Google Scholar]
- Frye RE, Rose S, Chacko J, Wynne R, Bennuri SC, Slattery JC, Tippett M, Delhey L, Melnyk S, Kahler SG, MacFabe DF. Modulation of mitochondrial function by the microbiome metabolite propionic acid in autism and control cell lines. Transl Psychiatry. 2016;6(10):e927. doi: 10.1038/tp.2016.189. [DOI] [PMC free article] [PubMed] [Google Scholar]
- Frye RE, Rose S, Slattery J, MacFabe DF. Gastrointestinal dysfunction in autism spectrum disorder: the role of the mitochondria and the enteric microbiome. Microb Ecol Health Dis. 2015;26:27458. doi: 10.3402/mehd.v26.27458. [DOI] [PMC free article] [PubMed] [Google Scholar]
- Furlano RI, Anthony A, Day R, Brown A, McGarvey L, Thomson MA, Davies SE, Berelowitz M, Forbes A, Wakefield AJ, Walker-Smith JA, Murch SH. Colonic CD8 and gamma delta T-cell infiltration with epithelial damage in children with autism. J Pediatr. 2001;138(3):366–372. doi: 10.1067/mpd.2001.111323. [DOI] [PubMed] [Google Scholar]
- Genuis SJ, Bouchard TP. Celiac disease presenting as autism. J Child Neurol. 2010;25(1):114–119. doi: 10.1177/0883073809336127. [DOI] [PubMed] [Google Scholar]
- Geschwind DH. Autism: Many Genes, Common Pathways? Cell. 2008;135(3):391–395. doi: 10.1016/j.cell.2008.10.016. [DOI] [PMC free article] [PubMed] [Google Scholar]
- Gillberg C, Billstedt E. Autism and Asperger syndrome: coexistence with other clinical disorders. Acta Psychiatrica Scandinavica. 2000;102(5):321–330. doi: 10.1034/j.1600-0447.2000.102005321.x. [DOI] [PubMed] [Google Scholar]
- Goehler LE, Gaykema RP, Hansen MK, Anderson K, Maier SF, Watkins LR. Vagal immune-to-brain communication: a visceral chemosensory pathway. Auton Neurosci. 2000;85(1-3):49–59. doi: 10.1016/S1566-0702(00)00219-8. [DOI] [PubMed] [Google Scholar]
- Hadjivassiliou M, Grunewald RA, Davies-Jones GA. Gluten sensitivity as a neurological illness. J Neurol Neurosurg Psychiatry. 2002;72(5):560–563. doi: 10.1136/jnnp.72.5.560. [DOI] [PMC free article] [PubMed] [Google Scholar]
- Hale-Donze H, Wahl SM, Jackson RJ, McGhee JR. Current Protocols in Immunology. John Wiley & Sons, Inc; 2001. Measurement of TGF-β in Biological Fluids. [DOI] [PubMed] [Google Scholar]
- Hallert C, Derefeldt T. Psychic Disturbances in Adult Coeliac Disease. Scandinavian Journal of Gastroenterology. 1982;17(1):17–19. doi: 10.3109/00365528209181037. [DOI] [PubMed] [Google Scholar]
- Hallmayer J, Cleveland S, Torres A, Phillips J, Cohen B, Torigoe T, Miller J, Fedele A, Collins J, Smith K, Lotspeich L, Croen LA, Ozonoff S, Lajonchere C, Grether JK, Risch N. Genetic heritability and shared environmental factors among twin pairs with autism. Arch Gen Psychiatry. 2011;68(11):1095–1102. doi: 10.1001/archgenpsychiatry.2011.76. [DOI] [PMC free article] [PubMed] [Google Scholar]
- Harriman GR, Kunimoto DY, Elliott JF, Paetkau V, Strober W. The role of IL-5 in IgA B cell differentiation. J Immunol. 1988;140(9):3033–3039. [PubMed] [Google Scholar]
- Harrison OJ, Powrie FM. Regulatory T cells and immune tolerance in the intestine. Cold Spring Harb Perspect Biol. 2013;5(7) doi: 10.1101/cshperspect.a018341. [DOI] [PMC free article] [PubMed] [Google Scholar]
- Hertz-Picciotto I, Croen LA, Hansen R, Jones CR, van de Water J, Pessah IN. The CHARGE study: an epidemiologic investigation of genetic and environmental factors contributing to autism. Environ Health Perspect. 2006;114(7):1119–1125. doi: 10.1289/ehp.8483. [DOI] [PMC free article] [PubMed] [Google Scholar]
- Hirata I, Mohri I, Kato-Nishimura K, Tachibana M, Kuwada A, Kagitani-Shimono K, Ohno Y, Ozono K, Taniike M. Sleep problems are more frequent and associated with problematic behaviors in preschoolers with autism spectrum disorder. Research in Developmental Disabilities. 2016;49–50:86–99. doi: 10.1016/j.ridd.2015.11.002. [DOI] [PubMed] [Google Scholar]
- Hooper LV, Littman DR, Macpherson AJ. Interactions between the microbiota and the immune system. Science. 2012;336(6086):1268–1273. doi: 10.1126/science.1223490. [DOI] [PMC free article] [PubMed] [Google Scholar]
- Horvath K, Perman JA. Autism and gastrointestinal symptoms. Curr Gastroenterol Rep. 2002;4(3):251–258. doi: 10.1007/s11894-002-0071-6. [DOI] [PubMed] [Google Scholar]
- Huang F, Long Z, Chen Z, Li J, Hu Z, Qiu R, Zhuang W, Tang B, Xia K, Jiang H. Investigation of Gene Regulatory Networks Associated with Autism Spectrum Disorder Based on MiRNA Expression in China. PLoS One. 2015;10(6):e0129052. doi: 10.1371/journal.pone.0129052. [DOI] [PMC free article] [PubMed] [Google Scholar]
- Huppler AR, Conti HR, Hernandez-Santos N, Darville T, Biswas PS, Gaffen SL. Role of neutrophils in IL-17-dependent immunity to mucosal candidiasis. J Immunol. 2014;192(4):1745–1752. doi: 10.4049/jimmunol.1302265. [DOI] [PMC free article] [PubMed] [Google Scholar]
- Iwakura Y, Ishigame H. The IL-23/IL-17 axis in inflammation. Journal of Clinical Investigation. 2006;116(5):1218–1222. doi: 10.1172/JCI28508. [DOI] [PMC free article] [PubMed] [Google Scholar]
- Jiang W, Wang X, Zeng B, Liu L, Tardivel A, Wei H, Han J, MacDonald HR, Tschopp J, Tian Z, Zhou R. Recognition of gut microbiota by NOD2 is essential for the homeostasis of intestinal intraepithelial lymphocytes. J Exp Med. 2013;210(11):2465–2476. doi: 10.1084/jem.20122490. [DOI] [PMC free article] [PubMed] [Google Scholar]
- Jyonouchi H, Geng L, Davidow AL. Cytokine profiles by peripheral blood monocytes are associated with changes in behavioral symptoms following immune insults in a subset of ASD subjects: an inflammatory subtype? Journal of Neuroinflammation. 2014;11:187. doi: 10.1186/s12974-014-0187-2. [DOI] [PMC free article] [PubMed] [Google Scholar]
- Jyonouchi H, Geng L, Streck DL, Toruner GA. Children with autism spectrum disorders (ASD) who exhibit chronic gastrointestinal (GI) symptoms and marked fluctuation of behavioral symptoms exhibit distinct innate immune abnormalities and transcriptional profiles of peripheral blood (PB) monocytes. J Neuroimmunol. 2011;238(1-2):73–80. doi: 10.1016/j.jneuroim.2011.07.001. [DOI] [PubMed] [Google Scholar]
- Jyonouchi H, Sun S, Itokazu N. Innate immunity associated with inflammatory responses and cytokine production against common dietary proteins in patients with autism spectrum disorder. Neuropsychobiology. 2002;46(2):76–84. doi: 10.1159/000065416. [DOI] [PubMed] [Google Scholar]
- Jyonouchi H, Sun S, Le H. Proinflammatory and regulatory cytokine production associated with innate and adaptive immune responses in children with autism spectrum disorders and developmental regression. J Neuroimmunol. 2001;120(1-2):170–179. doi: 10.1016/s0165-5728(01)00421-0. [DOI] [PubMed] [Google Scholar]
- Kang DW, Park JG, Ilhan ZE, Wallstrom G, Labaer J, Adams JB, Krajmalnik-Brown R. Reduced incidence of Prevotella and other fermenters in intestinal microflora of autistic children. PLoS One. 2013;8(7):e68322. doi: 10.1371/journal.pone.0068322. [DOI] [PMC free article] [PubMed] [Google Scholar]
- Kanner L. Autistic disturbances of affective contact. Nerv Child. 1943;2:33. [PubMed] [Google Scholar]
- Kasvosve I, Gomo ZA, Mvundura E, Moyo VM, Saungweme T, Khumalo H, Gordeuk VR, Boelaert JR, Delanghe JR, De Bacquer D, Gangaidzo IT. Haptoglobin polymorphism and mortality in patients with tuberculosis. Int J Tuberc Lung Dis. 2000;4(8):771–775. [PubMed] [Google Scholar]
- Komatsu N, Mariotti-Ferrandiz ME, Wang Y, Malissen B, Waldmann H, Hori S. Heterogeneity of natural Foxp3+ T cells: a committed regulatory T-cell lineage and an uncommitted minor population retaining plasticity. Proc Natl Acad Sci U S A. 2009;106(6):1903–1908. doi: 10.1073/pnas.0811556106. [DOI] [PMC free article] [PubMed] [Google Scholar]
- Korn T, Bettelli E, Oukka M, Kuchroo VK. IL-17 and Th17 Cells. Annu Rev Immunol. 2009;27:485–517. doi: 10.1146/annurev.immunol.021908.132710. [DOI] [PubMed] [Google Scholar]
- Krieglstein K, Zheng F, Unsicker K, Alzheimer C. More than being protective: functional roles for TGF-β/activin signaling pathways at central synapses. Trends in Neurosciences. 2011;34(8):421–429. doi: 10.1016/j.tins.2011.06.002. [DOI] [PubMed] [Google Scholar]
- Lahdenpera AI, Holtta V, Ruohtula T, Salo HM, Orivuori L, Westerholm-Ormio M, Savilahti E, Falth-Magnusson K, Hogberg L, Ludvigsson J, Vaarala O. Up-regulation of small intestinal interleukin-17 immunity in untreated coeliac disease but not in potential coeliac disease or in type 1 diabetes. Clin Exp Immunol. 2012;167(2):226–234. doi: 10.1111/j.1365-2249.2011.04510.x. [DOI] [PMC free article] [PubMed] [Google Scholar]
- Landrigan PJ. What causes autism? Exploring the environmental contribution. Current Opinion in Pediatrics. 2010;22(2):219–225. doi: 10.1097/MOP.0b013e328336eb9a. [DOI] [PubMed] [Google Scholar]
- Langille MG, Zaneveld J, Caporaso JG, McDonald D, Knights D, Reyes JA, Clemente JC, Burkepile DE, Vega Thurber RL, Knight R, Beiko RG, Huttenhower C. Predictive functional profiling of microbial communities using 16S rRNA marker gene sequences. Nat Biotechnol. 2013;31(9):814–821. doi: 10.1038/nbt.2676. [DOI] [PMC free article] [PubMed] [Google Scholar]
- Lee YK, Mazmanian SK. Has the Microbiota Played a Critical Role in the Evolution of the Adaptive Immune System? Science. 2010;330(6012):1768–1773. doi: 10.1126/science.1195568. [DOI] [PMC free article] [PubMed] [Google Scholar]
- Lochner M, Peduto L, Cherrier M, Sawa S, Langa F, Varona R, Riethmacher D, Si-Tahar M, Di Santo JP, Eberl G. In vivo equilibrium of proinflammatory IL-17+ and regulatory IL-10+ Foxp3+ RORgamma t+ T cells. J Exp Med. 2008;205(6):1381–1393. doi: 10.1084/jem.20080034. [DOI] [PMC free article] [PubMed] [Google Scholar]
- MacFabe DF. Enteric short-chain fatty acids: microbial messengers of metabolism, mitochondria, and mind: implications in autism spectrum disorders. Microbial Ecology in Health and Disease. 2015;26 doi: 10.3402/mehd.v3426.28177. [DOI] [PMC free article] [PubMed] [Google Scholar]
- Magoc T, Salzberg SL. FLASH: fast length adjustment of short reads to improve genome assemblies. Bioinformatics. 2011;27(21):2957–2963. doi: 10.1093/bioinformatics/btr507. [DOI] [PMC free article] [PubMed] [Google Scholar]
- Mannion A, Leader G. An investigation of comorbid psychological disorders, sleep problems, gastrointestinal symptoms and epilepsy in children and adolescents with autism spectrum disorder: A two year follow-up. Research in Autism Spectrum Disorders. 2016;22:20–33. [Google Scholar]
- Mannion A, Leader G, Healy O. An investigation of comorbid psychological disorders, sleep problems, gastrointestinal symptoms and epilepsy in children and adolescents with Autism Spectrum Disorder. Research in Autism Spectrum Disorders. 2013;7(1):35–42. [Google Scholar]
- Mantis NJ, Rol N, Corthesy B. Secretory IgA’s complex roles in immunity and mucosal homeostasis in the gut. Mucosal Immunol. 2011;4(6):603–611. doi: 10.1038/mi.2011.41. [DOI] [PMC free article] [PubMed] [Google Scholar]
- McDonald C, Inohara N, Nunez G. Peptidoglycan signaling in innate immunity and inflammatory disease. J Biol Chem. 2005;280(21):20177–20180. doi: 10.1074/jbc.R500001200. [DOI] [PubMed] [Google Scholar]
- McDonald D, Price MN, Goodrich J, Nawrocki EP, DeSantis TZ, Probst A, Andersen GL, Knight R, Hugenholtz P. An improved Greengenes taxonomy with explicit ranks for ecological and evolutionary analyses of bacteria and archaea. The ISME journal. 2012;6(3):610–618. doi: 10.1038/ismej.2011.139. [DOI] [PMC free article] [PubMed] [Google Scholar]
- McMurdie PJ, Holmes S. phyloseq: an R package for reproducible interactive analysis and graphics of microbiome census data. PLoS One. 2013;8(4):e61217. doi: 10.1371/journal.pone.0061217. [DOI] [PMC free article] [PubMed] [Google Scholar]
- Melamed-Frank M, Lache O, Enav BI, Szafranek T, Levy NS, Ricklis RM, Levy AP. Structure-function analysis of the antioxidant properties of haptoglobin. Blood. 2001;98(13):3693–3698. doi: 10.1182/blood.v98.13.3693. [DOI] [PubMed] [Google Scholar]
- Mention JJ, Ben Ahmed M, Begue B, Barbe U, Verkarre V, Asnafi V, Colombel JF, Cugnenc PH, Ruemmele FM, McIntyre E, Brousse N, Cellier C, Cerf-Bensussan N. Interleukin 15: a key to disrupted intraepithelial lymphocyte homeostasis and lymphomagenesis in celiac disease. Gastroenterology. 2003;125(3):730–745. doi: 10.1016/s0016-5085(03)01047-3. [DOI] [PubMed] [Google Scholar]
- Molloy CA, Manning-Courtney P. Prevalence of chronic gastrointestinal symptoms in children with autism and autistic spectrum disorders. Autism. 2003;7(2):165–171. doi: 10.1177/1362361303007002004. [DOI] [PubMed] [Google Scholar]
- Mundalil Vasu M, Anitha A, Thanseem I, Suzuki K, Yamada K, Takahashi T, Wakuda T, Iwata K, Tsujii M, Sugiyama T, Mori N. Serum microRNA profiles in children with autism. Mol Autism. 2014;5:40. doi: 10.1186/2040-2392-5-40. [DOI] [PMC free article] [PubMed] [Google Scholar]
- Napolioni V, Gianni P, Carpi FM, Concetti F, Lucarini N. Haptoglobin (HP) polymorphisms and human longevity: a cross-sectional association study in a Central Italy population. Clin Chim Acta. 2011;412(7-8):574–577. doi: 10.1016/j.cca.2010.12.006. [DOI] [PubMed] [Google Scholar]
- Netea MG, Kullberg BJ, de Jong DJ, Franke B, Sprong T, Naber TH, Drenth JP, Van der Meer JW. NOD2 mediates anti-inflammatory signals induced by TLR2 ligands: implications for Crohn’s disease. Eur J Immunol. 2004;34(7):2052–2059. doi: 10.1002/eji.200425229. [DOI] [PubMed] [Google Scholar]
- Niehus R, Lord C. Early medical history of children with autism spectrum disorders. J Dev Behav Pediatr. 2006;27(2 Suppl):S120–127. doi: 10.1097/00004703-200604002-00010. [DOI] [PubMed] [Google Scholar]
- O’Connor W, Jr, Zenewicz LA, Flavell RA. The dual nature of T(H)17 cells: shifting the focus to function. Nat Immunol. 2010;11(6):471–476. doi: 10.1038/ni.1882. [DOI] [PubMed] [Google Scholar]
- Okada K, Hashimoto K, Iwata Y, Nakamura K, Tsujii M, Tsuchiya KJ, Sekine Y, Suda S, Suzuki K, Sugihara G, Matsuzaki H, Sugiyama T, Kawai M, Minabe Y, Takei N, Mori N. Decreased serum levels of transforming growth factor-beta1 in patients with autism. Prog Neuropsychopharmacol Biol Psychiatry. 2007;31(1):187–190. doi: 10.1016/j.pnpbp.2006.08.020. [DOI] [PubMed] [Google Scholar]
- Oliviero S, Cortese R. The human haptoglobin gene promoter: interleukin-6-responsive elements interact with a DNA-binding protein induced by interleukin-6. EMBO J. 1989;8(4):1145–1151. doi: 10.1002/j.1460-2075.1989.tb03485.x. [DOI] [PMC free article] [PubMed] [Google Scholar]
- Onore C, Careaga M, Ashwood P. The role of immune dysfunction in the pathophysiology of autism. Brain Behav Immun. 2012;26(3):383–392. doi: 10.1016/j.bbi.2011.08.007. [DOI] [PMC free article] [PubMed] [Google Scholar]
- Ostaff MJ, Stange EF, Wehkamp J. Antimicrobial peptides and gut microbiota in homeostasis and pathology. EMBO Molecular Medicine. 2013;5(10):1465–1483. doi: 10.1002/emmm.201201773. [DOI] [PMC free article] [PubMed] [Google Scholar]
- Papp M, Foldi I, Nemes E, Udvardy M, Harsfalvi J, Altorjay I, Mate I, Dinya T, Varvolgyi C, Barta Z, Veres G, Lakatos PL, Tumpek J, Toth L, Szathmari E, Kapitany A, Gyetvai A, Korponay-Szabo IR. Haptoglobin polymorphism: a novel genetic risk factor for celiac disease development and its clinical manifestations. Clinical Chemistry. 2008;54(4):697–704. doi: 10.1373/clinchem.2007.098780. [DOI] [PubMed] [Google Scholar]
- Parracho HM, Bingham MO, Gibson GR, McCartney AL. Differences between the gut microflora of children with autistic spectrum disorders and that of healthy children. J Med Microbiol. 2005;54(Pt 10):987–991. doi: 10.1099/jmm.0.46101-0. [DOI] [PubMed] [Google Scholar]
- Pinto D, Delaby E, Merico D, Barbosa M, Merikangas A, Klei L, Thiruvahindrapuram B, Xu X, Ziman R, Wang Z, Vorstman JA, Thompson A, Regan R, Pilorge M, Pellecchia G, Pagnamenta AT, Oliveira B, Marshall CR, Magalhaes TR, Lowe JK, Howe JL, Griswold AJ, Gilbert J, Duketis E, Dombroski BA, De Jonge MV, Cuccaro M, Crawford EL, Correia CT, Conroy J, Conceicao IC, Chiocchetti AG, Casey JP, Cai G, Cabrol C, Bolshakova N, Bacchelli E, Anney R, Gallinger S, Cotterchio M, Casey G, Zwaigenbaum L, Wittemeyer K, Wing K, Wallace S, Engeland H van, Tryfon A, Thomson S, Soorya L, Roge B, Roberts W, Poustka F, Mouga S, Minshew N, McInnes LA, McGrew SG, Lord C, Leboyer M, Le Couteur AS, Kolevzon A, Jimenez Gonzalez P, Jacob S, Holt R, Guter S, Green J, Green A, Gillberg C, Fernandez BA, Duque F, Delorme R, Dawson G, Chaste P, Cafe C, Brennan S, Bourgeron T, Bolton PF, Bolte S, Bernier R, Baird G, Bailey AJ, Anagnostou E, Almeida J, Wijsman EM, Vieland VJ, Vicente AM, Schellenberg GD, Pericak-Vance M, Paterson AD, Parr JR, Oliveira G, Nurnberger JI, Monaco AP, Maestrini E, Klauck SM, Hakonarson H, Haines JL, Geschwind DH, Freitag CM, Folstein SE, Ennis S, Coon H, Battaglia A, Szatmari P, Sutcliffe JS, Hallmayer J, Gill M, Cook EH, Buxbaum JD, Devlin B, Gallagher L, Betancur C, Scherer SW. Convergence of genes and cellular pathways dysregulated in autism spectrum disorders. Am J Hum Genet. 2014;94(5):677–694. doi: 10.1016/j.ajhg.2014.03.018. [DOI] [PMC free article] [PubMed] [Google Scholar]
- Polticelli F, Bocedi A, Minervini G, Ascenzi P. Human haptoglobin structure and function–a molecular modelling study. FEBS J. 2008;275(22):5648–5656. doi: 10.1111/j.1742-4658.2008.06690.x. [DOI] [PubMed] [Google Scholar]
- Ringel Y, Drossman DA. Psychosocial aspects of Crohn’s disease. Surg Clin North Am. 2001;81(1):231–252, x. doi: 10.1016/s0039-6109(05)70283-8. [DOI] [PubMed] [Google Scholar]
- Ringel Y, Drossman DA. Irritable bowel syndrome: classification and conceptualization. J Clin Gastroenterol. 2002;35(1 Suppl):S7–10. doi: 10.1097/00004836-200207001-00003. [DOI] [PubMed] [Google Scholar]
- Rose DR, Ashwood P. Immunology of Autism. In: Fatemi SH, editor. The Molecular Basis of Autism. Springer; New York: 2015. pp. 93–115. [Google Scholar]
- Rose S, Bennuri SC, Murray KF, Buie T, Winter H, Frye RE. Mitochondrial dysfunction in the gastrointestinal mucosa of children with autism: A blinded case-control study. PLoS ONE. 2017;12(10):e0186377. doi: 10.1371/journal.pone.0186377. [DOI] [PMC free article] [PubMed] [Google Scholar]
- Rosenfeld CS. Microbiome Disturbances and Autism Spectrum Disorders. Drug Metab Dispos. 2015;43(10):1557–1571. doi: 10.1124/dmd.115.063826. [DOI] [PubMed] [Google Scholar]
- Sadakata T, Furuichi T. Developmentally regulated Ca2+-dependent activator protein for secretion 2 (CAPS2) is involved in BDNF secretion and is associated with autism susceptibility. Cerebellum. 2009;8(3):312–322. doi: 10.1007/s12311-009-0097-5. [DOI] [PubMed] [Google Scholar]
- Sefik E, Geva-Zatorsky N, Oh S, Konnikova L, Zemmour D, McGuire AM, Burzyn D, Ortiz-Lopez A, Lobera M, Yang J, Ghosh S, Earl A, Snapper SB, Jupp R, Kasper D, Mathis D, Benoist C. Individual intestinal symbionts induce a distinct population of RORγ+ regulatory T cells. Science. 2015;349(6251):993–997. doi: 10.1126/science.aaa9420. [DOI] [PMC free article] [PubMed] [Google Scholar]
- Son JS, Zheng LJ, Rowehl LM, Tian X, Zhang Y, Zhu W, Litcher-Kelly L, Gadow KD, Gathungu G, Robertson CE, Ir D, Frank DN, Li E. Comparison of Fecal Microbiota in Children with Autism Spectrum Disorders and Neurotypical Siblings in the Simons Simplex Collection. PLoS One. 2015;10(10):e0137725. doi: 10.1371/journal.pone.0137725. [DOI] [PMC free article] [PubMed] [Google Scholar]
- Song Y, Liu C, Finegold SM. Real-time PCR quantitation of clostridia in feces of autistic children. Appl Environ Microbiol. 2004;70(11):6459–6465. doi: 10.1128/AEM.70.11.6459-6465.2004. [DOI] [PMC free article] [PubMed] [Google Scholar]
- Sorbara MT, Philpott DJ. Peptidoglycan: a critical activator of the mammalian immune system during infection and homeostasis. Immunol Rev. 2011;243(1):40–60. doi: 10.1111/j.1600-065X.2011.01047.x. [DOI] [PubMed] [Google Scholar]
- Spees AM, Wangdi T, Lopez CA, Kingsbury DD, Xavier MN, Winter SE, Tsolis RM, Baumler AJ. Streptomycin-induced inflammation enhances Escherichia coli gut colonization through nitrate respiration. MBio. 2013;4(4) doi: 10.1128/mBio.00430-13. [DOI] [PMC free article] [PubMed] [Google Scholar]
- Stevceva L, Moniuszko M, Ferrari MG. Utilizing IL-12, IL-15 and IL-7 as Mucosal Vaccine Adjuvants. Lett Drug Des Discov. 2006;3(8):586–592. doi: 10.2174/157018006778194655. [DOI] [PMC free article] [PubMed] [Google Scholar]
- Takei N, Nawa H. mTOR signaling and its roles in normal and abnormal brain development. Front Mol Neurosci. 2014;7:28. doi: 10.3389/fnmol.2014.00028. [DOI] [PMC free article] [PubMed] [Google Scholar]
- Tomova A, Husarova V, Lakatosova S, Bakos J, Vlkova B, Babinska K, Ostatnikova D. Gastrointestinal microbiota in children with autism in Slovakia. Physiol Behav. 2015;138:179–187. doi: 10.1016/j.physbeh.2014.10.033. [DOI] [PubMed] [Google Scholar]
- Torrente F, Anthony A, Heuschkel RB, Thomson MA, Ashwood P, Murch SH. Focal-enhanced gastritis in regressive autism with features distinct from Crohn’s and Helicobacter pylori gastritis. Am J Gastroenterol. 2004;99(4):598–605. doi: 10.1111/j.1572-0241.2004.04142.x. [DOI] [PubMed] [Google Scholar]
- Torrente F, Ashwood P, Day R, Machado N, Furlano RI, Anthony A, Davies SE, Wakefield AJ, Thomson MA, Walker-Smith JA, Murch SH. Small intestinal enteropathy with epithelial IgG and complement deposition in children with regressive autism. Mol Psychiatry. 2002;7(4):375–382. 334. doi: 10.1038/sj.mp.4001077. [DOI] [PubMed] [Google Scholar]
- Tripathi A, Lammers KM, Goldblum S, Shea-Donohue T, Netzel-Arnett S, Buzza MS, Antalis TM, Vogel SN, Zhao A, Yang S, Arrietta MC, Meddings JB, Fasano A. Identification of human zonulin, a physiological modulator of tight junctions, as prehaptoglobin-2. Proc Natl Acad Sci U S A. 2009;106(39):16799–16804. doi: 10.1073/pnas.0906773106. [DOI] [PMC free article] [PubMed] [Google Scholar]
- Valicenti-McDermott M, McVicar K, Rapin I, Wershil BK, Cohen H, Shinnar S. Frequency of gastrointestinal symptoms in children with autistic spectrum disorders and association with family history of autoimmune disease. J Dev Behav Pediatr. 2006;27(2 Suppl):S128–136. doi: 10.1097/00004703-200604002-00011. [DOI] [PubMed] [Google Scholar]
- Vijay-Kumar M, Aitken JD, Carvalho FA, Cullender TC, Mwangi S, Srinivasan S, Sitaraman SV, Knight R, Ley RE, Gewirtz AT. Metabolic Syndrome and Altered Gut Microbiota in Mice Lacking Toll-Like Receptor 5. Science. 2010;328(5975):228–231. doi: 10.1126/science.1179721. [DOI] [PMC free article] [PubMed] [Google Scholar]
- Vinolo MAR, Rodrigues HG, Nachbar RT, Curi R. Regulation of Inflammation by Short Chain Fatty Acids. Nutrients. 2011;3(10):858. doi: 10.3390/nu3100858. [DOI] [PMC free article] [PubMed] [Google Scholar]
- Walker-Smith J, Andrews J. Alpha-1-antitrypsin, autism, and coeliac disease. Lancet. 1972;2(7782):883–884. doi: 10.1016/s0140-6736(72)92258-1. [DOI] [PubMed] [Google Scholar]
- Walker LS, C-D A, Rasquin-Weber A. Rome III: The Functional Gastrointestinal Disorders. McLean, Virginia: Degnon Associates, Inc; 2006. Questionnaire on pediatric gastrointestinal symptoms, Rome III version QPGS-RIII. [Google Scholar]
- Wang L, Christophersen CT, Sorich MJ, Gerber JP, Angley MT, Conlon MA. Increased abundance of Sutterella spp. and Ruminococcus torques in feces of children with autism spectrum disorder. Mol Autism. 2013;4(1):42. doi: 10.1186/2040-2392-4-42. [DOI] [PMC free article] [PubMed] [Google Scholar]
- Wang L, Conlon MA, Christophersen CT, Sorich MJ, Angley MT. Gastrointestinal microbiota and metabolite biomarkers in children with autism spectrum disorders. Biomark Med. 2014;8(3):331–344. doi: 10.2217/bmm.14.12. [DOI] [PubMed] [Google Scholar]
- Wang Q, Garrity GM, Tiedje JM, Cole JR. Naive Bayesian classifier for rapid assignment of rRNA sequences into the new bacterial taxonomy. Appl Environ Microbiol. 2007;73(16):5261–5267. doi: 10.1128/AEM.00062-07. [DOI] [PMC free article] [PubMed] [Google Scholar]
- Williams BL, Hornig M, Buie T, Bauman ML, Cho Paik M, Wick I, Bennett A, Jabado O, Hirschberg DL, Lipkin WI. Impaired Carbohydrate Digestion and Transport and Mucosal Dysbiosis in the Intestines of Children with Autism and Gastrointestinal Disturbances. PLoS ONE. 2011;6(9):e24585. doi: 10.1371/journal.pone.0024585. [DOI] [PMC free article] [PubMed] [Google Scholar]
- Wingate MS. Prevalence of autism spectrum disorder among children aged 8 years - autism and developmental disabilities monitoring network, 11 sites, United States, 2010. MMWR Surveill Summ. 2014;63(2):1–21. [PubMed] [Google Scholar]
- Winter SE, Winter MG, Xavier MN, Thiennimitr P, Poon V, Keestra AM, Laughlin RC, Gomez G, Wu J, Lawhon SD, Popova IE, Parikh SJ, Adams LG, Tsolis RM, Stewart VJ, Bäumler AJ. Host-Derived Nitrate Boosts Growth of E. coli in the Inflamed Gut. Science. 2013;339(6120):708–711. doi: 10.1126/science.1232467. [DOI] [PMC free article] [PubMed] [Google Scholar]
- Xue M, Brimacombe M, Chaaban J, Zimmerman-Bier B, Wagner GC. Autism spectrum disorders: concurrent clinical disorders. J Child Neurol. 2008;23(1):6–13. doi: 10.1177/0883073807307102. [DOI] [PubMed] [Google Scholar]
- Zhou X, Bailey-Bucktrout SL, Jeker LT, Penaranda C, Martinez-Llordella M, Ashby M, Nakayama M, Rosenthal W, Bluestone JA. Instability of the transcription factor Foxp3 leads to the generation of pathogenic memory T cells in vivo. Nat Immunol. 2009;10(9):1000–1007. doi: 10.1038/ni.1774. [DOI] [PMC free article] [PubMed] [Google Scholar]
Associated Data
This section collects any data citations, data availability statements, or supplementary materials included in this article.
Supplementary Materials
Supplemental Table 1: Distribution of Hp genotypes in ASD and TD children. (% shown in parentheses)
Supplemental Figure 1: Flow chart depicting GI Survey questions asked to all study participates. Questions were prompted and recorded by trained staff. Participants were asked to answer with yes, no or I don’t know for all questions with the exception of those which asked for a specific date. The survey began with the constipation section, followed by the diarrhea section and then IBS. Participates answered questions for all sections even if they had already met the criteria for an earlier section. Only one participant met the criteria for more than one category, an individual with ASD qualified for both constipation and Diarrhea. Participants must have been experiencing symptoms for at least 6 months in order to meet criteria for specific category.
Supplemental Figure 2: Heat map depicting differences between typically developing children without GI symptoms (TDNOGI) and typically developed with GI symptoms (TDGI). Red indicates a significant (p < 0.05) increase in cytokine production in the TDGI group compared to TDNOGI; blue indicates a significant (p < 0.05) decrease in cytokine production in the TDGI group compared to TDNOGI. Data presented as medians.
Supplemental Figure 3: Gap statistic analysis was used to estimate the correct number of cluster in the set of 16s data.
Supplemental Figure 4: Cohen-Friendly association plot representing pathways representations in different groups of subjects. The height of each rectangle is proportional to the normalized differences of the observed and expected counts, denoting the extent of deviation from the baseline and the width is proportional to the square root of expected counts. The black rectangle indicate that the observed frequency is higher than expected, therefore suggesting an enrichment in the category, while red rectangles denote depletion in that category.