

Abstract
The purpose of this study was to evaluate the effects of butyrate infusion on rumen epithelial transcriptome. Next-generation sequencing (NGS) and bioinformatics are used to accelerate our understanding of regulation in rumen epithelial transcriptome of cattle in the dry period induced by butyrate infusion at the level of the whole transcriptome. Butyrate, as an essential element of nutrients, is a histone deacetylase (HDAC) inhibitor that can alter histone acetylation and methylation, and plays a prominent role in regulating genomic activities influencing rumen nutrition utilization and function. Ruminal infusion of butyrate was following 0-hour sampling (baseline controls) and continued for 168 hours at a rate of 5.0 L/day of a 2.5 M solution as a continuous infusion. Following the 168-hour infusion, the infusion was stopped, and cows were maintained on the basal lactation ration for an additional 168 hours for sampling. Rumen epithelial samples were serially collected via biopsy through rumen fistulae at 0-, 24-, 72-, and 168-hour (D1, D3, D7) and 168-hour post-infusion (D14). In comparison with pre-infusion at 0 hours, a total of 3513 genes were identified to be impacted in the rumen epithelium by butyrate infusion at least once at different sampling time points at a stringent cutoff of false discovery rate (FDR) < 0.01. The maximal effect of butyrate was observed at day 7. Among these impacted genes, 117 genes were responsive consistently from day 1 to day 14, and another 42 genes were lasting through day 7. Temporal effects induced by butyrate infusion indicate that the transcriptomic alterations are very dynamic. Gene ontology (GO) enrichment analysis revealed that in the early stage of rumen butyrate infusion (on day 1 and day 3 of butyrate infusion), the transcriptomic effects in the rumen epithelium were involved with mitotic cell cycle process, cell cycle process, and regulation of cell cycle. Bioinformatic analysis of cellular functions, canonical pathways, and upstream regulator of impacted genes underlie the potential mechanisms of butyrate-induced gene expression regulation in rumen epithelium. The introduction of transcriptomic and bioinformatic technologies to study nutrigenomics in the farm animal presented a new prospect to study multiple levels of biological information to better apprehend the whole animal response to nutrition, physiological state, and their interactions. The nutrigenomics approach may eventually lead to more precise management of utilization of feed resources in a more effective approach.
Keywords: Butyrate, Dairy Cattle, epithelium, rumen, transcriptome
Introduction
Ruminants are the important livestock species providing milk and meat from consumption of highly fibrous feedstuffs. Cattle, goat, and sheep have been widely used for years as models to study ruminal fermentation and the mechanisms whereby tissues use nutrients for milk synthesis, growth, and reproduction.1 For the dairy cow, feeding in the dry period strongly influences the metabolic process, feed intake after calving, fertility, as well as milk production and composition. The transition from late gestation to early lactation also represents a challenge for high-yielding dairy cows. Significant metabolic, physiological, and nutritional changes occur at parturition and the onset of lactation.2,3 Therefore, feeding management during dry period is critical to a cow’s performance and health in the next lactation. The rumen is vital to milk production and cow health. The rumen epithelium is responsible for several physiologically relevant functions, including absorption, transport, short-chain fatty acids (SCFAs) metabolism, and protection.4 Thus, the rumen plays a central role in dictating the net efficiency of feed conversion, and understanding the regulation of its functional activity such as transcriptome is essential for creating effective nutritional management strategies.
The SCFAs (acetate, propionate, and butyrate, also known as volatile fatty acids [VFAs]) are produced in the gastrointestinal tract by microbial fermentation and then are directly absorbed at the site of production. Short-chain fatty acids contribute up to 70% of the energy requirements of ruminants.5 Although acetate and propionate hold a prominent position in providing energy to ruminant metabolism, butyrate, which is present in relatively low concentrations, seems to be involved in metabolism beyond its role as a nutrient. Our previous research showed that butyrate, formed in the rumen during the microbial fermentation of dietary fiber, can regulate DNA histone modification6-8 and regulate gene networks controlling cellular pathways like cell signaling, proliferation, and apoptosis.9 Butyrate is a histone deacetylase (HDAC) inhibitor that can alter histone acetylation and methylation,10 and therefore likely plays a prominent role in regulating genomic activities influencing rumen nutrition utilization and function.
As the functional part of the genome, the transcriptome is known to have distinct profiles unique to cell type, developmental stages, and health status.11 RNA sequencing (RNA-seq) has been widely used as a highly reliable tool for unbiased analysis of transcriptome changes within cells and tissues.12 Using gene co-expression network analysis, RNA-seq can help detect complex transcriptional interaction and regulation. Short-chain fatty acids, as the essential elements of nutrients, also interact with the genome functions and have a significant impact on the transcriptome profiles.13 The advent of high-throughput technologies to study genome, proteome, and nutrigenomic in animals presents the opportunities to study multiple levels of biological information to better understand the whole animal response to nutrition, environment, physiological state, and their interactions.1 In a previous study, the temporal effect of elevated butyrate concentrations on the transcriptome of rumen epithelium of lactation cattle was evaluated via infusion of butyrate and serial biopsy sampling.14 In contrary to lactation cow, the dry period is considered the cow’s resting period and is commonly set 6 to 8 weeks before calving.15 Proper management and nutrition of the dry cow are critical for obtaining maximum dry matter intake, good health, increased reproduction efficiency, and optimum milk production in the following lactation. In this report, Next-generation sequencing (NGS) technique was used to profile the transcriptome of rumen epithelium of cattle in the dry period and the temporal impact of butyrate infusion at the level of the whole transcriptome.
Materials and Methods
Animal experiment
Eight ruminally cannulated Holstein cows in the dry period used in this study were previously defined.16 All cows were at the midpoint in the dry period. All sampling was completed at least 3 weeks prior to expected calving. All animal procedures were conducted under the approval of the Beltsville Area Institutional Animal Care and Use Committee and the University of Maryland Animal Care and Use Committee. Cows were moved to a tie stall barn for adaptation and acclimation at least 5 days before the infusion experiment. Rumen epithelial samples were collected before butyrate infusion (0 hours), which served as the baseline controls. Ruminal infusion of butyrate was immediately following 0-hour sampling (baseline controls) and thereafter continued for 168 hours at a rate of 5.0 L/day of a 2.5-M solution (representing 10% of daily anticipated metabolizable energy intake to support lactation) in a buffered saliva solution (pH 7.0; 3.8% KHCO3, 7.3% NaHCO3) as a continuous infusion. Following the 168-h infusion, the infusion was stopped, and cows were maintained on the basal lactation ration for an additional 168 hours for sampling. Rumen epithelial samples were serially collected via biopsy through rumen fistulae at 0, 24, 72, 168, and 336 hours of infusion, and 24- and 168-hour post-infusion (post 24 and 168 hours, respectively). Rumen biopsies were taken from the field of papillae at the base of the pillar separating the reticulorumen junction below the surface of the rumen liquor. Papillae were pinched, by hand, and placed into copious amounts of physiological saline to rinse away adherent feed particles. Individual papillae were picked up by forceps and rinsed further, blotted dry before being placed into the RNAlater, and stored in −80°C immediately until RNA extraction.
RNA extraction and RNA-seq
RNA extraction procedure was reported previously.17 Total RNA from 40 rumen epithelial samples was extracted using Trizol (Invitrogen, Carlsbad, CA, USA) followed by DNase digestion and Qiagen RNeasy column purification (Qiagen, Valencia, CA, USA) as previously described.17 Agilent Bioanalyzer 2100 (Agilent, Palo Alto, CA, USA) was used to verify the RNA integrity. High-quality RNA (RNA integrity number [RIN]: 9.0) was processed using an Illumina TruSeq RNA sample prep kit following the manufacturer’s instruction (Illumina, San Diego, CA, USA). After quality control procedures, individual RNA-seq libraries were pooled based on their respective sample-specific 6-bp (base pairs) adaptors and sequenced at 50 bp/sequence read using an Illumina HiSeq 2000 sequencer (Illumina, Inc. San Diego, CA) as described previously.18
Bioinformatics and data analysis
The CLC Genomics Workbench (v10; Qiagen) was used for RNA-seq data analysis. Raw sequence reads were first checked using a quality control pipeline. Nucleotides of each raw read were scanned for low quality and trimmed. Trimmed reads were aligned to the bovine reference genome (BosTau_UMD3.1). Gene expression levels of mapped reads were normalized as reads per kilobase of exon model per million mapped reads (RPKM) using the CLC transcriptomic analysis tool. Differentially expressed genes in the transcriptome were further analyzed using a gene ontology (GO) enrichment analysis module in the CLC Genomics Workbench. Enrichment of certain GO terms was determined based on the Fisher exact test. A multiple correction control (permutation to control false discovery rate) was implemented to set up the threshold to obtain the lists of significantly over-represented GO terms.
The molecular processes, molecular functions, and genetic networks were further evaluated by analyzing differentially expressed genes using Ingenuity Pathways Analysis (IPA; Qiagen). Ingenuity Pathways Analysis is a software application that enables biologists to identify the biological mechanisms, pathways, and functions most relevant to their experimental data sets or genes of interest. As integrated analysis software, the differentially expressed genes identified by CLC Genomics Workbench were directly uploaded into the IPA software from CLC Genomics Workbench. The “core analysis” function included in the IPA software was used to interpret the differentially expressed data, which included biological processes, canonical pathways, upstream transcriptional regulators, and gene networks.
Canonical pathway analysis of data sets
Analysis of canonical pathways identified the pathways from the IPA library of canonical pathways that were most significant to the data set. Genes from the data set that were associated with a canonical pathway in the Ingenuity Pathways Knowledge Base were considered for the analysis. The significance of the association between the data set and the canonical pathway was measured in 2 ways: one was to use a ratio of the number of genes from the data set that map to the pathway divided by the total number of genes that map to the canonical pathway was displayed; the other was to use the Fisher exact test to calculate a P value that determines the probability that the association between the genes in the data set and the canonical pathway was explained by chance alone.
Pathway analysis and network generation
The data set containing gene identifiers and corresponding expression values was uploaded into the IPA application. Each gene identifier was mapped to its corresponding gene object in the Ingenuity Pathways Knowledge Base. These genes, called focus genes, were overlaid onto a global molecular network developed from information contained in the Ingenuity Pathways Knowledge Base. Networks of these focus genes were then algorithmically generated based on their connectivity.
Results
From RNA-seq reads of 40 rumen epithelial samples (8 animals with 5 sampling time points on day 0, day 1, day 3, day 7, and day 14), a total of 18 337 genes were detected from at least one of the sample RNA-seq. There were 6259 genes with no expression (out of total of 24 596 genes annotated). In comparison with pre-infusion at 0 hours, a total of 3513 genes were identified to be impacted in the rumen epithelium by butyrate infusion at least once at different sampling time points at a stringent cutoff of FDR < 0.01. The maximal effect of butyrate was observed at day 7 (Figure 1 and Table 1). Among these impacted genes, 117 genes were responsive consistently from day 1 to day 14, and another 42 genes were lasting through day 7. Therefore, most of the impacted genes are only presented at 1 or 2 sampling points, indicating that temporal changes of rumen epithelial transcriptome were very dynamic induced by butyrate infusion. This indicated that other factors such as physical environments changed over time may also be part of reason for the dynamic of gene expression. The overlapping and specific responding genes at different sampling time points were illustrated in a Venn diagram (Figure 2A). While compared with the gene expression on the first day (D1) of infusion, there were 147 genes overlapped consistently from D3 to D7 and D14, 44 genes were responsive from D3 to D7 (Figure 2B) of butyrate infusion.
Figure 1.
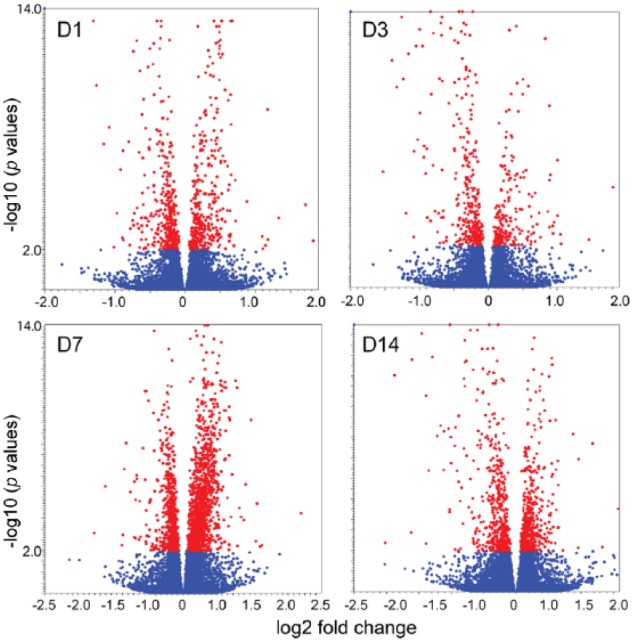
Volcano plots: the differentially expressed genes at different sampling time points after butyrate infusion (red dots indicate differentially expressed genes at cutoff of FDR < 0.01).
Table 1.
Number of genes impacted by butyrate infusion in rumen epithelium.
| Time Point | Total genes impacted | Upregulated gene | Downregulated gene |
|---|---|---|---|
| D1 | 931 | 480 | 451 |
| D3 | 629 | 235 | 394 |
| D7 | 2186 | 1434 | 752 |
| D14 | 1127 | 555 | 572 |
In comparison with pre-infusion at 0 hours, genes were identified to be impacted in the rumen epithelium by butyrate infusion at a stringent cutoff of FDR < 0.01.
Figure 2.

Venn diagram of genes impacted by butyrate infusion at different sampling time points. All 4 sampling time points: (A) day 1, day 4, day 7, and day 14 compared against day 0 and (B) day 4, day 7, and day 14 compared against day 1.
GO enrichment analysis of genes impacted by butyrate infusion
Gene ontology enrichment analysis was performed to further investigating the potential functions of the differentially expressed genes induced by butyrate infusion. The changes of GO terms from enrichment analysis also reflect the dynamics of the impacts of butyrate infusion on rumen epithelial transcriptome. The top 5 GO terms in biological process enriched in differentially expressed genes from each sampling time points (D1, D3, D7, and D14) were listed in Table 2. Mitotic cell cycle process, cell cycle process, and regulation of cell cycle were the most significantly enriched GO terms in the biological process on day 1 (24 hours) after butyrate infusion. On day 3 (72 hours after butyrate infusion) of butyrate infusion, however, the most significantly enriched GO terms in the biological process were negative regulation of biological process, negative regulation of cellular process, and regulation of cell death. The top 5 GO terms enriched for the differentially expressed genes at each sampling time points (D1, D3, D7, and D14) were listed in Table 2. All the genes presented in each GO from the data sets are also listed in Supplement Table 1. In addition to biological process, GO terms in molecular activities were also analyzed. Interestingly, most GO terms in molecular activity in the 40 samples were related to RNA transcription activities such as RNA polymerase II core promoter proximal region sequence-specific DNA binding (Table 3 and Supplement Table 2).
Table 2.
Top 5 of the GO terms in biological process significantly impacted temporally by butyrate infusion.
| GO term | Description | Ratio | P values | FDR P value | Bonferroni |
|---|---|---|---|---|---|
| Day 1 | |||||
| 1903047 | Mitotic cell cycle process | 113/29 | 6.99E–13 | 5.78E–09 | 5.78E–09 |
| 22402 | Cell cycle process | 169/33 | 5.82E–11 | 2.41E–07 | 4.82E–07 |
| 51726 | Regulation of cell cycle | 163/29 | 8.78E–09 | 2.42E–05 | 7.26E–05 |
| 7059 | Chromosome segregation | 26/10 | 4.77E–07 | 9.86E–04 | 3.94E–03 |
| 7017 | Microtubule-based process | 141/23 | 1.61E–06 | 2.67E–03 | 0.01 |
| Day 3 | |||||
| 48519 | Negative regulation of biological process | 882/59 | 5.11E–07 | 2.13E–03 | 4.23E–03 |
| 48523 | Negative regulation of cellular process | 839/57 | 5.14E–07 | 2.13E–03 | 4.26E–03 |
| 10941 | Regulation of cell death | 341/30 | 3.31E–06 | 9.13E–03 | 0.03 |
| 42325 | Regulation of phosphorylation | 263/25 | 6.12E–06 | 0.01 | 0.05 |
| 8285 | Negative regulation of cell proliferation | 63/11 | 1.16E–05 | 0.02 | 0.1 |
| Day 7 | |||||
| 6412 | Translation | 131/55 | 0 | 0 | 0 |
| 43043 | Peptide biosynthetic process | 134/55 | 4.44E–16 | 1.84E–12 | 3.67E–12 |
| 6518 | Peptide metabolic process | 184/64 | 5.31E–14 | 1.46E–10 | 4.39E–10 |
| 43604 | Amide biosynthetic process | 151/56 | 9.90E–14 | 2.05E–10 | 8.19E–10 |
| 43603 | Cellular amide metabolic process | 220/68 | 5.20E–12 | 8.60E–09 | 4.30E–08 |
| Day 14 | |||||
| 51726 | Regulation of cell cycle | 162/23 | 8.63E–05 | 0.65 | 0.71 |
| 50678 | Regulation of epithelial cell proliferation | 35/9 | 1.60E–04 | 0.65 | 1 |
| 43604 | Amide biosynthetic process | 151/21 | 2.35E–04 | 0.65 | 1 |
| 42127 | Regulation of cell proliferation | 235/28 | 3.37E–04 | 0.7 | 1 |
| 48660 | Regulation of smooth muscle cell proliferation | 4/8 | 7.38E–04 | 0.74 | 1 |
GO, gene ontology.
All the time points (day) are compared against day 0 (baseline control); Ratio = the number of all genes assigned to this GO term to the number of significantly regulated genes in the data set that can be assigned to this GO term.
Table 3.
GO terms in molecular functions significantly impacted temporally by butyrate infusion.
| GO term | Description | Ratio | P values | FDR P value | Bonferroni |
|---|---|---|---|---|---|
| Day 1 | |||||
| 978 | RNA polymerase II core promoter proximal region sequence-specific DNA binding | 36/5 | 3.28E–07 | 5.23E–04 | 8.36E–04 |
| 987 | Core promoter proximal region sequence-specific DNA binding | 42/5 | 7.28E–07 | 5.23E–04 | 1.85E–03 |
| 1159 | Core promoter proximal region DNA binding | 42/5 | 7.28E–07 | 5.23E–04 | 1.85E–03 |
| 982 | RNA polymerase II core promoter proximal region sequence-specific DNA-binding transcription factor activity | 43/5 | 8.21E–07 | 5.23E–04 | 2.09E–03 |
| 5154 | Epidermal growth factor receptor binding | 2 1/3 | 2.45E–06 | 1.25E–03 | 6.23E–03 |
| Day 3 | |||||
| 978 | RNA polymerase II core promoter proximal region sequence-specific DNA binding | 36/5 | 4.42E–08 | 6.30E–05 | 1.13E–04 |
| 982 | RNA polymerase II core promoter proximal region sequence-specific DNA-binding transcription factor activity | 42/5 | 9.87E–08 | 6.30E–05 | 2.52E–04 |
| 987 | Core promoter proximal region sequence-specific DNA binding | 42/5 | 9.87E–08 | 6.30E–05 | 2.52E–04 |
| 1159 | Core promoter proximal region DNA binding | 42/5 | 9.87E–08 | 6.30E–05 | 2.52E–04 |
| 977 | RNA polymerase II regulatory region sequence-specific DNA binding | 98/5 | 7.15E–06 | 3.04E–03 | 0.02 |
| Day 7 | |||||
| 3735 | Structural constituent of ribosome | 127/57 | 6.66E–16 | 1.69E–12 | 1.69E–12 |
| 5198 | Structural molecule activity | 180/67 | 1.67E–15 | 2.12E–12 | 4.23E–12 |
| 3723 | RNA binding | 950/184 | 6.20E–08 | 5.26E–05 | 1.58E–04 |
| 44822 | No description available | 840/163 | 4.14E–07 | 2.63E–04 | 1.05E–03 |
| 16491 | Oxidoreductase activity | 270/62 | 1.80E–05 | 9.17E–03 | 0.05 |
| Day 14 | |||||
| 978 | RNA polymerase II core promoter proximal region sequence-specific DNA binding | 35/6 | 6.26E–10 | 1.45E–06 | 1.59E–06 |
| 987 | Core promoter proximal region sequence-specific DNA binding | 41/6 | 1.72E–09 | 1.45E–06 | 4.36E–06 |
| 1159 | Core promoter proximal region DNA binding | 41/6 | 1.72E–09 | 1.45E–06 | 4.36E–06 |
| 982 | RNA polymerase II core promoter proximal region sequence-specific DNA-binding transcription factor activity | 42/5 | 1.42E–07 | 9.02E–05 | 3.61E–04 |
| 977 | RNA polymerase II regulatory region sequence-specific DNA binding | 99/6 | 3.85E–07 | 1.63E–04 | 9.79E–04 |
GO, gene ontology.
All the time points (day) are compared against day 0 (baseline control); 2. Ratio = the number of all genes assigned to this GO term to the number of significantly regulated genes that can be assigned to this GO term.
IPA annotated the biological function of impacted genes
Ingenuity Pathways Analysis was used to investigate further the biological functions affected by the butyrate infusion. Comparison analysis using IPA was performed to illuminate the dynamics and the tendency of the top functions impacted by butyrate infusion during 14 days. The top 10 affected functions in differentially expressed genes at each sampling time point are presented in Figure 3A. The results were consistent with the GO enrichment analysis. The predominant functions impacted during the whole experimental course were cell death and survival, cellular development, cellular growth, proliferation, and cell cycle progress. However, it is notable that at the sampling time points of D7 and D14, protein synthesis was among the top 5 functions impacted by butyrate infusion. As presented in Figure 3B, although activation z scores of gene expression and protein synthesis were up on day 7, activation z scores for most of the top 10 cellular functions, such as cellular movement, cellular development, cell cycle, and cell morphology, come down to the lowest level on day 7.
Figure 3.
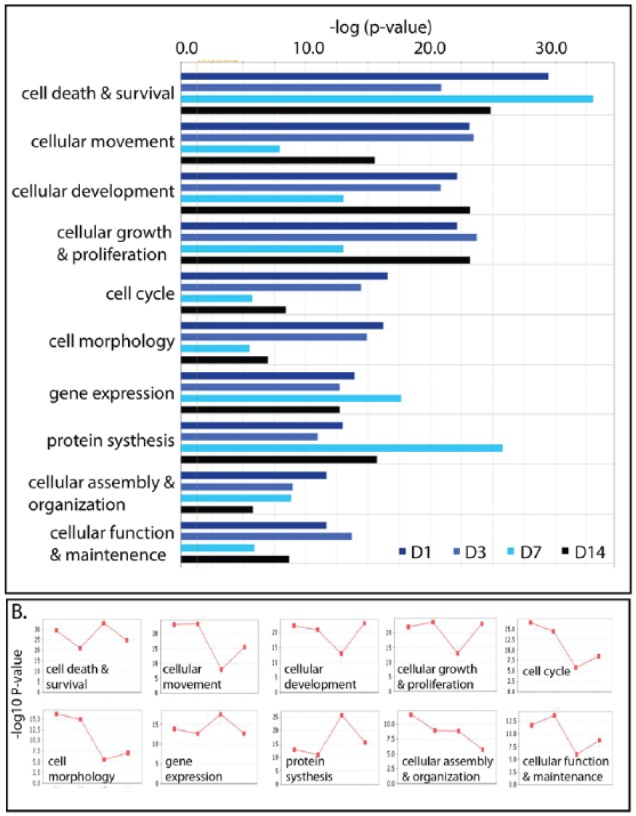
Comparison of top 10 functions impacted by butyrate infusion with bar chart (A) and line chart (B). In line chart, 4 dots represent sampling time points of day 1, day 3, day 7, and day 14 (from left to right).
Ingenuity Pathways Analysis unveiled potential upstream regulators of gene expression in response to butyrate infusion. In response to butyrate infusion, upstream regulators may play a critical role in the regulation of gene expression. An IPA upstream regulator analysis identified many upstream regulators which were involved in transcriptomics response induced by butyrate infusion in rumen epithelium. TP53, 1 of the top 5 upstream regulators, consistently presented in all the sampling time points. The top 5 upstream regulators at different sampling time points are listed in Table 4. Those upstream regulators are correlated or overlapped in playing regulatory roles in cellular functions as illustrated in Figure 4A. Upstream regulators platelet-derived growth factor-BB (PDGF-BB), tumor necrosis factor (TNF), and interleukin 1 beta (IL1b) are overlapped in downregulating EGR1, BTG2, FOS, JUN, ATF3, CYR61, and HBEGF genes. As a result, the DNA binding and DNA synthesis are downregulated.
Table 4.
Top 5 upstream regulators in response to butyrate infusion in rumen epithelium.
| D1 |
D3 |
D7 |
D14 |
||||
|---|---|---|---|---|---|---|---|
| Upstream regulator | P value of overlap | Upstream regulator | P value of overlap | Upstream regulator | P value of overlap | Upstream regulator | P value of overlap |
| TP53 | 1.09E–30 | TP53 | 1.16E–34 | RICTOR | 9.54E–50 | PDGF-BB | 1.59E–23 |
| PDGF-BB | 2.75E–26 | PDGF-BB | 1.25E–29 | TP53 | 2.86E–20 | TNF | 1.42E–17 |
| MYC | 2.23E–19 | TNF | 1.70E–26 | NFE2L2 | 1.62E–16 | KRAS | 7.14E–16 |
| TGFB1 | 5.02E–18 | TGFB1 | 5.99E–18 | TCR | 3.23E–16 | TP53 | 1.47E–14 |
| ERBB2 | 7.81E–17 | INSR | 1.07E–17 | MYC | 2.51E–15 | TCR | 6.16E–14 |
Figure 4.

Upstream regulator effects illustrated by the downregulated TNF, PDGF-BB, and IL1b.
In addition to the upstream regulators, IPA also exposed canonical pathways involved in differentially expressed genes. The results implicated that some essential canonical pathways are involved in differentially expressed genes induced by butyrate infusion. Two very interesting canonical pathways are shown in Figure 5A and B. The heat map is used to visualize the pathway scores (activation z score) and the gene involved in the canonical pathway network. The heat maps can also show gene expression relevant to all 4 sampling time points (D1, D2, D7, and D14) simultaneously. Figure 5A presents the activation z score of eukaryotic initiation factor–2 (EIF2) signaling pathway with genes in EIF2 signaling pathway network. This pathway belongs to the category of cellular growth, proliferation, and development; cellular stress and injury; intracellular and second messenger signaling and its top functions are protein synthesis; gene expression; and cell death and survival. The activation z score indicated that this pathway is at highest activation status on D7 and continued to D14 (7 days post-butyrate infusion) of butyrate infusion at lower activation status. Figure 5B shows PPAR signaling pathway activation z scores during butyrate infusion and the genes in the signaling network. Peroxisome proliferator-activated receptor (PPAR) signaling, a nuclear receptor signaling pathway, acts as ligand-activated transcriptional regulators.
Figure 5.
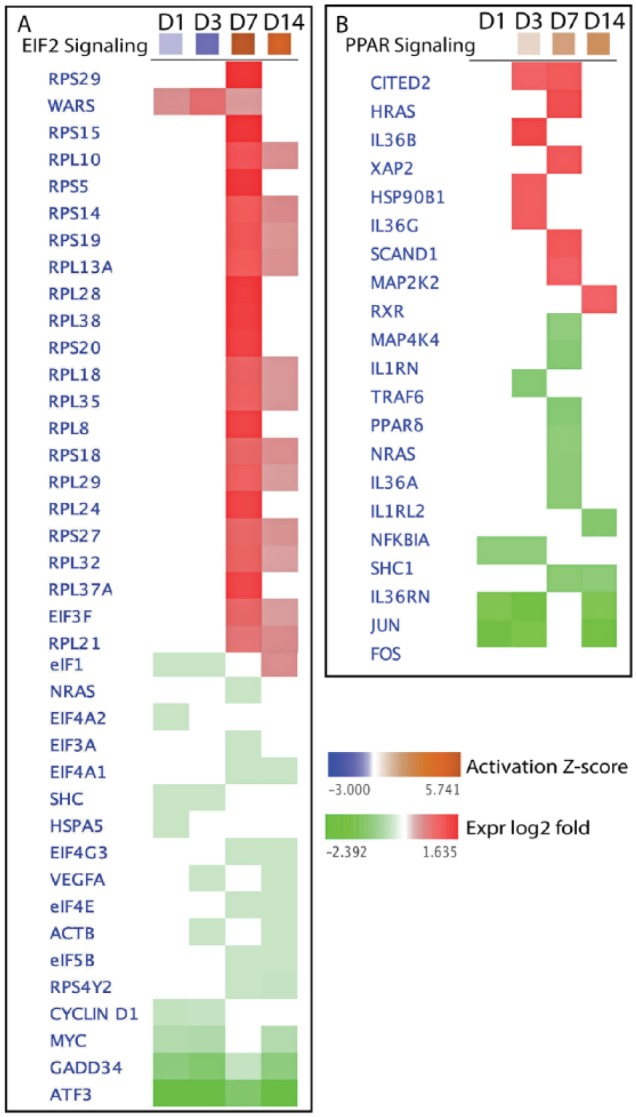
Heat map: effects of butyrate on the canonical pathways of EIL2 and PPAR, and genes in the pathway’s network.
The biological relevant networks of gene expression in response to butyrate infusion
The IPA was also used to define and to compare the biological relevant networks during the butyrate infusion. The top 1 network in each sampling time points is showing in Figure 6. At day 1 of butyrate infusion, the top functional network has associated network functions of the cell cycle. The network also indicates the involvement of histone H3 and histone H4 in the perturbation of the functional gene network. On day 3, the top functional network has a major function involvement in DNA replication, recombination, repair, and cellular development. On day 7, the top network is centered by TP53, which has extensive biological function and also functions as a transcription factor. These changes in the functions of the top network may reflect the temporal transcriptomics responses of rumen epithelium to the butyrate infusion. The top functional network on day 14 of butyrate infusion is associated with the biological function of amino acid metabolism, small molecular biochemistry, and cellular development.
Figure 6.

The most impacted functional regulation networks at different sampling time points.
Discussion
The primary roles of the gastrointestinal epithelium (GE) are to protect the host from the mixture of microorganisms, toxins, and chemicals in the lumen and to prevent uncontrolled movement of those compounds into the lymphatic or portal circulation.18,19 Along with protecting the host, the GE controls nutrient absorption, metabolism, and delivery of nutrients to the body.20 The rumen has been the focal point of the dairy cow and calf nutritional physiology research recently. Most of the research was concentrated to the modulation of ruminal function in response to increasing rapidly fermentable carbohydrates.21–23
Short-chain fatty acids (acetate, propionate, and butyrate) are formed during the microbial fermentation of the dietary fiber in the gastrointestinal tract of mammalian species and are directly absorbed at the site of production.24 Short-chain fatty acids are nutrients especially critical to the ruminant. Ruminant species have developed to metabolize the SCFAs (acetate, propionate, and butyrate) to fulfill up to 70% of their nutrient energy requirements. Therefore, ruminants are dependent on low-molecular-weight SCFAs like acetate, propionate, and butyrate for metabolic needs.5 Although acetate and propionate are the major components of SCFAs and maintain a prominent position in providing energy to the ruminant metabolism, butyrate, with relatively lower concentrations, has the most potent among SCFAs in the induction of changes in cellular functions. Roles for butyrate have been established in cell differentiation, proliferation, motility, and, in particular, the induction of cell cycle arrest and apoptosis.6,25–27
Study of the ruminal epithelium with butyrate supplementation has been reported recently.14,28,29 However, the mechanisms controlling GE responses during dietary adaptation are poorly understood.20,22,30 The dry period is considered the cow’s resting period and is commonly set 6 to 8 weeks before calving.15 Proper management and nutrition of the dry cow are critical for obtaining maximum dry matter intake, good health, increased reproduction efficiency, and optimum milk production in the following lactation. In this report, 8 ruminally cannulated Holstein cows in dry period were supplemented with butyrate infusion. The normal procedure to dry off a cow is to withdraw all grains and reduce the water supply several days before the start of the dry period. This drastically reduces the milk production during that time. As cows in dry period require much less highly fermentable diet such as grain, and therefore the rate of SCFA production by ruminal fermentation comes to a lower level, the adaptation of the rumen epithelium to supplementation of butyrate will be significant and correlate to the transcriptomics profiles. Combining with temporal transcriptomics profiling of rumen epithelium and bioinformatic analysis, we systematically examined temporal responses of rumen epithelium at the level of the whole transcriptome. As expected, transcriptomic and bioinformatic analysis generated a holistic overview of molecular changes to dietary interventions, namely, butyrate infusion.
Comparison of temporal effects induced by butyrate infusion indicates that the transcriptomic alterations are very dynamic. Among 3513 genes identified to be impacted in the rumen epithelium by butyrate infusion, 117 genes were responsive consistently from day 1 to day 14, and another 42 genes were lasting through day 7. It is also noteworthy that in the early stage of rumen butyrate infusion (on day 1 and day 3 of butyrate infusion), the transcriptomics effects in the rumen epithelium were involved with mitotic cell cycle process, cell cycle process, and regulation of cell cycle. The results seem very consistent with our previous in vitro study.6,7,31 On day 7 of butyrate infusion, however, translation, peptide biosynthetic process, peptide metabolic process, and cellular amide metabolic process emerged as the top GO biological processes stimulated by butyrate infusion. The temporal shift of the GO biological processes and molecular functions reflects the transition of the alterations in the transcriptomics responses to the butyrate. The results also designate that implementing high-throughput transcriptomics data can interrelate with GE function measurement. Our results may also explain the observation in both the dorsal and ventral sac of the rumen, dietary Na-butyrate increased rumen muscle layer thickness, and suggest that Na-butyrate supplementation in the close-up diet may have a potential to enhance rumen papillae growth and rumen adaptation to postpartum diet.29 On day 14, when butyrate infusion was stopped for 7 days, the number of genes impacted, both up- and downregulated, by the butyrate infusion was decreased remarkably. Notably, those GO biological terms at D14 were also not significantly impacted compared with D0 with multiple testing corrections (Table 2), whereas some GO terms in molecular functions are still significantly impacted (Table 3). As D14 was the 7 days post-butyrate infusion, therefore, it is reasonable to assume that the special effects of butyrate were diminishing. Lacking synchronousness between GO term in biological processing and GO term in molecular functions may be due to different criteria in the IPA. As biological processes are made up of many chemical or molecular functions—although diminishing effects of butyrate are still showing impact at some molecular functions on 7 days post-butyrate infusion—it is not strong enough to induce significant impact on biological processing. These results of diminishing effects on day 7 post-butyrate infusion also make a case for the temporal biological effects mostly due to the response of epithelial cells to the butyrate.
Several upstream regulators were revealed by the bioinformatics analysis. TP53 is one of the most active upstream regulators discovered by IPA in our RNA-seq data set, and its involvement in the regulatory activity carries on consistently from day 1 to day 14. TP53 signaling pathway plays a key role in many cellular processes. The tumor suppressor gene TP53 encodes a transcription factor, which is activated in response to several forms of cellular stress and exerts multiple, anti-proliferative functions.32 In addition to the undeniable importance of p53 as a tumor suppressor, an increasing number of new functions for p53 have been reported, including its ability to regulate energy metabolism, to control autophagy, and to participate in various aspects of differentiation and development.33 Very interestingly, TP53 was also one of the most active upstream regulators in our in vitro experiment in which cultured bovine cell line (MDBK, Madin-Darby Bovine Kidney epithelial cell line) was treated with butyrate.9 Butyrate functions as an HDAC inhibitor, and HDACs are active components of transcriptional regulatory complexes. We presume that cross-talking between upstream and downstream regulators such as TP53 and HDACs may set up another layer of the regulation network. Recent data link HDAC2 to the regulation of the TP53 by deacetylation and to the maintenance of genomic stability.34 Ingenuity Pathways Analysis also revealed the biological relevant networks of perturbed genes. The first network on day 1 of butyrate infusion involves in functions of the cell cycle and organismal development. Histone H3 and histone H4 are centered in this network. Butyrate has a potent inhibitive activity to HDACs. Histone deacetylases are a class of enzymes that remove acetyl groups from a lysine amino acid on a histone. Because DNA is wrapped around histones, and gene expression is regulated by acetylation and deacetylation of histone. Therefore, the involvement of histone H3 and histone H4 in this network signified that butyrate might play not only as an element of nutrients but also as a regulator of histone modification and gene expression.
The dynamic canonical pathways are well-characterized metabolic and cell signaling pathways. The pathways (metabolic and signaling pathways) are generated in IPA based on the literature. Two very appealing activated canonical pathways are presented in this report. Eukaryotic initiation factor–2 signaling pathway functions in protein synthesis, gene expression, and cell death and survival. Eukaryotic initiation factor–2 is a guanosine triphosphate (GTP)-binding protein that escorts the initiation-specific form of mRNA onto the ribosome. Important functions of EIF2 include delivery of charged initiator methionyl-tRNA to the ribosome as well as a role in identifying the translational start site. Peroxisome proliferator–activated receptors are among the currently known ligand-dependent nuclear receptor. The PPAR has received the greatest attention because PPAR consistently responds, at least in vitro, to long-chain fatty acids (LCFAs) in a ligand-dependent manner.1 An RNA-seq study in ovine mammary gland during late pregnancy and lactation revealed the importance of genes related to milk fat synthesis, including the activation of PPAR pathways.35 PPAR plays a potentially critical role in mediating the adaptive transcriptional changes the ovine mammary gland undergoes in support of lactation. PPAR was also identified as an activated transcription factor regulating expression of genes responsive to weaning in calves. Expression of 32 downstream gene targets of PPAR-α changed during the transition from milk replacer to solid feed in developing calf rumen epithelium.36 Observations indicated that increased production of VFA in response to the introduction of solid feed during weaning might promote ketogenesis in rumen epithelial cells via PPAR-mediated activation to promote papillary development, as well as activation of genes promoting fatty acid beta-oxidation to support cellular differentiation.36 Activated PPAR signaling pathway by butyrate infusion certainly is consistent with this conclusion.
In summary, transcriptomics and bioinformatics are used to accelerate our understanding of the multiple levels of regulation in rumen epithelial transcriptome induced by butyrate infusion. Butyrate, as an essential element of nutrients, is an HDAC inhibitor that can alter histone acetylation and methylation,10 and plays a prominent role in regulating genomic activities influencing rumen nutrition utilization and function. Our results underlie the potential mechanisms of butyrate-induced gene expression regulation in rumen epithelium. The advent of transcriptomic and bioinformatic technologies to study an animal’s nutrigenomics presented the opportunity to study multiple levels of biological information to better understand the whole animal response to nutrition, physiological state, and their interactions. The nutrigenomics approach may eventually lead to more precise management of utilization of feed resources in a more effective approach.
Supplementary Material
Acknowledgments
Mention of a product, reagent, or source does not constitute an endorsement by the US Department of Agriculture to the exclusion of other products or services that perform a comparable function. US Department of Agriculture is an equal opportunity provider and employer.
Footnotes
Funding:The author(s) received no financial support for the research, authorship, and/or publication of this article.
Declaration of conflicting interests:The author(s) declared no potential conflicts of interest with respect to the research, authorship, and/or publication of this article.
Author Contributions: RLB and CJL conceived and designed the experiments. RLB, RWL, YJ and CJL collected samples and/or generated NGS data. RWL, YJ and CJL performed computational analyses. RLB and CJL wrote the paper.
References
- 1. Osorio JS, Vailati-Riboni M, Palladino A, Loor JJ. Application of nutrigenomics in small ruminants: lactation, growth, and beyond. Small Rumin Res. 2017;154:29–44. [Google Scholar]
- 2. Goff JP, Horst RL. Physiological changes at parturition and their relationship to metabolic disorders. J Dairy Sci. 1997;80:1260–1268. [DOI] [PubMed] [Google Scholar]
- 3. Duplessis M, Lapierre H, Ouattara B, et al. Whole-body propionate and glucose metabolism of multiparous dairy cows receiving folic acid and vitamin B12 supplements. J Dairy Sci. 2017;100:8578–8589. [DOI] [PubMed] [Google Scholar]
- 4. Gálfi P, Neogrady S, Sakata T. Effects of volatile fatty acids on the epithelial cell proliferation of the digestive tract and its hormonal mediation. In: Tsuda T, ed. Proceedings of the Seventh International Symposium on Ruminant Physiology San Diego, CA: Academic Press; 1991:49–59. [Google Scholar]
- 5. Bergman EN. Energy contributions of volatile fatty acids from the gastrointestinal tract in various species. Physiol Rev. 1990;70:567–590. [DOI] [PubMed] [Google Scholar]
- 6. Li CJ, Elsasser TH. Butyrate-induced apoptosis and cell cycle arrest in bovine kidney epithelial cells: involvement of caspase and proteasome pathways. J Anim Sci. 2005;83:89–97. [DOI] [PubMed] [Google Scholar]
- 7. Li CJ, Li RW, Wang YH, Elsasser TH. Pathway analysis identifies perturbation of genetic networks induced by butyrate in a bovine kidney epithelial cell line. Funct Integr Genomics. 2007;7:193–205. [DOI] [PubMed] [Google Scholar]
- 8. Shin JH, Li RW, Gao Y, Baldwin RL, VI, Li CJ. Genome-wide ChIP-seq mapping and analysis reveal butyrate-induced acetylation of H3K9 and H3K27 correlated with transcription activity in bovine cells. Funct Integr Genomics. 2012;12:119–130. [DOI] [PubMed] [Google Scholar]
- 9. Li CJ, Li RW. Bioinformatic dissecting of TP53 regulation pathway underlying butyrate-induced histone modification in epigenetic regulation. Genet Epigenet. 2014;6:1–7. [DOI] [PMC free article] [PubMed] [Google Scholar]
- 10. Marinova Z, Leng Y, Leeds P, Chuang DM. Histone deacetylase inhibition alters histone methylation associated with heat shock protein 70 promoter modifications in astrocytes and neurons. Neuropharmacology. 2010;60:1109–1115. [DOI] [PMC free article] [PubMed] [Google Scholar]
- 11. Peters MJ, Joehanes R, Pilling LC, et al. The transcriptional landscape of age in human peripheral blood. Nat Commun. 2015;6:8570. [DOI] [PMC free article] [PubMed] [Google Scholar]
- 12. Mortazavi A, Williams BA, McCue K, Schaeffer L, Wold B. Mapping and quantifying mammalian transcriptomes by RNA-Seq. Nat Methods. 2008;5:621–628. [DOI] [PubMed] [Google Scholar]
- 13. Li RW, Li C. Butyrate induces profound changes in gene expression related to multiple signal pathways in bovine kidney epithelial cells. BMC Genomics. 2006;7:234. [DOI] [PMC free article] [PubMed] [Google Scholar]
- 14. Baldwin RL, VI, Wu S, Li W, Li C, Bequette BJ, Li RW. Quantification of transcriptome responses of the rumen epithelium to butyrate infusion using RNA-seq technology. Gene Regul Syst Bio. 2012;6:67–80. [DOI] [PMC free article] [PubMed] [Google Scholar]
- 15. Annen EL, Collier RJ, McGuire MA, Vicini JL, Ballam JM, Lormore MJ. Effect of modified dry period lengths and bovine somatotropin on yield and composition of milk from dairy cows. J Dairy Sci. 2004;87:3746–3761. [DOI] [PubMed] [Google Scholar]
- 16. Li RW, Wu S, Baldwin RL, VI, Li W, Li C. Perturbation dynamics of the rumen microbiota in response to exogenous butyrate. PLoS ONE. 2012;7:e29392. [DOI] [PMC free article] [PubMed] [Google Scholar]
- 17. Li RW, Li C, Elsasser TH, Liu G, Garrett WM, Gasbarre LC. Mucin biosynthesis in the bovine goblet cell induced by Cooperia oncophora infection. Vet Parasitol. 2009;165:281–289. [DOI] [PubMed] [Google Scholar]
- 18. Li RW, Schroeder SG. Cytoskeleton remodeling and alterations in smooth muscle contractility in the bovine jejunum during nematode infection. Funct Integr Genomics. 2012;12:35–44. [DOI] [PubMed] [Google Scholar]
- 19. Gabel G, Aschenbach JR, Muller F. Transfer of energy substrates across the ruminal epithelium: implications and limitations. Anim Health Res Rev. 2002;3:15–30. [DOI] [PubMed] [Google Scholar]
- 20. Steele MA, Penner GB, Chaucheyras-Durand F, Guan LL. Development and physiology of the rumen and the lower gut: targets for improving gut health. J Dairy Sci. 2016;99:4955–4966. [DOI] [PubMed] [Google Scholar]
- 21. Steele MA, Croom J, Kahler M, et al. Bovine rumen epithelium undergoes rapid structural adaptations during grain-induced subacute ruminal acidosis. Am J Physiol Regul Integr Comp Physiol. 2011;300:R1515–R1523. [DOI] [PubMed] [Google Scholar]
- 22. Steele MA, Vandervoort G, AlZahal O, Hook SE, Matthews JC, McBride BW. Rumen epithelial adaptation to high-grain diets involves the coordinated regulation of genes involved in cholesterol homeostasis. Physiol Genomics. 2011;43:308–316. [DOI] [PubMed] [Google Scholar]
- 23. Penner GB, Steele MA, Aschenbach JR, McBride BW. Ruminant Nutrition Symposium: molecular adaptation of ruminal epithelia to highly fermentable diets. J Anim Sci. 2011;89:1108–1119. [DOI] [PubMed] [Google Scholar]
- 24. Bugaut M. Occurrence, absorption and metabolism of short chain fatty acids in the digestive tract of mammals. Comp Biochem Physiol B. 1987;86:439–472. [DOI] [PubMed] [Google Scholar]
- 25. Chen JS, Faller DV, Spanjaard RA. Short-chain fatty acid inhibitors of histone deacetylases: promising anticancer therapeutics? Curr Cancer Drug Targets. 2003;3:219–236. [DOI] [PubMed] [Google Scholar]
- 26. Gassull MA, Cabre E. Nutrition in inflammatory bowel disease. Curr Opin Clin Nutr Metab Care. 2001;4:561–569. [DOI] [PubMed] [Google Scholar]
- 27. Scheppach W, Bartram HP, Richter F. Role of short-chain fatty acids in the prevention of colorectal cancer. Eur J Cancer. 1995;31A:1077–1080. [DOI] [PubMed] [Google Scholar]
- 28. Górka P, Kowalski ZM, Pietrzak P, et al. Effect of method of delivery of sodium butyrate on rumen development in newborn calves. J Dairy Sci. 2011;94:5578–5588. [DOI] [PubMed] [Google Scholar]
- 29. Kowalski ZM, Górka P, Flaga J, et al. Effect of microencapsulated sodium butyrate in the close-up diet on performance of dairy cows in the early lactation period. J Dairy Sci. 2015;98:3284–3291. [DOI] [PubMed] [Google Scholar]
- 30. Steele MA, Schiestel C, AlZahal O, et al. The periparturient period is associated with structural and transcriptomic adaptations of rumen papillae in dairy cattle. J Dairy Sci. 2015;98:2583–2595. [DOI] [PubMed] [Google Scholar]
- 31. Li CJ, Li RW. Butyrate induced cell cycle arrest in bovine cells through targeting gene expression relevant to DNA replication apparatus. Gene Regul Syst Bio. 2008;2:113–123. [DOI] [PMC free article] [PubMed] [Google Scholar]
- 32. Vogelstein B, Lane D, Levine AJ. Surfing the p53 network. Nature. 2000;408:307–310. [DOI] [PubMed] [Google Scholar]
- 33. Paskulin D, Paixão-Côrtes VR, Hainaut P, Bortolini MC, Ashton-Prolla P. The TP53 fertility network. Genet Mol Biol. 2012;35:939–946. [DOI] [PMC free article] [PubMed] [Google Scholar]
- 34. Wagner T, Brand P, Heinzel T, Krämer OH. Histone deacetylase 2 controls p53 and is a critical factor in tumorigenesis. Biochim Biophys Acta. 2014;1846:524–538. [DOI] [PubMed] [Google Scholar]
- 35. Paten AM, Duncan EJ, Pain SJ, et al. Functional development of the adult ovine mammary gland—insights from gene expression profiling. BMC Genomics. 2015;16:748. [DOI] [PMC free article] [PubMed] [Google Scholar]
- 36. Connor EE, Baldwin RL, VI, Li CJ, Li RW, Chung H. Gene expression in bovine rumen epithelium during weaning identifies molecular regulators of rumen development and growth. Funct Integr Genomics. 2013;13:133–142. [DOI] [PubMed] [Google Scholar]
Associated Data
This section collects any data citations, data availability statements, or supplementary materials included in this article.