Abstract
Cold atmospheric plasma (CAP), an ionized gas operated at near-ambient temperatures, has been introduced as a new therapeutic opportunity for treating cancers. The effectiveness of the therapy has been linked to CAP-generated reactive oxygen and nitrogen species such as hydrogen peroxide and nitrite. In this study, we monitor in real-time cancer cell response to CAP over the course of 48 h. The results demonstrate a correlation between cell viability, exposure time (30, 60, 90, and 180 s), and discharge voltage (3.16 and 3.71 kV), while stressing the likely therapeutic role of plasma-generated reactive species. A 30–60 s increase in CAP exposure time and/or a discharge voltage adjustment from 3.16 to 3.71 kV is consistently accompanied by a significant reduction in cell viability. Comparably, levels of hydrogen peroxide and nitrite vary as a function of voltage with elevated levels detected at the highest tested voltage condition of 3.71 kV. CAP ultimately initiates a reduction in cell viability and triggers apoptosis via damage to the mitochondrial membrane, while also deregulating protein synthesis. The findings presented in this study are discussed in the context of facilitating the development of an adaptive CAP platform which could improve treatment outcomes.
Keywords: nonthermal atmospheric plasma, reactive oxygen species, reactive nitrogen species, discharge voltage, treatment duration, apoptosis, mitochondrial membrane potential, protein synthesis
Graphical Abstract
1. INTRODUCTION
Nonthermal atmospheric plasma, also referred to as cold atmospheric plasma (CAP), has emerged in the past two decades as a promising cancer therapy.1–3 CAP is formed by applying a high electric field across a gas. This accelerates electrons into nearby atoms and molecules leading to a cascade effect of ionization, excitation, and dissociation processes, ultimately creating a unique environment of positive and negative charges, UV radiation, reactive species, and neutral molecules.4 CAP therapeutic effects have been linked to high concentrations of reactive oxygen and nitrogen species (RONS), including atomic nitrogen5 and oxygen,6,7 hydroxyl (OH−),8 singlet delta oxygen,9 superoxide,10 and nitric oxide (NO).11,12 These active species have been extensively reported as key mediators of oxidative damage and cancer cell death during plasma treatment.13–15 Furthermore, the interaction of these species with cell culture media has played an important role in treatment outcomes. In a previous study, it was shown that the efficacy of CAP treatment can be regulated by the concentration of fetal bovine serum (FBS) in media.16
Recent studies have introduced CAP as a selective therapy with a high affinity for triggering death in cancer cells while leaving normal cells unharmed and with no specificity to any type of cancer.4,10,17 Several investigators have reported the successful application of CAP for in vitro treatment of approximately 20 cancer types including neuroblastoma,18 pancreatic carcinoma,19,20 melanoma21–23 cervical carcinoma,24,25 lung carcinoma,18,26 head and neck carcinoma,18 and breast cancer.27,28
Results from previous studies reveal that different types of cancers exhibit different responses when exposed to the same CAP treatment conditions. Therefore, it is essential to identify methods for monitoring cell response in real time so that plasma operational parameters can be adjusted to tailor CAP therapy to cancers at various stages. An understanding of the role of CAP operational parameters is significant because they control the chemical composition of plasma and thereby the quantity of RONS delivered by it.
Here, we conduct a proof-of-principle investigation to identify the role of two CAP operational parameters: (1) discharge voltage in the adjustment of plasma composition and (2) treatment duration in the modification of overall plasma action. We monitor the effects of CAP in breast cancer and glioblastoma cell lines in real time by observing cell viability and levels of exogenous and endogenous H2O2 and NO2− within each cell culture. Programmed cell death (apoptosis) is investigated as a likely mechanism initiating a reduction in viable cells via changes to the mitochondrial membrane potential.29 Furthermore, our study presents the first experimental evidence concerning the impact of CAP in protein synthesis which is responsible for disruption in cancer growth and development.30 The presented work is important because it addresses the significance of monitoring cell response in real time, and the role of CAP discharge voltage and exposure time as key factors in the effectiveness of CAP therapy. The operational CAP properties are further discussed for their potential application in the development of an adaptive CAP platform. The novel platform could enhance selective destruction of cancer cells independent of cancer type or CAP treatment condition.
2. EXPERIMENTAL SECTION
2.1. CAP Treatment and Device Operation Parameters
The CAP device was manufactured at the Micro-propulsion and Nano-technology Laboratory of the George Washington University. The device was operated at a frequency of 13 kHz with a helium flow rate of 4–5 L/min. The helium plasma jet was generated via the dielectric barrier discharge.31 The spot size of the plasma jet when in contact with liquid media had a diameter of about 10 mm. The distance between the plasma jet outlet and the surface of the cell culture medium was fixed at 2 cm. The device was operated in the discharge voltage range of 3–6 kV, with results presented at 3.16 and 3.71 kV. Plasma treatment was performed by a direct method with cells treated in culture medium, and the CAP effect was quantified for different postexposure time points (0 min to 48 h).
2.2. Cell Culture
The human cancer cell lines, U87 (glioblastoma) and MDA-MB-231 (breast adenocarcinoma), were obtained from the American Type Culture Collection (ATCC) (Manassas, VA). The epithelial cell lines were cultured in Dulbecco’s modified Eagle medium (DMEM) (Life Technologies) supplemented with 10% (v/v) FBS (ThermoFisher) and 1% (v/v) penicillin and streptomycin (Life Technologies). Cell cultures were maintained at 37 °C in a humidified incubator containing 5% (v/v) CO2.
2.3. Kinetic Study: Cell Viability
CAP-induced cell death was investigated by RealTime-Glo MT Cell Viability Assay (Cat. no. G9711, Promega) with a continuous read method for up to 48 h after CAP exposure. The assay measured cell metabolic activity which served as a proxy for cell viability. Adherent cells were plated in tissue culture grade white-walled 96-well plates at a density of 5000 cells in 100 μL of DMEM media per well. Cells were incubated overnight at 37 °C in a humidified incubator. Subsequently, at 60% confluency, culture media was replaced with 50 μL of fresh media to remove any unbound cells. The 2X RealTime-Glo solution was prepared following manufacturer’s protocol by diluting 2 μL of the MT Cell Viability Substrate and 2 μL of NanoLuc enzyme in 996 μL of DMEM. Once prepared, 50 μL of the 2X solution was added to cells in 50 μL of culture medium for a final volume of 100 μL per well. The plates were incubated overnight to allow complete incorporation of the reagents. Following manufacturer’s protocol, the cell culture media was not replaced prior to CAP treatment because this would cause the NanoLuc enzyme in the media to be removed and the assay to be invalid. Cells were treated with CAP for 30, 60, 90, and 180 s at 3.16 or 3.71 kV. Luminescence was measured with a Thermo Varioskan LUX microplate reader at 37 °C immediately upon CAP treatment for every 10 min up to 1 h and at 6, 12, 24, and 48 h. Luminescence intensities of the CAP-treated condition were normalized to the untreated CAP sample (control). Each condition was performed in triplicate, and the experiment was repeated three times.
2.4. Hydrogen Peroxide (H2O2) Detection
Extracellular H2O2 present in cell culture after CAP treatment was detected with a Fluorimetric Hydrogen Peroxide Assay (Cat. no. MAK165, Sigma-Aldrich). Cells were seeded in 96-well culture plates at a density of 5000 cells in 100 μL of DMEM media and allowed to adhere overnight. The cell culture media was replaced with 100 μL of fresh media prior to treatment with CAP. At least 50 μL of the culture media from treated cells were transferred per well into a black-walled 96-well plate, and the assay was conducted following manufacturer’s protocol. Fluorescence intensity was quantified at excitation/emission wavelengths of 540/590 nm, respectively, with readings at 0–60 min and 6, 12, 24, and 48 h posttreatment at 3.16 and 3.71 kV with a Synergy H1 hybrid multi-mode microplate reader. The mean of the optical density values was compared to a standard curve, and results were expressed in units of μM.
2.5. Nitrite (NO2−) Detection
The concentration of nitrite (NO2−), a stable downstream product of NO, was detected with Griess Reagent Assay (Cat. no. G2930, Promega) according to manufacturer’s instructions. Cells were seeded in 96-well culture plates at a density of 5000 cells in 100 μL of DMEM media and allowed to adhere overnight. The culture media was replaced with 100 μL of fresh media prior to CAP treatment. After incubation for 0–48 h, 50 μL of the treated suspensions were transferred per well into a clear-walled 96-well plate, and the assay was conducted following manufacturer’s protocol. Absorption was measured with a microplate reader at 560 nm for the following time points: 0–60 min, 6, 12, 24, and 48 h after CAP exposure. The results of a standard curve were utilized to translate the optical density values into the nitrite concentration expressed in μM.
2.6. Apoptosis: Annexin V and PI Assay
Annexin V assay was performed with the FITC Annexin V Apoptosis Detection Kit I (Cat. no. 556547, BD Biosciences) as recommended by the manufacturer. Cells cultured in 24-well plates (25 000 cells per well) were treated with plasma for 60 s. At 0, 20, 40, and 60 min and 6, 12, 24, and 48 h after treatment, the cells in the supernatants were collected by centrifugation. Adherent cells were harvested by Accutase (Innovative Cell Technologies) and added to the cells of the supernatant. Cells were washed once with PBS, resuspended in 200 μL of binding buffer (Cat. no. 556454, BD Biosciences), and stained with 5 μL of Annexin V FITC and 5 μL of PI. Following a 15 min incubation, cells were washed and resuspended in binding buffer before being analyzed with BD Biosciences FACSCalibur DxP8. The instrument was equipped with three lasers with excitation wavelengths of 407, 488, and 637 nm and eight detectors for fluorescence. To determine the number of live, apoptotic, and necrotic cells, data were analyzed with FlowJo vX.0.7.
2.7. Mitochondrial Membrane Potential Assay
The effect of CAP on cancer cells was visualized with MitoTracker Red CMXRos (Cat. no. M7512, Life Technologies), a mitochondrial-specific, noncytotoxic dye that accumulates in the cell’s mitochondria in a membrane potential-dependent manner. Briefly, 25 000 cells per well were seeded in 24-well plates and cultured overnight. Cell culture media was replaced with 600 μL of fresh media to remove any of the unbound cells. The adherent cells were treated with plasma for 60 s and incubated for an additional 6, 12, and 24 h before staining. After incubation with MitoTracker Red, cells were fixed in 4% paraformaldehyde and permeabilized with 0.5% Triton X in blocking buffer (50% (w/v) BSA in PBS). They were subsequently stained with Alexa Fluor 488 Phalloidin (Cat. no. A12379, Life Technologies) for visualizing F-actin followed by 4',6-diamidino-2-phenylindole (DAPI) (Cat. no. 62247, ThermoFisher) for identifying the cell nucleus. Confocal imaging was performed with an Olympus IX81 laser-scanning microscope (Olympus, Tokyo, Japan) for visualizing the cell mitochondria. A decrease in red pixel intensity signifies a decrease in mitochondrial membrane potential.
2.8. Nascent Protein Synthesis Assay
Cells were prepared as described in section 2.7, before undergoing 60 s of plasma treatment and further incubation for 6, 12, and 24 h before staining. Nascent protein synthesis was determined using the Click-iT Plus O-propargylpuromycin (OPP) Alexa Fluor 488 protein synthesis assay kit according to the manufacturer’s instructions (Cat. no. C10456, Life Technologies). Briefly, cells were incubated with 20 μM Click-iT OPP working solution for 30 min, fixed with 4% paraformaldehyde in 1X PBS, and permeabilized with 0.5% Triton X. Cells were then incubated with Click-iT Plus OPP reaction cocktail for 30 min at room temperature protected from light, followed by incubation with Alexa Fluor 594 Phalloidin (Cat. no. A12381, Life Technologies) and DAPI (Cat. no. 62247, ThermoFisher), a blue stain to label nuclei. Nascent protein synthesis was assessed with confocal microscopy (Olympus IX81) by determining the signal intensity in the green fluorescence channel. Loss of green pixel intensity, indicative of OPP expression, signifies a decrease in the rate of protein synthesis.
2.9. Image and Statistical Analysis
All experimental results were obtained from three independent experiments performed in triplicate with the exception of the MitoTracker Red assay and the Click-iT Plus OPP protein synthesis assay, which were performed in duplicate. A total of 50 cells from two frames (25 cells each) were utilized for determining the pixel intensity of each stain. Results are expressed as mean ± SD. Adobe Photoshop was used to manage the images collected for protein synthesis and MitoTracker studies. Pixel intensities were determined with ImageJ (National Institute of Health, MD, USA). Data plots and statistical analyses were performed with Prism 6 (GraphPad software, San Diego, CA, USA). The differences between groups were determined by two-tailed unpaired t-tests, and data were considered significant for (*) p < 0.05, (**) p < 0.01, (***) p < 0.001, and (****) p < 0.0001. When standard deviations between groups were not equal, significance was determined using Welch corrected unpaired t-tests. Histograms were generated using mean and standard error of the mean values. In Figures 1–6, statistical significance was determined against untreated condition unless otherwise indicated.
Figure 1.
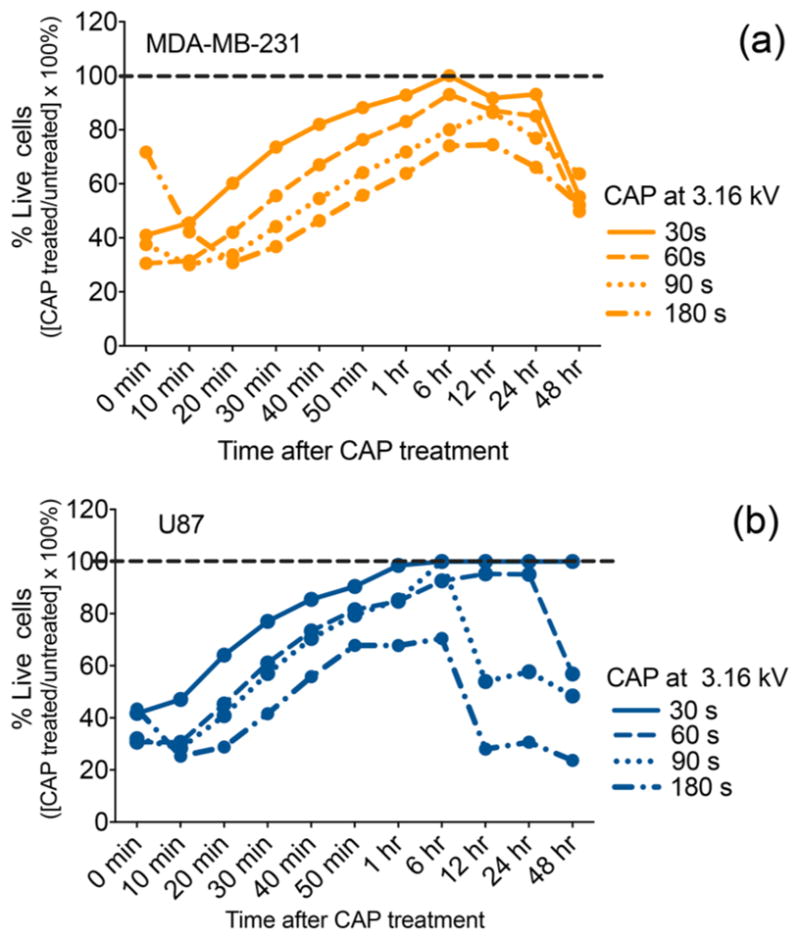
CAP treatment induces a significant reduction in cell viability over time as a function of the exposure time. MDA-MB-231 breast cancer cells (a) and U87 glioblastoma (b) cells were treated with a CAP output voltage of 3.16 kV for 30, 60, 90, and 180 s. Immediately following treatment, RealTime-Glo MT Cell Viability Assay (Promega) was performed with a continuous read method to evaluate the response of each cell line in real time. The data were normalized to the untreated control recorded for each time point. The % cell viability of the untreated control assumed as 100% is indicated by the dotted line.
Figure 6.
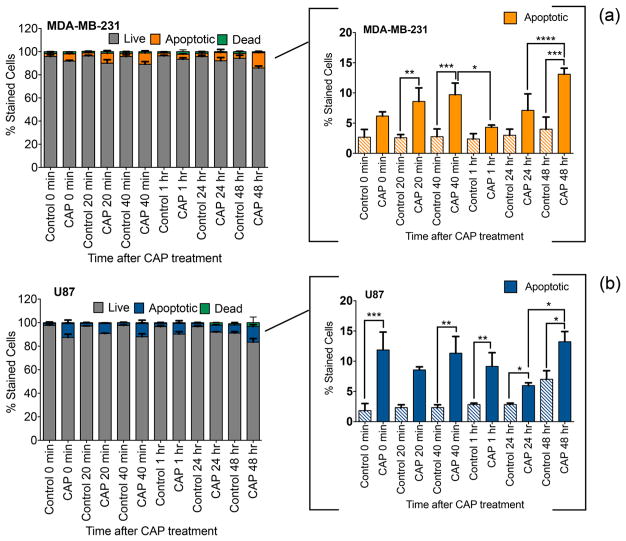
CAP exposure and apoptotic cell death. Annexin V assay of MD-MB-231 breast cancer cells (a) and U87 glioblastoma cells (b) treated with 60 s CAP at 3.16 kV. Apoptosis is presented as the percent stained fraction after treatment with respect to the untreated control.
3. RESULTS
3.1. Real-Time Monitoring of the Cell Response: Treatment Duration and Discharge Voltage
Figures 1 and 2 show the effect of plasma-treatment duration and discharge voltage on cancer cell viability, utilizing the RealTime-Glo MT Cell Viability Assay. This assay enabled continuous monitoring of cell response via repeated reading of the testing conditions over the course of 48 h. The RealTime-Glo assay involved the addition of a proprietary luciferase and a pro-substrate to the culture medium prior to CAP exposure. Live cells unaffected by CAP treatment facilitated conversion of the pro-substrate into a new substrate, which then diffused into the culture media. The newly generated substrate was consumed by luciferase to produce a luminescent signal. The signal correlated with the number of viable cells after treatment because dead cells were unable to reduce the pro-substrate and therefore did not produce a signal.24 Percent live cells were determined with respect to the untreated control condition. More specifically, percent live cells were calculated by dividing luminescent readings of the CAP-treated conditions with those of the untreated control and multiplying by 100%. Therefore, the cell viability of the untreated control was assumed as 100% and is indicated by the dotted line in Figures 1 and 2.
Figure 2.
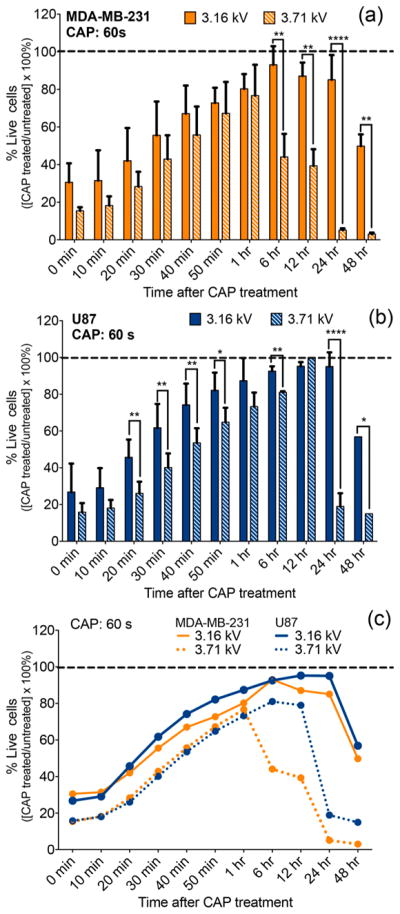
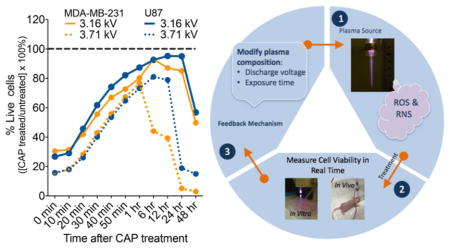
CAP effect on cell viability varies as a function of discharge voltage. Breast cancer cells (MDA-MB-231) (a) and glioblastoma cells (U87) (b) were treated with a CAP output voltage of 3.16 and 3.71 kV for 60 s. A side-by-side comparison (c) revealed a difference in viability between the two cell lines as a function of the discharge voltage. RealTime-Glo MT Cell Viability Assay (Promega) was performed with a continuous read method for evaluating the cell response. The data were normalized to the untreated control condition (assumed at 100% viability) indicated by the dotted line.
The viability of breast cancer (Figure 1a) and glioblastoma (Figure 1b) cells was quantified for up to 48 h following CAP exposures of 30, 60, 90, and 180 s at 3.16 kV. A greater than 50% reduction in cell viability was recorded immediately (0 min) after treatment in both cell lines for most CAP exposure times with the exception of 180 s treatment in breast cancer cells. Indeed, data showed that 30–90 s CAP treatments lead to more significant reductions in viability than 180 s CAP exposure. This unexpected outcome may result from CAP-generated reactive species needing time to fully become incorporated in cell culture media and come in contact with cancer cells. In fact, according to the data, it is not until 20 min after treatment when the differences in cell viability became correlated with treatment time duration. The decrease in cell viability observed immediately after treatment was followed by a viability increase which lasted up to 6 h. From 6–48 h, cell viability steadily decreased as a function of the exposure time for most CAP conditions. The delayed effect of plasma in initiating cell death may depend on the phase of the cell cycle.32 A previous study on CAP and keratinocytes suggested that increased amounts of reactive oxygen species (ROS) produced by plasma might cause oxidative DNA damage and delay the cell cycle (G2/M phase arrest), corresponding to a loss of viability.33 Therefore, the observed delayed effect in cell viability primarily observed between 0–6 h when cell viability seems to be recovering (Figure 1) may be linked to the amount of ROS produced by CAP. The reduction in cell viability observed between 6 and 48 h is in line with previous findings reporting that the most significant CAP effect is observed at 24 and 48 h post plasma exposure.
Despite exhibiting a similar cell viability trend in the initial hour after treatment, glioblastoma cell response differed significantly from that of breast cancer cells between 6 and 48 h. At 24 and 48 h, the shortest CAP exposure of 30 s ultimately amounted to no substantial reduction of glioblastoma cell viability, while viability of breast cancer cells decreased by 10–30%. Plasma treatments of 60, 90, and 180 s had a more significant effect on cell viability. These results attest to the fact that different cell lines responded differently to treatment.
According to the 24 h data collected from the 60 s treatment condition, glioblastoma and breast cancer cell viability were reported at 95 and 85%, respectively. The variation in response to treatment between the two cancer cell lines was noted for all CAP exposure times. The data provided evidence that the RealTime-Glo assay could detect the cell response to plasma treatment in real time with results varying per cell line and in a CAP-exposure time-dependent manner.
Figure 2 presents the same cell response pattern corresponding to the 60 s treatment in Figure 1. The data emphasize the variation in cell response resulting from an increase in discharge voltage from 3.16 to 3.71 kV. Breast cancer data (Figure 2a) revealed a statistically significant difference in cell viability between 3.16 and 3.71 kV conditions in the 6–48 h time range. The earliest detectable variance in cell response observed at 6 h after treatment corresponded to a 50% final difference in cell viability between the two voltage conditions. In glioblastoma cells, the first significant difference in cell response was observed as early as 20 min after treatment. The discharge voltage effect became more pronounced at 24 h where a 0.55 kV increase in voltage resulted in a 70% reduction in viability. Real-time results demonstrate the important role of CAP discharge voltage in influencing the cell response. Indeed, Figure 2c reveals a modification in voltage translated to different cell viability outcomes not only within one cancer cell line but also between the two types of cancers investigated.
3.2. Evaluation of H2O2 and NO2− After CAP Exposure
Figures 3–5 elucidate the link between CAP discharge voltage and the concentration of RONS generated by it. The current literature in plasma medicine identifies high concentrations of CAP-generated RONS as one of the primary factors linked to the effectiveness of CAP in cancer therapy. H2O2 and NO2− are two of the most well-reported and major longer-lived species produced by plasma. Hence, we monitored the levels of H2O2 and NO2− in breast cancer cells and glioblastoma cells (Figures 4 and 5).
Figure 3.
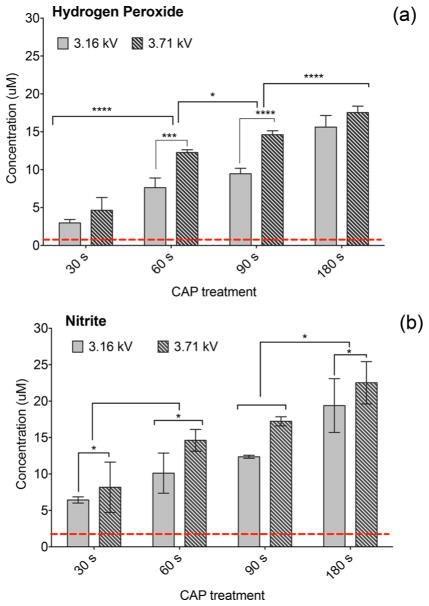
Levels of H2O2 and NO2− in cell culture media (no cells) immediately after CAP exposure. Concentration of CAP-generated H2O2 (a) and NO2− (b) was measured in cell culture media for CAP exposures of 30, 60, 90, and 180 s with 3.16 or 3.71 kV. Levels of CAP-generated H2O2 and NO2− rise with the increasing discharge voltage and exposure time. The lowest detection limit indicated by the dotted line is the amount of H2O2 and NO2− in untreated cell culture media.
Figure 5.
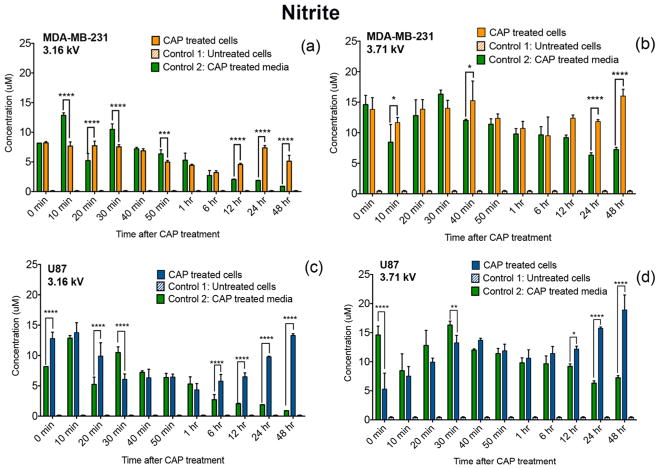
Accumulation of NO2− in cancer cells. MDA-MB-231 breast cancer cells (a,b) and U87 glioblastoma cells (c,d) were treated with a CAP output voltage of 3.16 or 3.71 kV for 60 s and were monitored over the course of 48 h. Accumulation of NO2− in cancer cells after CAP exposure was estimated by Griess reagent assay. NO2− levels in CAP-treated cells were measured and compared with those of untreated cells (control 1) and plasma-treated media (control 2).
Figure 4.
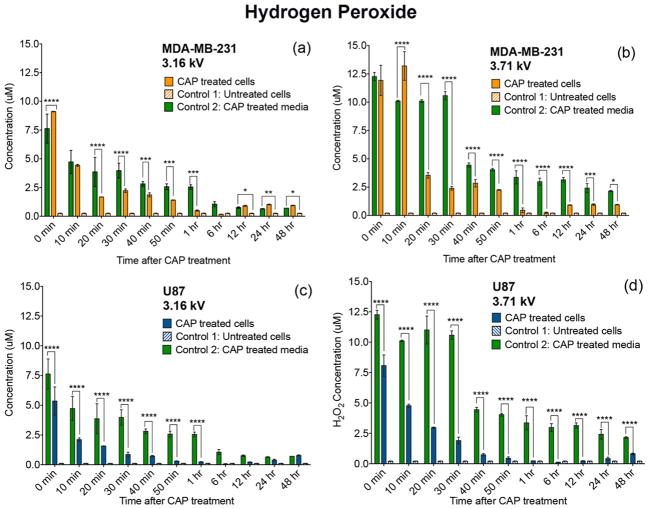
CAP-generated H2O2 becomes metabolically degraded by cancer cells. Cells were treated with a CAP output voltage of 3.16 or 3.71 kV for 60 s, and the effect of H2O2 was observed over the course of 48 h. CAP-treated MDA-MB-231 breast cancer cells (a,b) and U87 glioblastoma cells (c,d) metabolically degraded H2O2 starting immediately after CAP exposure. Levels measured in the CAP-treated cells were compared with those of control 1 (untreated cells) and 2 (CAP treated media).
Figure 3 shows the correlation between the concentration of CAP-generated reactive species, exposure time, and discharge voltage. The concentrations of H2O2 and NO2− generated by plasma were qualified in cell culture media (no cells) for exposure times of 30–180 s at 3.16 and 3.71 kV CAP discharge voltage immediately after treatment. Figure 3a,b shows that the concentration of CAP-generated species is well above the detection limit of 1.0 μM for H2O2 and 2.0 μM for NO2− as indicated by the dotted line. The lowest detection limit was determined by measuring the amount of H2O2 and NO2− in untreated cell culture media. The data show 30–180 s CAP exposures generating similar quantities of H2O2 and NO2− with concentrations of both species rising as a function of increased exposure time and discharge voltage. For instance, in Figure 3a, a 180 s plasma treatment at 3.71 kV generated substantially higher concentrations of H2O2 than a 30 s treatment at 3.16 kV. The same observation was noted for the quantity of CAP-generated NO2−. Altogether, the data demonstrated the important role of operational parameters in influencing the amount of reactive species generated by CAP.
Figures 4 and 5 highlight the levels of exogenous and endogenous H2O2 and NO2− within each cell culture. Given that at high delivery power, plasma produces higher levels of H2O2 and NO2−, we investigated the changes in quantities of H2O2 and NO2− over the course of 48 h in the presence of cancer cells. Cell behavior was evaluated by comparing CAP-treated conditions with controls. The selected control conditions included the following: (1) untreated cells and (2) CAP treated media. The amount of H2O2 and NO2− in untreated cells (control 1) was reported to be at less than 0.5 μM for all posttreatment time points ranging from 0–48 h. The amount of H2O2 and NO2− in CAP-treated media (control 2) decayed over time, as these species are highly unstable in aqueous solution.
We showed that the rate of H2O2 consumption varied per cell line as a function of CAP discharge voltage (Figure 4). A comparison over time of the CAP-treated cells with CAP-treated media control revealed that cancer cells metabolically degrade the generated H2O2. The rate of H2O2 consumption varied as a function of CAP discharge voltage. An increase in plasma discharge voltage from 3.16 to 3.71 kV was accompanied by an increase in the rate of H2O2 metabolic degradation between 0 and 40 min after treatment.
In a similar trend, the rate of CAP-generated NO2− consumption varied over time as a function of discharge voltage (Figure 5). Significantly higher levels of NO2− were detected at 24 and 48 h of treatment compared to the CAP-treated media (control 2). These results reveal that CAP not only delivers NO2− to cells but may also trigger NO2− production. Therefore, it seems likely that the demonstrated success of CAP-generated RONS is due to the cells consuming plasma-generated RONS, while also perhaps secreting small amounts of RONS in cell culture media as indicated by a previous study.4 While the role of extracellular H2O2 and NO2− in the effectiveness of CAP therapy remains to be further evaluated, altogether, data revealed that the cellular response to CAP exposure in terms of H2O2 and NO2− uptake or release varies not only per cell line but also because of adjustments in CAP discharge voltage.
3.3. CAP-Induced Apoptosis
The results of 24 h plasma treatment has been extensively investigated, while there is very little data on the immediate apoptotic effect of CAP. Here, we determine the overall apoptotic effect of CAP over the course of 48 h, starting immediately after treatment. The testing was conducted in 24-well plates, and therefore, the data are not directly comparable to the data in Figures 1–5 collected in 96-well plates. CAP-induced apoptosis was expected to decrease because of the 24-well plates’ larger volume and cell number per well. Nevertheless, the effect of CAP in inducing apoptosis is still evident in Figure 6.
Apoptosis was investigated by flow cytometric analysis in breast cancer and glioblastoma cells stained with Annexin V and propidium iodide. Exposure of cells to CAP (3.16 kV) for 60 s resulted in an accumulation of apoptotic cells where apoptosis was induced in a slow time-dependent manner, as indicated in Figure 6a,b. CAP-treated cancer cells showed a higher apoptotic activity than untreated control for the majority of the posttreatment time points. Furthermore, the trend in the rate of apoptosis varied per cell line in the first hour after CAP exposure. For instance, immediately (0 min) upon treatment, glioblastoma cells revealed a 70% increase in the rate of apoptosis in contrast to breast cancer cells. Overall, the results in Figure 6 attest to the varying effect of CAP on different cancer cells.
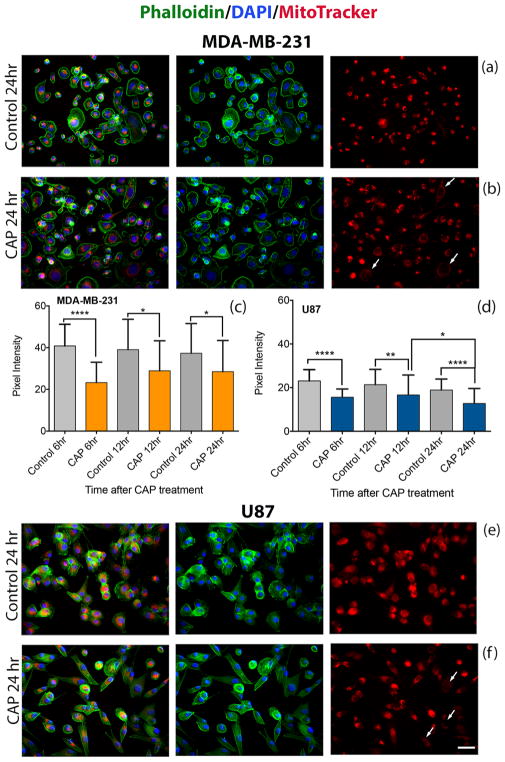
3.4. CAP-Induced Mitochondrial Dysfunction
Mito-chondria produce ATP, the primary energy source used in cells, via the citric acid cycle and oxidative phosphorylation. Their primary role of cellular energy production makes them a major source of cellular ROS (including H2O2) and oxidative stress which, if excessive, will initiate the collapse of the mitochondrial transmembrane potential and apoptosis.29 Here, we use the MitoTracker Red CMXRos dye to investigate possible involvement of the mitochondria in the pathways leading to apoptosis. CMXRos is a noncytotoxic dye that accumulates in mitochondria in a membrane potential-dependent manner; when the mitochondrial membrane potential is reduced, less dye enters mitochondria. Data are presented in Figure 7. While no significant differences in membrane potential are observed between 0 and 60 min after CAP exposure (data not shown), mitochondrial membrane potential decreases by 6 h and remains decreased 24 h after treatment. Data show a 20–50% decrease in pixel intensity 6–24 h after treatment compared to the untreated condition for both cell lines. In Figure 7b,f, cells exhibit a decrease in red pixel intensity, which is indicative of loss in mitochondrial membrane potential. Unlike the cell viability and ROS studies, this investigation was conducted in 24-well plates instead of 96-well plates. The plasma effect is expected to reduce when the volume of cell culture media and cell number are increased but treatment parameters such as discharge voltage and CAP exposure time remain the same. The results collected are not directly comparable with those of sections 2.1–2.3; however, they reflect the overall impact of CAP in activating cell signaling pertaining to apoptosis.
Figure 7.
CAP exposure reduces the mitochondrial membrane potential in cancer cells. Immunofluorescence staining of actin (phalloidin) green, nucleus (DAPI) blue, and MitoTracker Red of breast cancer MDA-MB-231 cells (a,b) and glioblastoma U87 cells (e,f) at 24 h. Subcellular distribution of MitoTracker Red was revealed by confocal microscopy. The white arrows in (b,f) point to cells exhibiting a decrease in the red pixel intensity, which is indicative of a loss in mitochondrial membrane potential. Pixel intensity values of 50 cells (two frames per experiment) reveal the distribution of mitochondrial membrane potentials at 6, 12, and 24 h after CAP exposure (c,d); scale bar (bottom image): 10 μm.
3.5. CAP in Protein Synthesis
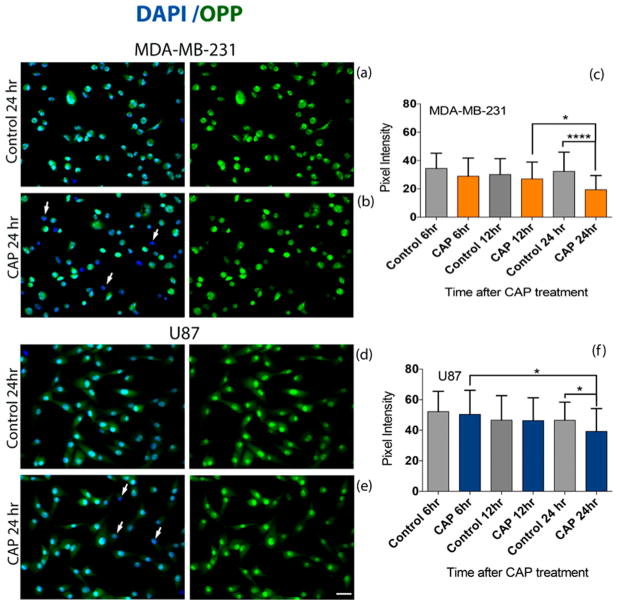
The overall rate of protein synthesis within cells is highly regulated to meet the needs of cells and tissues; it is reduced when nutrients are limited and when cells die and is increased when cells respond to stress.30 The impact of CAP on the rate of protein synthesis in cancer cells was assessed with a Click-iT Plus OPP assay by incorporating OPP as a proxy for total protein synthesis (Figure 8). OPP is able to tag newly synthesized peptide chains and thus visualize the proteins being made within the time of incubation. The OPP fluorescence signal was compared between different postexposure time points and the untreated control (no CAP) condition. CAP treatment results in a decrease in OPP fluorescence (green) compared to untreated controls. Similar to the mitochondrial membrane potential study, the testing was conducted in 24-well plates which allowed for a larger cell number and volume of cell culture media. While the plasma effect may be reduced in comparison to treatment in 96-well plates, the impact of CAP on the rate of protein synthesis is indisputable. OPP fluorescence decreased significantly between 12 and 24 h in breast cancer cells (Figure 8c) and between 6 and 24 h in glioblastoma cells (Figure 8e), which is indicative of a reduction in the rate of protein synthesis. Figure 8a,b,d,e displays a decrease in OPP fluorescence at 24 h after CAP exposure compared to the untreated condition for both cell lines. These findings are indicated with white arrows in Figure 8b,e, which point to cells that have lost green pixel intensity, indicating a reduction in protein synthesis.
Figure 8.
CAP exposure reduces protein synthesis in cancer cells. Cells were treated with 3.16 kV CAP for 60 s and compared to the untreated (no CAP) control condition. The Click-iT Plus OPP Alexa Fluor 647 Protein Synthesis Assay Kit was used to measure protein synthesis. Fluorescence intensities of 50 MDA-MB-231 breast cancer cells and 50 U87 glioblastoma cells from two experiments were quantified. Subcellular distribution of Click-iT Plus OPP staining (green) was revealed by confocal microscopy (a,b,d,e). Expression of OPP decreased between 12 and 24 h in MDA-MB-231 cells (c) and between 6 and 24 h in U87 cells (f). A decrease in pixel intensity correlates with a decrease in the level of protein synthesis. White arrows in (b,e) indicate the loss of OPP (green) in cells. The cell nucleus is visualized with DAPI in blue. Scale bar (bottom image): 10 μm.
The literature reveals that a reduction of protein synthesis activity indicates ongoing stress in cells and/or apoptosis.30 Therefore, the decrease in OPP fluorescence seen at 24 h after CAP exposure may be linked to the CAP-induced apoptosis.
4. DISCUSSION
In this study, we have demonstrated that the instantaneous CAP response can be effectively monitored by RealTime-Glo Assay with results interpreted as cell viability (Figure 1). CAP reduced cell viability as a function of discharge voltage and treatment time. The most significant reduction in cell viability was noted under the highest discharge voltage and exposure time (Figures 1 and 2). This observation is consistent with previous findings, suggesting that longer CAP exposures result in cancer cells becoming increasingly less resistant to treatment.34 Therefore, the effectiveness of CAP therapy can be improved by adjusting discharge voltage or exposure time which, in turn, controls the amount of CAP-generated RONS.
Based on previous studies, the ROS and RNS produced by plasma are essential in generating positive treatment outcomes by reducing cell viability and initiating apoptosis.35 Indeed, the chemical similarities between species created in plasma and those known to be involved with actions of the innate immune system suggest that CAP-generated RONS are the primary reason for the success of this therapy in treating cancers.36 In Figure 3, the quantity of the H2O2 and NO2− generated by CAP was dependent on CAP exposure time and discharge voltage. Furthermore, the incremental adjustments in discharge voltage significantly impacted cell behavior in the context of RONS consumption by cancer cells (Figures 4 and 5). This suggests that if plasma were to be operated at different delivery power and exposure times, the variations in the amount of RONS generated would be significant (Figure 3) and therefore the effect on the different types of cancer cells may vary (Figures 1 and 2). Studies have also shown that low plasma concentrations are responsible for inducing mutagenesis and cell proliferation in tumor cells. Kalghatgi showed that a low plasma concentration enhances endothelial cell proliferation because of CAP-generated ROS which mediated FGF-2 release.37 High ROS levels not only inhibit cell proliferation but also induce a high cytotoxic effect to the cell and can lead to apoptosis of a wide range of tumors.38,39 Therefore, ROS is described as potentially harmful to cellular metabolism because it impacts the cell function by altering cell development, growth, survival, and tumorigenesis.38
The observed decrease in H2O2 concentration over time (Figure 5) was in line with recent data, suggesting that cancer cells have the ability to quench ROS more effectively.15,40,41 Different biochemical changes including generation of ROS, calcium flux, caspase activation, loss of mitochondrial membrane potential, and deregulation in protein synthesis have been reported as essential events that commit cells to undergo apoptosis.29 CAP decreased cell viability and induced apoptosis as measured by a loss of the mitochondrial potential and deregulation of OPP expression, which is indicative of the rate of protein synthesis (Figures 7 and 8). The investigated cancer cell lines revealed a statistically significant reduction in the mitochondrial membrane potential at 6, 12, and 24 h after treatment (Figure 7), associating the inability to retain mitochondrial membrane integrity to CAP exposure. The mitochondria-mediated signaling pathway that is responsible for initiating apoptosis is associated with the release of cytochrome c from the mitochondria into the cytoplasm. Cytochrome c is then able to bind to the adaptor molecule apoptotic protease activating factor-1 and subsequently activate caspase-9 responsible for the initiating apoptosis.42 A previous study attested to the significant role of ROS in the mitochondrial apoptotic pathway by showing that the accumulation of ROS in the mitochondria was able to enhance apoptosis via reduction of the mitochondrial potential, initiation of mitochondrial oxidative stress, and releasing cytochrome c into the cytosol.43
Following CAP treatment, we also observed a general predisposition toward a reduction in the levels of protein synthesis. This suggested that CAP therapy may influence regulation of protein synthesis, which in turn impacts cancer development and growth.
The results presented elucidate how discharge voltage and treatment duration play a role in modifying plasma composition. The findings offer potential opportunities for developing an adaptive plasma system, as shown in Figure 9. The new platform is intended for monitoring the cellular response to CAP in a continuous read method, with RealTime-Glo assay serving as part of the overall feedback system. The data collected will be analyzed by a feedback algorithm which will rely on viability measurements of healthy and cancerous cells to predict the optimal amount of (1) delivery power and (2) exposure time. These two parameters will regulate the intensity of CAP and therefore the amount of RONS delivered to cells during treatment.
Figure 9.
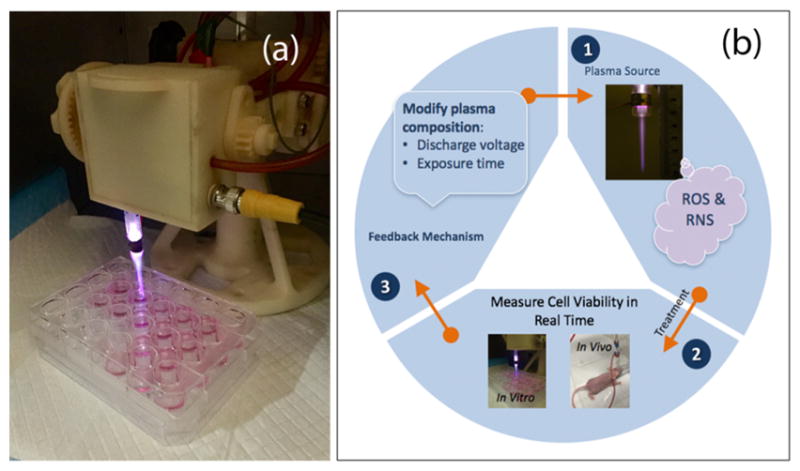
CAP device (a) and adaptive plasma platform (b). The platform monitors the cellular response to CAP in vitro and in vivo in a continuous read method. A feedback mechanism utilizes real-time data to determine the optimal amount of discharge voltage and exposure time to improve treatment outcomes and decrease cancer cell viability.
The feedback control algorithm will be developed according to nonlinear model-predictive controls (MPC).44 MPC or receding-horizon control is a strategy used to implement numerical solutions of an open-loop optimization in the form of feedback. MPC is particularly desirable for the proposed adaptive plasma platform, as the treatment conditions will be determined in an optimal fashion to maximize the decay rate of the tumor. The algorithm has been shown to leverage a model of plasma tumor interactions.45 The proposed adaptive CAP system will rely on findings and methods presented in this work and utilize theory and practice of an innovative modern control system that will advance the application of plasma in cancer treatment. The feedback system will employ adaptive properties of CAP to yield optimal and appropriate treatments tailored to real-time diagnostics, while laying a foundation for personalized adaptive cancer therapy.
5. CONCLUSIONS
In summary, the findings reveal compelling evidence in support of the important roles played by the adaptive properties of CAP, treatment duration, and discharge voltage in mediating cancer suppression. Through the formation of reactive species (NO2−, H2O2, and likely others, e.g., OH, O2, ONOO−, and NO) in cell culture media, we observed a reduction in cell viability dependent on CAP parameters. This ultimately led to apoptosis via changes in the mitochondrial membrane potential and the rate of protein synthesis. Therefore, the optimization of CAP operational parameters will be essential in providing long-lasting outcomes in anti-cancer therapy.
In addition, we outlined a potential device approach, which will rely on the presented adaptive properties of plasma for developing a feedback mechanism and optimizing plasma dosage. Following plasma exposure, it will be important to evaluate changes in cell response. The feedback mechanism will rely on real-time monitoring of cancer cell response in vitro and in vivo. We believe that the work presented here will lead to the development of a new CAP platform. This will serve as the foundation to propel CAP therapy to the forefront of other well-established therapies associated with cancer treatment. Moreover, the findings of this study will serve as a template for plasma medicine researchers to develop more robust and efficient devices that offer selective annihilation of cancer cells, while leaving healthy cells unharmed.
Acknowledgments
This work was supported by the US Patent Innovations Inc. (M.K., J.C.; Plasma Medicine Program), the National Science Foundation (M.K.; 465061), and the National Institutes of Health (M.A.S.; NEI R01-08512).
Footnotes
Author Contributions
All authors have given approval to the final version of the paper.
Notes
The authors declare no competing financial interest.
References
- 1.Keidar M, Yan D, Beilis II, Trink B, Sherman JH. Plasmas for Treating Cancer: Opportunities for Adaptive and Self-Adaptive Approaches. Trends Biotechnol. 2017 doi: 10.1016/j.tib-tech.2017.06.013. [DOI] [PubMed] [Google Scholar]
- 2.Stoffels E, Kieft IE, Sladek REJ, Van Den Bedem LJM, van der Laan EP, Steinbuch M. Plasma needle for in vivo medical treatment: recent developments and perspectives. Plasma Sources Sci Technol. 2006;15:S169. [Google Scholar]
- 3.Chen Z, Simonyan H, Cheng X, Gjika E, Lin L, Canady J, Sherman J, Young C, Keidar MA. Novel Micro Cold Atmospheric Plasma Device for Glioblastoma Both In Vitro and In Vivo. Cancers. 2017;9:61. doi: 10.3390/cancers9060061. [DOI] [PMC free article] [PubMed] [Google Scholar]
- 4.Keidar M. Plasmas for Cancer Treatment. Plasma Sources Sci Technol. 2015;24:033001. [Google Scholar]
- 5.Wagenaars E, Gans T, O’Connell D, Niemi K. Two-Photon absorption laser-Induced fluorescence measurements of atomic nitrogen in a radio-Frequency atmospheric-Pressure plasma jet. Plasma Sources Sci Technol. 2012;21:042002. [Google Scholar]
- 6.Knake N, Niemi K, Reuter S, Gathen VSVD, Winter J. Absolute atomic oxygen density profiles in the discharge core of a microscale atmospheric pressure plasma jet. Appl Phys Lett. 2008;93:131503. [Google Scholar]
- 7.Waskoenig J, Niemi K, Knake N, Graham LM, Reuter S, Gathen VSVD, Gans T. Atomic oxygen formation in a radio-Frequency driven micro-Atmospheric pressure plasma jet. Plasma Sources Sci Technol. 2010;19:045018. [Google Scholar]
- 8.Ninomiya K, Ishijima T, Imamura M, Yamahara T, Enomoto H, Takahashi K, Tanaka Y, Uesugi Y, Shimizu N. Evaluation of extra- and intracellular OH radical generation, cancer cell injury, and apoptosis induced by a non-Thermal atmospheric-Pressure plasma jet. J Phys D: Appl Phys. 2013;46:425401. [Google Scholar]
- 9.Sousa JS, Niemi K, Cox LJ, Algwari QT, Gans T, O’Connell D. Cold atmospheric pressure plasma jets as sources of singlet delta oxygen for biomedical applications. J Appl Phys. 2011;109:123302. [Google Scholar]
- 10.Kang SU, Cho J-H, Chang JW, Shin YS, Kim KI, Park JK, Yang SS, Lee J-S, Moon E, Lee K, Kim C-H. Nonthermal plasma induces head and neck cancer cell death: the potential involvement of mitogen-Activated protein kinase-Dependent mitochondrial reactive oxygen species. Cell Death Dis. 2014;5:e1056. doi: 10.1038/cddis.2014.33. [DOI] [PMC free article] [PubMed] [Google Scholar]
- 11.Ma Y, Ha CS, Hwang SW, Lee HJ, Kim GC, Lee K-W, Song K. Non-Thermal Atmospheric Pressure Plasma Preferentially Induces Apoptosis in p53-Mutated Cancer Cells by Activating ROS Stress-Response Pathways. PLoS One. 2014;9:e91947. doi: 10.1371/journal.pone.0091947. [DOI] [PMC free article] [PubMed] [Google Scholar]
- 12.Conway GE, Casey A, Milosavljevic V, Liu Y, Howe O, Cullen PJ, Curtin JF. Non-Thermal atmospheric plasma induces ROS-Independent cell death in U373MG glioma cells and augments the cytotoxicity of temozolomide. Br J Cancer. 2016;114:435–443. doi: 10.1038/bjc.2016.12. [DOI] [PMC free article] [PubMed] [Google Scholar]
- 13.Walk RM, Snyder JA, Srinivasan P, Kirsch J, Diaz SO, Blanco FC, Shashurin A, Keidar M, Sandler AD. Cold atmospheric plasma for the ablative treatment of neuroblastoma. J Pediatr Surg. 2013;48:67–73. doi: 10.1016/j.jpedsurg.2012.10.020. [DOI] [PubMed] [Google Scholar]
- 14.Hirst AM, Simms MS, Mann VM, Maitland NJ, O’Connell D, Frame FM. Low-Temperature plasma treatment induces DNA damage leading to necrotic cell death in primary prostate epithelial cells. Br J Cancer. 2015;112:1536–1545. doi: 10.1038/bjc.2015.113. [DOI] [PMC free article] [PubMed] [Google Scholar]
- 15.Graves DB. The emerging role of reactive oxygen and nitrogen species in redox biology and some implications for plasma applications to medicine and biology. J Appl Phys. 2012;45:263001. [Google Scholar]
- 16.Yan D, Sherman JH, Cheng X, Ratovitski E, Canady J, Keidar M. Controlling plasma stimulated media in cancer treatment application. Appl Phys Lett. 2014;105:224101. [Google Scholar]
- 17.Arndt S, Wacker E, Li YF, Shimizu T, Thomas HM, Morfill GE, Karrer S, Zimmermann JL, Bosserhoff AK. Cold atmospheric plasma, a new strategy to induce senescence in melanoma cells. Exp Dermatol. 2013;22:284–289. doi: 10.1111/exd.12127. [DOI] [PubMed] [Google Scholar]
- 18.Guerrero-Preston R, Ogawa T, Uemura M, Shumulinsky G, Valle BL, Pirini F, Ravi R, Sidransky D, Keidar M, Trink B. Cold atmospheric plasma treatment selectively targets head and neck squamous cell carcinoma cells. Int J Mol Med. 2014;34:941–946. doi: 10.3892/ijmm.2014.1849. [DOI] [PMC free article] [PubMed] [Google Scholar]
- 19.Brullé L, Vandamme M, Riès D, Martel E, Robert E, Lerondel S, Trichet V, Richard S, Pouvesle J-M, Pape AL. Effects of a Non Thermal Plasma Treatment Alone or in Combination with Gemcitabine in a MIA PaCa2-Luc Orthotopic Pancreatic Carcinoma Model. PLoS One. 2012;7:e52653. doi: 10.1371/journal.pone.0052653. [DOI] [PMC free article] [PubMed] [Google Scholar]
- 20.Partecke LI, Evert K, Haugk J, Doering F, Normann L, Diedrich S, Weiss FU, Evert M, Huebner NO, Guenther C, Heidecke CD, Kramer A, Bussiahn R, Weltmann KD, Pati O, Bender C, Bernstorff WV. Tissue Tolerable Plasma (TTP) induces apoptosis in pancreatic cancer cells in vitro and in vivo. BMC Cancer. 2012;12:473. doi: 10.1186/1471-2407-12-473. [DOI] [PMC free article] [PubMed] [Google Scholar]
- 21.Zucker SN, Zirnheld J, Bagati A, Disanto TM, Soye BD, Wawrzyniak JA, Etemadi K, Nikiforov M, Berezney R. Preferential induction of apoptotic cell death in melanoma cells as compared with normal keratinocytes using a non-Thermal plasma torch. Cancer Biol Ther. 2012;13:1299–1306. doi: 10.4161/cbt.21787. [DOI] [PMC free article] [PubMed] [Google Scholar]
- 22.Georgescu N, Lupu AR. Tumoral and Normal Cells Treatment With High-Voltage Pulsed Cold Atmospheric Plasma Jets. IEEE Trans Plasma Sci. 2010;38:1949–1955. [Google Scholar]
- 23.Zirnheld JL, Zucker SN, DiSanto TM, Berezney R, Etemadi K. Nonthermal Plasma Needle: Development and Targeting of Melanoma Cells. IEEE Trans Plasma Sci. 2010;38:948–952. [Google Scholar]
- 24.Ahn HJ, Kim KI, Kim G, Moon E, Yang SS, Lee J-S. Atmospheric-Pressure Plasma Jet Induces Apoptosis Involving Mitochondria via Generation of Free Radicals. PLoS One. 2011;6:e28154. doi: 10.1371/journal.pone.0028154. [DOI] [PMC free article] [PubMed] [Google Scholar]
- 25.Leduc M, Guay D, Leask RL, Coulombe S. Cell permeabilization using a non-Thermal plasma. New J Phys. 2009;11:115021. [Google Scholar]
- 26.Kim JY, Ballato J, Foy P, Hawkins T, Wei Y, Li J, Kim SO. Apoptosis of lung carcinoma cells induced by a flexible optical fiber-Based cold microplasma. Biosens Bioelectron. 2011;28:333–338. doi: 10.1016/j.bios.2011.07.039. [DOI] [PubMed] [Google Scholar]
- 27.Kim SJ, Chung TH, Bae SH, Leem SH. Induction of apoptosis in human breast cancer cells by a pulsed atmospheric pressure plasma jet. Appl Phys Lett. 2010;97:023702. [Google Scholar]
- 28.Wang M, Holmes B, Cheng X, Zhu W, Keidar M, Zhang LG. Cold Atmospheric Plasma for Selectively Ablating Metastatic Breast Cancer Cells. PLoS One. 2013;8:e73741. doi: 10.1371/journal.pone.0073741. [DOI] [PMC free article] [PubMed] [Google Scholar]
- 29.Murphy KM, Ranganathan V, Farnsworth ML, Kavallaris M, Lock RB. Bcl-2 inhibits Bax translocation from cytosol to mitochondria during drug-Induced apoptosis of human tumor cells. Cell Death Differ. 2000;7:102–111. doi: 10.1038/sj.cdd.4400597. [DOI] [PubMed] [Google Scholar]
- 30.Buszczak M, Signer RAJ, Morrison SJ. Cellular Differences in Protein Synthesis Regulate Tissue Homeostasis. Cell. 2014;159:242–251. doi: 10.1016/j.cell.2014.09.016. [DOI] [PMC free article] [PubMed] [Google Scholar]
- 31.Shashurin A, Keidar M. Experimental approaches for studying non-equilibrium atmospheric plasma jets. Phys Plasmas. 2015;22:122002. [Google Scholar]
- 32.Volotskova O, Hawley TS, Stepp MA, Keidar M. Targeting the cancer cell cycle by cold atmospheric plasma. Sci Rep. 2012;2:636. doi: 10.1038/srep00636. [DOI] [PMC free article] [PubMed] [Google Scholar]
- 33.Blackert S, Haertel B, Wende K, Woedtke TV, Lindequist U. Influence of non-Thermal atmospheric pressure plasma on cellular structures and processes in human keratinocytes (HaCaT) J Dermatol Sci. 2013;70:173–181. doi: 10.1016/j.jdermsci.2013.01.012. [DOI] [PubMed] [Google Scholar]
- 34.Cheng X, Sherman J, Murphy W, Ratovitski E, Canady J, Keidar M. The Effect of Tuning Cold Plasma Composition on Glioblastoma Cell Viability. PLoS One. 2014;9:e98652. doi: 10.1371/journal.pone.0098652. [DOI] [PMC free article] [PubMed] [Google Scholar]
- 35.Ahn HJ, Kim KI, Hoan NN, Kim CH, Moon E, Choi KS, Yang SS, Lee J-S. Targeting Cancer Cells with Reactive Oxygen and Nitrogen Species Generated by Atmospheric-Pressure Air Plasma. PLoS One. 2014;9:e86173. doi: 10.1371/journal.pone.0086173. [DOI] [PMC free article] [PubMed] [Google Scholar]
- 36.Graves DB. Low temperature plasma biomedicine: A tutorial review. Phys Plasmas. 2014;21:080901. [Google Scholar]
- 37.Kalghatgi S, Friedman G, Fridman A, Clyne AM. Endothelial cell proliferation is enhanced by low dose non-thermal plasma through fibroblast growth factor-2 release. Ann Biomed Eng. 2010;38:748–757. doi: 10.1007/s10439-009-9868-x. [DOI] [PubMed] [Google Scholar]
- 38.Dreher D, Junod AF. Role of oxygen free radicals in cancer development. Eur J Cancer. 1996;32:30–38. doi: 10.1016/0959-8049(95)00531-5. [DOI] [PubMed] [Google Scholar]
- 39.Sensenig R, Kalghatgi S, Cerchar E, Fridman G, Shereshevsky A, Torabi B, Arjunan KP, Podolsky E, Fridman A, Friedman G, Azizkhan-Clifford J, Brooks AD. Non-thermal plasma induces apoptosis in melanoma cells via production of intracellular reactive oxygen species. Ann Biomed Eng. 2011;39:674–687. doi: 10.1007/s10439-010-0197-x. [DOI] [PMC free article] [PubMed] [Google Scholar] [Retracted]
- 40.Diehn M, Cho RW, Lobo NA, Kalisky T, Dorie MJ, Kulp AN, Qian D, Lam JS, Ailles LE, Wong M, Joshua B, Kaplan MJ, Wapnir I, Dirbas FM, Somlo G, Garberoglio C, Paz B, Shen J, Lau SK, Quake SR, Brown JM, Weissman IL, Clarke MF. Association of reactive oxygen species levels and radioresistance in cancer stem cells. Nature. 2009;458:780–783. doi: 10.1038/nature07733. [DOI] [PMC free article] [PubMed] [Google Scholar]
- 41.Gorrini C, Harris IS, Mak TW. Modulation of oxidative stress as an anticancer strategy. Nat Rev Drug Discovery. 2013;12:931–947. doi: 10.1038/nrd4002. [DOI] [PubMed] [Google Scholar]
- 42.Xiong S, Mu T, Wang G, Jiang X. Mitochondria-mediated apoptosis in mammals. Protein Cell. 2014;5:737–749. doi: 10.1007/s13238-014-0089-1. [DOI] [PMC free article] [PubMed] [Google Scholar]
- 43.Zhao J, Zhang L, Li J, Wu T, Wang M, Xu G, Zhang F, Liu L, Yang J, Sun S. A novel pyrazolone-based derivative induces apoptosis in human esophageal cells via reactive oxygen species (ROS) generation and caspase-dependent mitochondria-mediated pathway. Chem-Biol Interact. 2015;231:1–9. doi: 10.1016/j.cbi.2015.02.004. [DOI] [PubMed] [Google Scholar]
- 44.Magni L, Raimondo DM, Allgöwer F. Nonlinear Model Predictive Control: Towards New Challenging Applications. Springer; Berlin: 2009. [Google Scholar]
- 45.Murphy W, Carroll C, Keidar M. Simulation of the effect of plasma species on tumor growth and apoptosis. J Phys D: Appl Phys. 2014;47:472001. [Google Scholar]


