Abstract
Background
HIF-1α plays an important role in hypoxia-ischemia brain damage. Accumulating evidences demonstrates that HIF-1α can contribute to cell autophagy. Oxygen-glucose deprivation (OGD) is a commonly used ischemic model in vitro. Our study was performed to investigate the influences of HIF-1α on autophagy in SH-SY5Y cells under OGD treatment.
Material/Methods
An OGD model was constructed in SH-SY5Y cells. PI method and MTT assay were used to test cell death and viability, respectively. Western blot assay was used to estimate the protein levels of HIF-1α and LC3. Quantitative GFP-LC3 light microscopy autophagy assay was performed for SH-SY5Y cells. 2ME2 and siRNA-HIF-1α were applied to investigate the effects of HIF-1α-knockdown on LC3 expression. Additionally, 3-MA (autophagy inhibitor) and autophagy inducer rapamycin (Rapa) were used to investigate the effects of autophagy on cell survival under OGD condition.
Results
Under OGD, the apoptosis of SH-SY5Ycells was increased while cell viability rate was decreased. The expression of HIF-1α was increased along with the advancement of OGD treatment and achieved the highest level at 24 h. However, inhibiting HIF-1α expression decreased the cell apoptosis and increased cell viability. LC3-II expression was gradually increased with the duration of OGD condition and knockdown of HIF-1α resulted in decreased expression of LC3. Inhibiting autophagy significantly enhanced the viability and reduced the apoptosis of SH-SY5Y cells, while enhancing autophagy showed the opposite effects.
Conclusions
Enhanced expression of HIF-1α may be related to autophagy activation in SH-SY5Y cells, thus contributing to ischemic/hypoxic brain damage.
MeSH Keywords: 3T3 Cells; Catechol 1,2-Dioxygenase; Electrophoretic Mobility Shift Assay
Background
Acquired neonatal brain damage is commonly caused by hypoxic and ischemic complications during the pre- and perinatal periods and is closely related to severe neurodevelopmental disability. Potential risk factors for such damages include hypoxic/ischemic (HI) injury at birth and chronic compromised supply of energy and oxygen during the prenatal period [1]. The vulnerability of the brain to HI is largely determined by the severity of hypoxia and the stage of brain maturation [2]. The adaptive mechanisms modifying hypoxia-induced molecular cascade are regarded as crucial factors for the pathophysiology of HI damage. The family of hypoxia-inducible factors (HIFs), one of the adaptive systems, is attracting increasing research attention because of their roles in cerebral response to HI and their abilities to trigger metabolic and vasoactive cytoprotective mechanisms in late stages of HI damage in brain development.
Hypoxia-inducible factor-1 (HIF-1), a basic helix-loop-helix heterodimeric transcription factor, plays an important role in cellular response to hypoxia [3]. It is composed of a subunit (HIF-1α) regulated by O2 concentration and a constitutively expressed subunit (HIF-1β) [4]. It has been reported that hypoxia can enhance HIF-1 transcriptional activity and HIF-1α levels [5,6].
Autophagy, a catabolic process, is responsible for degrading cellular components through lysosomes, which is important for cellular homeostasis between catabolism and biosynthesis [7–10]. It has been demonstrated that autophagy is involved in multiple physiological processes and in disease pathogenesis [11,12]. Autophagy not only takes part in homeostasis and adaptation to stress, but also participates in cell differentiation [13–15]. Reportedly, autophagy plays a crucial role in protecting cells from hypoxia [16,17].
Our present study was performed to investigate the roles of HIF-1α in cell autophagy in the oxygen-glucose deprivation (OGD) condition. Cell autophagy was analyzed via testing LC3 protein and GFP-LC3 puncta. The findings could help understand the underlying roles of HIF-1α in ischemic/hypoxic brain damages.
Material and Methods
SH-SY5Y cell culture and OGD induction
Human neuroblastoma SH-SY5Y cells were cultured in DMEM (Gibco, California, USA) with fetal bovine serum (10%, Gibco, USA), sodium bicarbonate (3.7 g/L) and penicillin-streptomycin sulfate (100 units/ml) at 37°C in an incubator filled with 5% CO2 and 95% filtered air. The cells were collected at logarithmic phase for induction of the OGD model. The collected SH-SY5Y cells were incubated with sugar-free DMEM and then put in a chamber with mixed gas of 95%N2+5%CO2 for 48 h. SH-SY5Y cells were harvested for subsequent analyses.
Cell apoptosis assay
At 0 h, 6 h, 12 h, 24 h, and 48 h after OGD induction, the cell apoptosis rates were assessed. The cells were treated with 0.5 ml trypsin (0.25%) for 30 min, and then re-suspended in 1 ml PBS. Next, they were incubated in 0.5 ml PI solution (10 μg/ml) at 37°C for 30 min in the dark. Apoptosis was determined using an FACS420 flow cytometer (Becton Dickinson, USA).
Cell viability assay
Cell viability was tested using MTT assay. The cell viability was detected at 0h, 6 h, 12 h, 24 h, and 48 h after exposure to OGD condition. SH-SY5Y cells were seeded in 96-well plates, 20 μl MTT solution (5 mg/mL) was added into each of the wells, and then the cells were incubated at 37°C for 4 h. After the incubation, the MTT solution was discarded, 150 μl DMSO was added, and the mixture was vibrated for 10 min. The density was then determined at 570 nm with a microplate reader. The relative cell viability was calculated based on the cell viability at 0 h (100%). All experiments were performed in triplicate.
Western blot analysis of HIF-1α and LC3
The levels of HIF-1α and LC3 proteins were determined at 0 h, 6 h, 12 h, 24 h, and 48 h after exposure to OGD condition. The medium was extracted and the cells were washed with ice-cold PBS. Then, PBS was extracted completely, and newly added lysis solution (Triton X-100/glycerol buffer) was blended with the cells. After centrifugation at 12 000 rpm for 5 min at 4°C, the protein concentration was measured by BCA method. Lysates were separated with SDS-PAGE and then transferred to polyvinylidene difluoride (PVDF) membrane. The membranes were blocked with nonfat dry milk (5%) in Tris-buffered saline (pH 7.4) and then incubated with primary anti-mouse antibody and anti-rabbit antibody. The protein expression was visualized with SuperSignal West Dura Extended Duration substrate reagent (Thermo, 34075).
Quantitative GFP-LC3 analysis
Quantitative GFP-LC3 light microscopy autophagy assays were performed for SH-SY5Y cells. Treated cover glass was put on 6-well plates and the SH-SY5Y cells were seeded into 6-well plates. The SH-SY5Y cells reaching 50% confluence were transfected with GFP-LC3-expressing plasmid with Lipofectamine® 2000 (Invitrogen Life Technologies). The transfected cells were incubated at 37°C for 4 h. Then, the medium was replaced by the medium containing 10% fetal bovine serum and incubated at 37°C in 5% CO2 for 24 h. Cell nuclei were dyed with DAPI for 10 min, and then washed for 20 min by PBS with 2% BSA. The remaining water in the cover glass was removed by blotting with absorbent paper, then the samples were tested.
Influences of 2ME2 and siRNA-HIF-1α on the LC3 expression
2ME2 (inhibitor of HIF-1α) and siRNA-HIF-1α (sc-35562) were used to investigate the influence of HIF-1α-knockdown on LC3 expression. The cells were treated with 10 μmol/L 2ME2 for 30 min during OGD treatment. Control sample was treated with same volume of PBS. pSilence U6-1.0 vector and siRNA-HIF-1α (1: 2) were connected by T4 ligase and then transformed into competent SH-SY5Y cells. SH-SY5Y cells were transfected with siRNA for 24 h after 12 h of OGD treatment. After knocking down HIF-1α, the expression of LC3 was evaluated.
Statistics analysis
The data are expressed as mean ±SD. Statistical analyses were performed using SPSS version 18.0 software. If data distributions were in accord with normality, the t test was used to compare the differences between 2 groups; otherwise, the non-parametric Wilcoxon rank sum test was used. The differences between multiple groups were estimated using ANOVA, and the results were adjusted through Bonferroni method. GraphPad Prism 5.0 software was used to plot graphs. P less than 0.05 indicated a significant difference.
Results
Survival rate of SH-SY5Y cells during OGD treatment
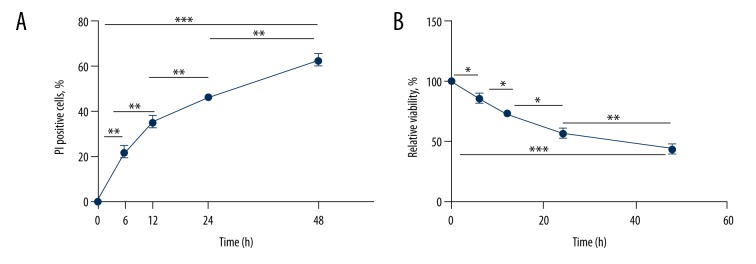
PI and MTT methods were used to investigate cell death and viability, respectively. As OGD progressed, the cell death rate gradually increased (F=65.666, P<0.001) and the cell viability rate decreased (F=69.118, P<0.001) (Figure 1, Table 1).
Figure 1.
Analyses of cell apoptosis and viability in SH-SY5Y cells after exposure to OGD condition at different time points (0 h, 6 h, 12 h, 24 h, and 48 h). (A) Percentage of PI-positive cells at different time points in apoptosis assay. With longer duration of OGD treatment, the rate of PI-positive cells exhibited an increasing trend (F=65.666, P<0.001). (B) Relative viability of cells at different time points in MTT assay. The cell viability exhibited an increasing trend with longer duration of OGD treatment (F=69.118, P<0.001). * P<0.05; ** P<0.01; *** P<0.001.
Table 1.
Survival rate of SH-SY5Y cells during OGD treatment.
| OGD time (h) | 0 | 6 | 12 | 24 | 48 |
|---|---|---|---|---|---|
| Cell apoptosis rate (%) | 0 | 22.33±2.52 | 35.33±2.52 | 46.33±1.53 | 62.67±2.52 |
| t values | – | −15.371 | −6.327 | −6.472 | −9.610 |
| P values | – | <0.001 | 0.003 | 0.003 | 0.001 |
| df | – | 4 | 4 | 4 | 4 |
| F value | 65.666 | ||||
| P value* | <0.001 | ||||
| df | 4 | ||||
| Cell viability rate (%) | 100 | 87.33±5.03 | 73.00±4.58 | 60.00±2.00 | 43.67±5.13 |
| t values | – | 3.555 | 3.647 | 4.503 | 5.137 |
| P values | – | 0.024 | 0.022 | 0.011 | 0.007 |
| df | – | 4 | 4 | 4 | 4 |
| F value | 69.118 | ||||
| P value* | <0.001 | ||||
| df | 4 |
P and t values represent the statistical significance of the comparison of the current checkpoint and the previous checkpoint; F value and P value* – calculated by ANOVA test; df – degrees of freedom.
HIF-1α expression in SH-SY5Y cells during OGD treatment
Western blot assay was used to investigate the expression level of HIF-1α protein under OGD condition. The expression level of HIF-1α was obviously increased with the progression of OGD treatment (F=99.205, P<0.001). Compared with the level at 0 h, the expression of HIF-1α was enhanced gradually in the first 24 h, and reached the peak at 24 h; then, the HIF-1α expression was decreased at 48 h when compared to that at 24 h (P<0.01, Figure 2, Table 2).
Figure 2.
The expression pattern of HIF-1α after exposing to OGD condition at different time points (0 h, 6 h, 12 h, 24 h, and 48h). (A) Protein level of HIF-1α was detected by Western blot. (B) The grayscale analysis for HIF-1α. Actin served as internal control. With longer duration of OGD treatment, the level of HIF-1α was significantly down-regulated (F=99.205, P<0.001).* P<0.05; ** P<0.01; *** P<0.001.
Table 2.
The expression profile of HIF-1α in SH-SY5Y cells during OGD treatment.
| OGD time (h) | 0 | 6 | 12 | 24 | 48 |
|---|---|---|---|---|---|
| HIF-1α/actin | 8.40±2.88 | 16.80±3.70 | 56.40±3.91 | 95.40±9.86 | 73.4±14.52 |
| t values | – | −4.005 | −16.443 | −8.218 | −2.823 |
| P values | – | 0.004 | <0.001 | <0.001 | 0.023 |
| df | – | 8 | 8 | 8 | 8 |
| F value | 99.205 | ||||
| P value* | <0.001 | ||||
| df | 4 |
P and t values represent the statistical significance of the comparison of the current checkpoint and the previous checkpoint; F value and P value* – calculated by ANOVA test; df – degrees of freedom.
The viability of SH-SY5Y cells after 2ME2 and siRNA-HIF-1α treatments
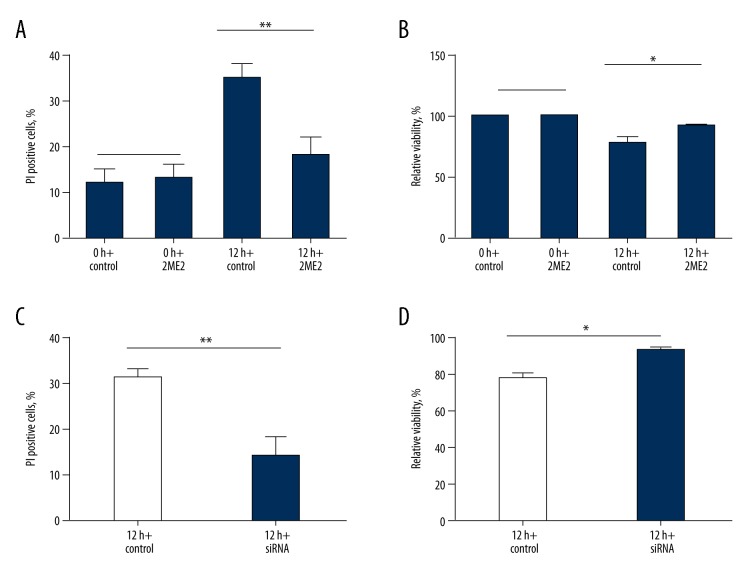
2ME2 and siRNA-HIF-1α were used to investigate the effects of HIF-1α knockdown on the viability of SH-SY5Y cells in the OGD model (Figure 3). At 0 h, the cell apoptosis and viability rates were similar in the control and 2ME2 groups (apoptosis: t=−0.365, P=0.724; viability: the cell viability at 0 h was defined as 100% in both control and 2ME2 groups). However, at 12 h, both 2ME2 and siRNA-HIF-1α treatments obviously decreased the apoptosis rate of SH-SY5Y cells (2ME2: t=3.812, P=0.005; siRNA-HIF-1α: t=4.696, P=0.002) and enhanced the cell viability (2ME2: t=−2.823, P=0.022; siRNA-HIF-1α: t=−3.151, P=0.014). The outcome indicated that the down-regulation of HIF-1α was related to decreased cell apoptosis and increased cell viability.
Figure 3.
Influences of 2ME2 and HIF-1α siRNA on cell apoptosis and viability in SH-SY5Y cells. (A, C) represent the percentage of PI-positive cells with 2ME2 or HIF-1α siRNA treatment. (B, D) represent the viability of cells with 2ME2 or HIF-1α siRNA treatment. (* P<0.05; ** P<0.01, Default: represents P>0.05).
LC3 expression levels in SH-SY5Y cells in OGD condition
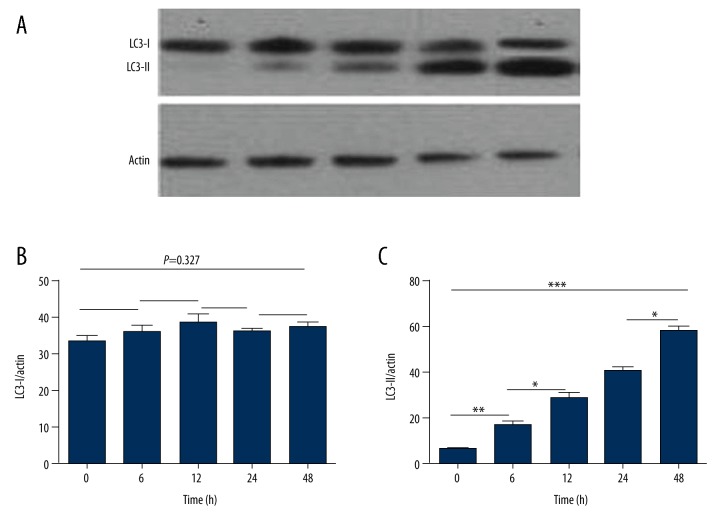
Western blot assay was performed to determine the expression of LC3. As shown in Figure 4, LC3-I expression level was stable (F=1.237, P=0.327), but LC3-II level was increased in a dose-dependent way (F=96.308, P<0.001).
Figure 4.
LC3 protein expression after exposing to OGD condition at different time point (0 h, 6 h, 12 h, 24 h and 48 h). (A) Protein level of LC3-I and LC3-II was detected by Western blot. (B) The grayscale analysis for LC3-I compared to actin. With OGD treatment time extension, the level of LC3-I was stable (F=1.237, P=0.327). (C) The grayscale value of LC3-II, compared to actin. The value of LC3-II was increased in a dose-dependent way (F=96.308, P<0.001). *** P<0.001; Default: represents P>0.05.
Autophagy analysis in OGD model
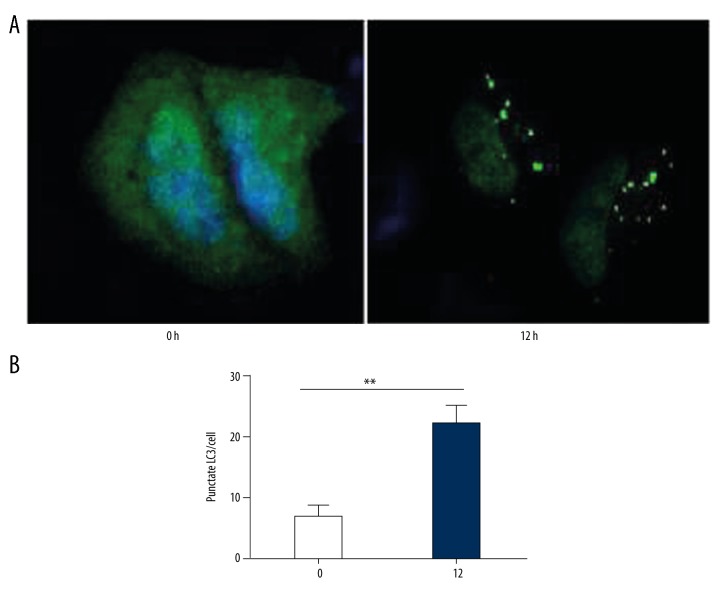
GFP-LC3 puncta were tested. At 0 h in OGD condition, no obvious green puncta were observed in SH-SY5Y cells, which indicated low-degree autophagy. At 12 h, a number of GFP-LC3 puncta were observed, indicating the formation of autophagy (t=−5.600, P=0.01, Figure 5).
Figure 5.
GFP-LC3 puncta observation at 0 h and 12 h after exposing to OGD condition. (A) the observation of GFP-LC3 puncta with fluorescence microscope at 0 h and 12 h. (B) The number of LC3 puncta was obviously increased at 12 h. (** P<0.01)
HIF-1α knockdown affected the expression of LC3
The influence of HIF-1α down-regulation on LC3 expression was investigated (Figure 6). The results suggested that the knockdown of HIF-1α, through 2ME2 and siRNA, decreased the expression of LC3 in the OGD model.
Figure 6.
LC3 protein expression with HIF-1α inhibition treatment using western blot. (A) LC3-I and LC3-II protein expression with HIF-1α siRNA treatment. (B) LC3-I and LC3-II protein expression with 2ME2 treatment.
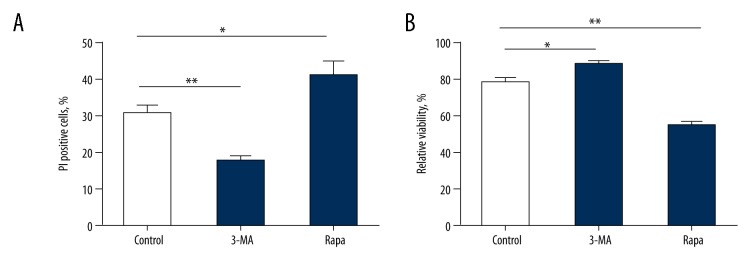
The viability and apoptosis rate of SH-SY5Y cells after 3-MA and Rapa treatment
For autophagy, 3-MA functioned as an inhibitor while Rapa acted as a promoter. The influences of 3-MA and Rapa on the viability and apoptosis of SH-SY5Y cells were investigated (Figure 7). The results suggested that 3-MA significantly enhanced the viability (t=−2.367, P=0.045) and reduced the apoptosis rate (t=3.679, P=0.006) of SH-SY5Y cells, while Rapa showed the opposite effects (viability: t=3.569, P=0.007; apoptosis: t=−2.461, P=0.039).
Figure 7.
Influences of 3-MA and Rapa on cell apoptosis and viability. (A) Percentage of PI-positive cells with 3-MA and Rapa treatment in apoptosis assay. (B) Relative viability of cells with 3-MA and Rapa treatment in MTT assay. (* P<0.05; ** P<0.01).0
Discussion
Accumulating evidence demonstrates that multiple stressful conditions can induce autophagy, such as nutrition deprivation, hypoxia, and toxins [18–21]. It is well known that autophagy is correlated with cell survival and death, but the exact role of autophagy in cell death has not been totally defined [22]. HIF-1 can regulate autophagy in hypoxic condition through mediating the expression of BNIP3 and BNIP3L, which are downstream genes of HIF-1 [23–25]. However, few studies have reported the function of HIF-1α in OGD-induced autophagy.
OGD is a frequently used in vitro model for ischemic/hypoxic brain damage [26]. In the present study, we constructed an OGD model to preliminarily investigate the potential role of HIF-1α in the autophagy of neuronal cells. The formation of GFP-LC3 puncta and increased expression of LC3 demonstrated that OGD can induce cell autophagy. Autophagy might take part in neuronal cell death caused by hypoxia and ischemia. A study focusing on microglia reported that hypoxia contributed to autophagic cell death of microglia [27]. 3-MA, an autophagy inhibitor, was found to be able to enhance the survival rate of SH-SY5Y cells in our research, while Rapa, an autophagy promoter, decreased the survival rate. These results indicated the involvement of cell autophagy in ischemic/hypoxic-induced brain damages.
We found that HIF-1α expression was elevated with the progression of OGD, which achieved the highest level at 24 h. In addition, knockdown HIF-1α with 2ME2 and siRNA was related to enhanced viability and reduced apoptosis of SH-SY5Y cells, as well as to decreased expression of LC3. These outcomes suggest that HIF-1α is involved in ischemia/hypoxia-induced autophagy. Zhao et al. reported that HIF-1α-knockdown abrogated autophagy induced by hypoxia in osteoclast cells [28]. In addition, reduced invasion and vascular remodeling were observed in autophagy-deficient cells under hypoxia [29]. Therefore, HIF-1α might enhance autophagy under ischemic/hypoxic condition, thus aggravating brain damage.
HIF-1α is crucial in ischemic preconditioning due to its regulatory effects on multiple genes that promote growth factor stimulation, angiogenesis, and glycolytic metabolism. It promotes the survival rates of cells exposed to hypoxic treatment [30–33]. Some researchers also reported that the function of promoting neuronal cell death might be attributed to the interactions between HIF-1α and p53 [34,35]. In addition, genes involved in apoptotic pathways, such as Tial1, Tia1, and Sfrs7, are all down-regulated in HIF-1α-deletion mice [36]. Tial1, a motif-type RNA-binding protein, is regarded as a mediator for apoptosis, and its expression is increased in the brain during ischemia and in astrocytes and neurons during hypoxia [37,38]. It was speculated that these proapoptotic genes contribute to enhanced apoptotic responses to hypoxia through p53/HIF-1α interactions [35,39]. HIF-1 was reported to promote the production of glycogen from glucose [40], and blocking OGT through inhibiting Sp1 O-GlcNAcylation and Sp1 siRNA remarkably reduced the expression of GlcN-induced HIF-1α under hypoxia [41].
The present study investigated the potential roles of HIF-1α in ischemic/hypoxic brain injury. However, the mechanism underlying the function of HIF-1α in autophagy was not explored. Hypoxia, autophagy, and glycosylation are all involved in the cell cycle. To obtain more accurate outcomes, glycosylation should be considered in future research. The results obtained in our study should be verified in animal models.
Conclusions
In conclusion, HIF-1α is involved in SH-SY5Y cell autophagy induced by OGD. HIF-1α may contribute to brain damage caused by hypoxia and ischemia through promoting autophagy activation in neuronal cells. These findings may provide a valuable therapeutic approach for the treatment of ischemic/hypoxic brain injury.
Footnotes
Source of support: Departmental sources
References
- 1.Smith AL, Rosenkrantz TS, Fitch RH. Effects of sex and mild intrainsult hypothermia on neuropathology and neural reorganization following neonatal hypoxic ischemic brain injury in rats. Neural Plast. 2016;2016(3):1–11. doi: 10.1155/2016/2585230. [DOI] [PMC free article] [PubMed] [Google Scholar]
- 2.Yin X, Meng F, Wang Y, et al. Effect of hyperbaric oxygen on neurological recovery of neonatal rats following hypoxic-ischemic brain damage and its underlying mechanism. Int J Clin Exp Pathol. 2013;6(1):66–75. [PMC free article] [PubMed] [Google Scholar]
- 3.Jeong W, Bazer FW, Song G, Kim J. Expression of hypoxia-inducible factor-1 by trophectoderm cells in response to hypoxia and epidermal growth factor. Biochem Biophys Res Commun. 2016;469(2):176–82. doi: 10.1016/j.bbrc.2015.11.091. [DOI] [PubMed] [Google Scholar]
- 4.Semenza GL. Hypoxia-inducible factors in physiology and medicine. Cell. 2012;148(3):399–408. doi: 10.1016/j.cell.2012.01.021. [DOI] [PMC free article] [PubMed] [Google Scholar]
- 5.Tsapournioti S, Mylonis I, Hatziefthimiou A, et al. TNFα induces expression of HIF-1α mRNA and protein but inhibits hypoxic stimulation of HIF-1 transcriptional activity in airway smooth muscle cells. J Cell Physiol. 2013;228(8):1745–53. doi: 10.1002/jcp.24331. [DOI] [PubMed] [Google Scholar]
- 6.Lee SD, Kim W, Jeong JW, et al. AK-1, a SIRT2 inhibitor, destabilizes HIF-1α and diminishes its transcriptional activity during hypoxia. Cancer Lett. 2016;373(1):138–45. doi: 10.1016/j.canlet.2016.01.031. [DOI] [PubMed] [Google Scholar]
- 7.Fong JT, Kells RM, Gumpert AM, et al. Internalized gap junctions are degraded by autophagy. Autophagy. 2012;8(5):794–811. doi: 10.4161/auto.19390. [DOI] [PMC free article] [PubMed] [Google Scholar]
- 8.Macintosh RL, Ryan KM. Autophagy in tumour cell death. Semin Cancer Biol. 2013;23(5):344–51. doi: 10.1016/j.semcancer.2013.05.006. [DOI] [PubMed] [Google Scholar]
- 9.Kaur J, Debnath J. Autophagy at the crossroads of catabolism and anabolism. Nat Rev Mol Cell Biol. 2015;16(8):461–72. doi: 10.1038/nrm4024. [DOI] [PubMed] [Google Scholar]
- 10.Masclaux-Daubresse C. Autophagy controls carbon, nitrogen, and redox homeostasis in plants. Autophagy. 2016;12(5):896–97. doi: 10.4161/auto.36261. [DOI] [PMC free article] [PubMed] [Google Scholar]
- 11.Netea-Maier RT. Modulation of inflammation by autophagy: Consequences for human disease. Autophagy. 2016;12(2):245–60. doi: 10.1080/15548627.2015.1071759. [DOI] [PMC free article] [PubMed] [Google Scholar]
- 12.Ciccia F, Haroon N. Autophagy in the pathogenesis of ankylosing spondylitis. Clin Rheumatol. 2016;35(6):1433–36. doi: 10.1007/s10067-016-3262-5. [DOI] [PubMed] [Google Scholar]
- 13.Cao Y, Fang Y, Cai J, et al. ROS functions as an upstream trigger for autophagy to drive hematopoietic stem cell differentiation. Hematology. 2016;21(10):613–18. doi: 10.1080/10245332.2016.1165446. [DOI] [PubMed] [Google Scholar]
- 14.Yuan J, Yu M, Li HH, et al. Autophagy contributes to IL-17-induced plasma cell differentiation in experimental autoimmune myocarditis. Int Immunopharmacol. 2014;18(1):98–105. doi: 10.1016/j.intimp.2013.11.008. [DOI] [PubMed] [Google Scholar]
- 15.Gomes LC, Odedra D, Dikic I, Pohl C. Autophagy and modular restructuring of metabolism control germline tumor differentiation and proliferation in C. elegans. Autophagy. 2016;12(3):529–46. doi: 10.1080/15548627.2015.1136771. [DOI] [PMC free article] [PubMed] [Google Scholar]
- 16.Liu L, Wu Y, Huang X. Orientin protects myocardial cells against hypoxia-reoxygenation injury through induction of autophagy. Eur J Pharmacol. 2016;776:90–98. doi: 10.1016/j.ejphar.2016.02.037. [DOI] [PubMed] [Google Scholar]
- 17.Gao YH, Qian JY, Chen ZW, et al. Suppression of Bim by microRNA-19a may protect cardiomyocytes against hypoxia-induced cell death via autophagy activation. Toxicol Lett. 2016;257:72–83. doi: 10.1016/j.toxlet.2016.05.019. [DOI] [PubMed] [Google Scholar]
- 18.Jiang X, Overholtzer M, Thompson CB. Autophagy in cellular metabolism and cancer. J Clin Invest. 2015;125(1):47–54. doi: 10.1172/JCI73942. [DOI] [PMC free article] [PubMed] [Google Scholar]
- 19.Yang Y, Li W, Sun Y, et al. Amino acid deprivation disrupts barrier function and induces protective autophagy in intestinal porcine epithelial cells. Amino Acids. 2015;47(10):2177–84. doi: 10.1007/s00726-014-1844-6. [DOI] [PubMed] [Google Scholar]
- 20.Fang Y, Tan J, Zhang Q. Signaling pathways and mechanisms of hypoxia-induced autophagy in the animal cells. Cell Biol Int. 2015;39(8):891–98. doi: 10.1002/cbin.10463. [DOI] [PubMed] [Google Scholar]
- 21.Tang B, Li Q, Zhao XH, et al. Shiga toxins induce autophagic cell death in intestinal epithelial cells via the endoplasmic reticulum stress pathway. Autophagy. 2015;11(2):344–54. doi: 10.1080/15548627.2015.1023682. [DOI] [PMC free article] [PubMed] [Google Scholar]
- 22.Anding AL, Baehrecke EH. Autophagy in cell life and cell death. Curr Top Dev Biol. 2015;114:67–91. doi: 10.1016/bs.ctdb.2015.07.012. [DOI] [PubMed] [Google Scholar]
- 23.Li ZL, Lerman LO. Impaired myocardial autophagy linked to energy metabolism disorders. Autophagy. 2012;8(6):992–94. doi: 10.4161/auto.20285. [DOI] [PMC free article] [PubMed] [Google Scholar]
- 24.Jiang M, Liu K, Luo J, Dong Z. Autophagy is a renoprotective mechanism during in vitro hypoxia and in vivo ischemia-reperfusion injury. Am J Pathol. 2010;176(3):1181–92. doi: 10.2353/ajpath.2010.090594. [DOI] [PMC free article] [PubMed] [Google Scholar]
- 25.Band M, Joel A, Hernandez A, Avivi A. Hypoxia-induced BNIP3 expression and mitophagy: In vivo comparison of the rat and the hypoxia-tolerant mole rat, Spalax ehrenbergi. FASEB J. 2009;23(7):2327–35. doi: 10.1096/fj.08-122978. [DOI] [PubMed] [Google Scholar]
- 26.Tasca CI, Dal-Cim T, Cimarosti H. In vitro oxygen-glucose deprivation to study ischemic cell death. Methods Mol Biol. 2015;1254:197–210. doi: 10.1007/978-1-4939-2152-2_15. [DOI] [PubMed] [Google Scholar]
- 27.Yang Z, Zhao TZ, Zou YJ, et al. Hypoxia Induces autophagic cell death through hypoxia-inducible factor 1alpha in microglia. PLoS One. 2014;9(5):e96509. doi: 10.1371/journal.pone.0096509. [DOI] [PMC free article] [PubMed] [Google Scholar]
- 28.Zhao Y, Chen G, Zhang W, et al. Autophagy regulates hypoxia-induced osteoclastogenesis through the HIF-1alpha/BNIP3 signaling pathway. J Cell Physiol. 2012;227(2):639–48. doi: 10.1002/jcp.22768. [DOI] [PubMed] [Google Scholar]
- 29.Nakashima A, Yamanaka-Tatematsu M, Fujita N, et al. Impaired autophagy by soluble endoglin, under physiological hypoxia in early pregnant period, is involved in poor placentation in preeclampsia. Autophagy. 2013;9(3):303–16. doi: 10.4161/auto.22927. [DOI] [PMC free article] [PubMed] [Google Scholar]
- 30.Yu TM, Wen MC, Li CY, et al. Expression of hypoxia-inducible factor-1α (HIF-1α) in infiltrating inflammatory cells is associated with chronic allograft dysfunction and predicts long-term graft survival. Nephrol Dial Transplant. 2013;28(3):659–70. doi: 10.1093/ndt/gfs377. [DOI] [PubMed] [Google Scholar]
- 31.Masoud GN, Li W. HIF-1α pathway: Role, regulation and intervention for cancer therapy. Acta Pharm Sin B. 2015;5(5):378–89. doi: 10.1016/j.apsb.2015.05.007. [DOI] [PMC free article] [PubMed] [Google Scholar]
- 32.Nanayakkara G, Alasmari A, Mouli S, et al. Cardioprotective HIF-1α-frataxin signaling against ischemia-reperfusion injury. Am J Physiol Heart Circ Physiol. 2015;309(5):H867–79. doi: 10.1152/ajpheart.00875.2014. [DOI] [PubMed] [Google Scholar]
- 33.Li L, Yin X, Ma N, et al. Desferrioxamine regulates HIF-1 alpha expression in neonatal rat brain after hypoxia-ischemia. Am J Transl Res. 2014;6(4):377–83. [PMC free article] [PubMed] [Google Scholar]
- 34.Li A, Sun X, Ni Y, et al. HIF-1α involves in neuronal apoptosis after traumatic brain injury in adult rats. J Mol Neurosci. 2013;51(3):1052–62. doi: 10.1007/s12031-013-0084-7. [DOI] [PubMed] [Google Scholar]
- 35.Yin R, Yuan L, Ping L, Hu L. Neonatal bronchopulmonary dysplasia increases neuronal apoptosis in the hippocampus through the HIF-1α and p53 pathways. Respir Physiol Neurobiol. 2016;220:81–87. doi: 10.1016/j.resp.2015.09.011. [DOI] [PubMed] [Google Scholar]
- 36.Li W, Chen YQ, Shen YB, et al. HIF-1α knockdown by miRNA decreases survivin expression and inhibits A549 cell growth in vitro and in vivo. Int J Mol Med. 2013;32(2):371–80. doi: 10.3892/ijmm.2013.1405. [DOI] [PMC free article] [PubMed] [Google Scholar]
- 37.DeGracia DJ, Rudolph J, Roberts GG, et al. Convergence of stress granules and protein aggregates in hippocampal cornu ammonis 1 at later reperfusion following global brain ischemia. Neuroscience. 2007;146(2):562–72. doi: 10.1016/j.neuroscience.2007.01.050. [DOI] [PMC free article] [PubMed] [Google Scholar]
- 38.Heck MV, Azizov M, Stehning T, et al. Dysregulated expression of lipid storage and membrane dynamics factors in Tia1 knockout mouse nervous tissue. Neurogenetics. 2014;15(2):135–44. doi: 10.1007/s10048-014-0397-x. [DOI] [PMC free article] [PubMed] [Google Scholar]
- 39.Wong VC, Morse JL, Zhitkovich A. p53 activation by Ni(II) is a HIF-1α independent response causing caspases 9/3-mediated apoptosis in human lung cells. Toxicol Appl Pharmacol. 2013;269(3):233–39. doi: 10.1016/j.taap.2013.03.023. [DOI] [PMC free article] [PubMed] [Google Scholar]
- 40.McClain DA, Abuelgasim KA, Nouraie M, et al. Decreased serum glucose and glycosylated hemoglobin levels in patients with Chuvash polycythemia: A role for HIF in glucose metabolism. J Mol Med (Berl) 2013;91(1):59–67. doi: 10.1007/s00109-012-0961-5. [DOI] [PMC free article] [PubMed] [Google Scholar]
- 41.Suh HN, Lee YJ, Kim MO, et al. Glucosamine-induced Sp1 O-GlcNAcylation ameliorates hypoxia-induced SGLT dysfunction in primary cultured renal proximal tubule cells. J Cell Physiol. 2014;229(10):1557–68. doi: 10.1002/jcp.24599. [DOI] [PubMed] [Google Scholar]


