

Summary
Direct lineage conversion offers a new strategy for tissue regeneration and disease modeling. Despite recent success in directly reprogramming fibroblasts into various cell types, the precise changes that occur as fibroblasts progressively convert to target cell fates remain unclear. The inherent heterogeneity and asynchronous nature of the reprogramming process renders it difficult to study using bulk genomic techniques. Here, to overcome this limitation, we applied single-cell RNA-seq to analyze global transcriptome changes at early stages of induced cardiomyocyte (iCM) reprogramming1–4. Using unsupervised dimensionality reduction and clustering algorithms, we identified molecularly distinct subpopulations of cells along reprogramming. We also constructed routes of iCM formation, and delineated the relationship between cell proliferation and iCM induction. Further analysis of global gene expression changes during reprogramming revealed an unexpected down-regulation of factors involved in mRNA processing and splicing. Detailed functional analysis of the top candidate splicing factor Ptbp1 revealed that it is a critical barrier to the acquisition of CM-specific splicing patterns in fibroblasts. Concomitantly, Ptbp1 depletion promoted cardiac transcriptome acquisition and increased iCM reprogramming efficiency. Additional quantitative analysis of our dataset revealed a strong correlation between the expression of each reprogramming factor and the progress of individual cells through the reprogramming process, and led to the discovery of novel surface markers for enrichment of iCMs. In summary, our single cell transcriptomics approaches enabled us to reconstruct the reprogramming trajectory and to uncover heretofore unrecognized intermediate cell populations, gene pathways and regulators involved in iCM induction.
Direct cardiac reprogramming that converts scar-forming fibroblasts to iCMs holds promise as a novel approach to replenish lost CMs in diseased hearts1–4. Considerable efforts have been made to improve the efficiency and unravel the underlying mechanism5–15. However, it still remains unknown how conversion of fibroblast to myocyte is achieved without following the conventional CM specification and differentiation. This is partly due to the fact that the starting fibroblasts exhibit largely uncharacterized molecular heterogeneity, and the reprogramming population contains fully-, partially- and unconverted cells. Traditional population-based genome-wide approaches are incapable of resolving such unsynchronized cell-fate-switching process. Therefore, we leveraged the power of single cell transcriptomics to better investigate the Mef2c (M), Gata4 (G) and Tbx5 (T)-mediated iCM reprogramming.
Previous studies indicate that a snapshot of an unsynchronized biological process can capture cells at different stages of the process16. Because emergence of iCMs occurs as early as day 31,11–15, we reasoned that day 3 reprogramming fibroblasts contain a wide spectrum of cells transitioning from fibroblast to iCM fate. We therefore performed single-cell RNA-seq on day 3 M+G+T-infected cardiac fibroblasts (CFs) from 7 independent experiments (design see Extended Data Fig. 1) followed by a series of quality control steps (Methods, Extended Data Fig. 1, Supplementary Table 1-2). Extensive data normalization was performed to correct for technical variations and batch effects (Methods, Extended Data Fig. 1–2). After comparing the entire set of single-cell RNA-seq data to bulk RNA-seq data of endogenous CFs and CMs obtained from parallel experiments, we detected a group of resident or circulating immune or immune-like cells (Extended Data Fig. 3) that were not included in following analyses.
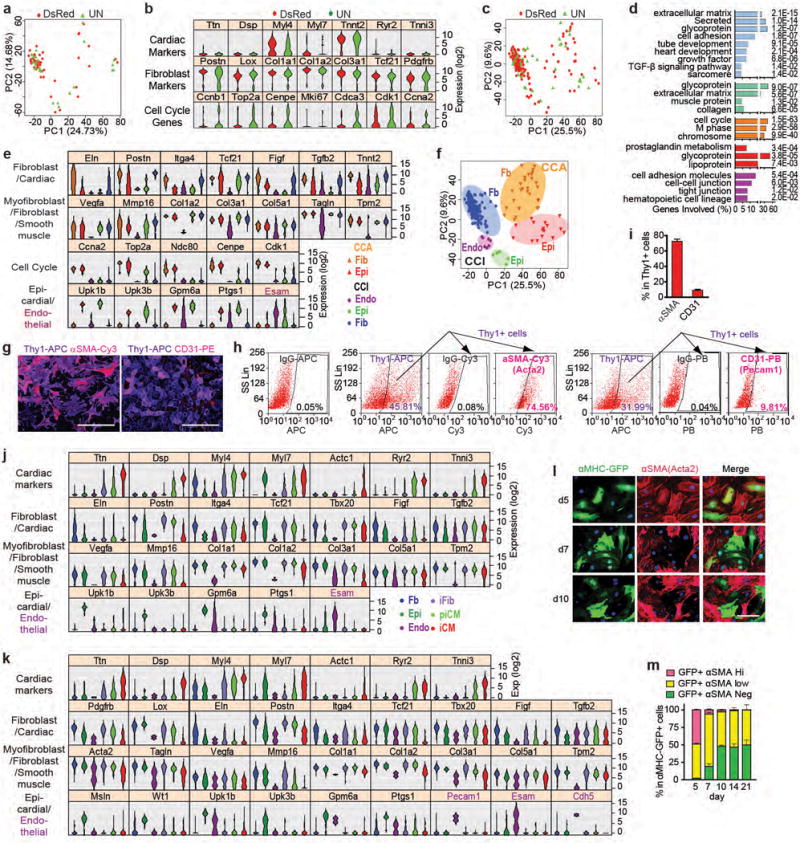
Unsupervised Hierarchical Clustering (HC) and Principle Component Analysis (PCA) on the remaining 454 non-immune cells revealed three gene clusters that account for most variability in the data: CM-, fibroblast-, and cell cycle-related genes (Fig. 1a-b, Extended Data Fig. 4a-c). Based on the expression of cell cycle-related genes, the cells were grouped into cell cycle-active (CCA) and cell cycle-inactive (CCI) populations (Fig. 1a), which was confirmed by the cells’ molecular signature in their proliferation states (Extended Data Fig. 4d-g, Pro/NP, proliferating/non-proliferating). Within CCA and CCI, HC further identified 4 subpopulations based on differential expression of fibroblast vs myocyte genes: Fib, intermediate Fib (iFib), pre-iCM (piCM) and iCM (Fig. 1a). When plotted by PCA or t-distributed stochastic neighbor embedding (tSNE), a stepwise transcriptome shift from Fib to iFib to piCM to iCM was evident (Fig. 1c, Extended Data Fig. 4h-i). We also analyzed the reprogramming process as a continuous transition using SLICER17, an algorithm for inferring nonlinear cellular trajectories (Fig. 1d-e). The trajectory built by SLICER suggested that Fib, iFib, piCM, and iCM form a continuum on the bottom CCI path, representing an iCM reprogramming route. We further calculated pseudotime for each cell on the trajectory by defining a starting Fib cell and measuring the distance of each cell to the starting cell along reprogramming (Fig. 1e). We then examined the distribution of cells along pseudotime by plotting the “free energy” (Max[density] - density) of the trajectory and discovered a peak (lowest density) in piCM (Fig. 1f). These data suggest that piCM is an unstable cell state seeking to settle into a more stable state such as iCM, consistent with the PCA and HC analyses showing that piCMs express both CM and fibroblast markers as an intermediate cell type and our other experimental evidence (Fig. 1a-c, Extended Data Fig. 4j-o). To experimentally test the iCM route, we performed population-based gene expression profiling at reprogramming days 0, 3, 5, 7, 10 and 14 (Fig. 1g-h, Extended Data Fig. 4p-v). PCA constructed a pattern showing an oriented path along reprogramming (Fig. 1g, Extended Data Fig. 4p-s). Expression of the three main gene clusters selected from single cell data showed consistent changes in population data (Fig 1h, Extended Data Fig. 4t-v), supporting the SLICER trajectory.
Figure 1. Single-cell RNA-seq reconstructs iCM reprogramming and identifies intermediate cell populations.
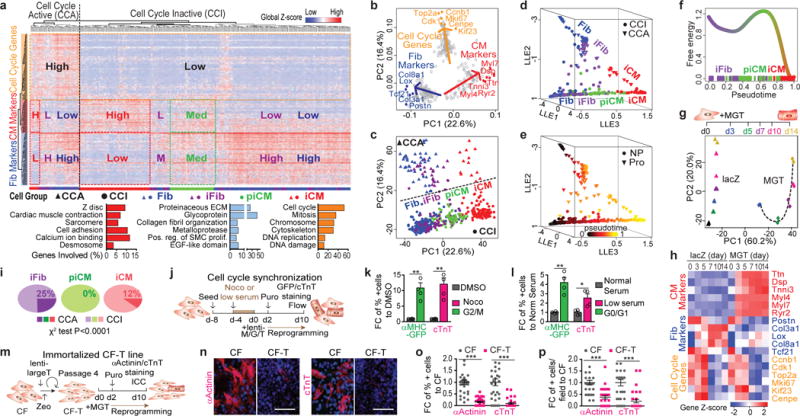
(a) HC results of 454 single CFs infected with M+G+T or mock- or DsRed- for 3 days with representative gene ontology (GO) terms of the three identified gene clusters below. (b-c) PCA showing representative genes (b) or cell groups (c). (d-e) 3D trajectory constructed by SLICER showing HC/PCA cell groups (d) or pseudotime (e). (f) Free energy of the reprogramming process. (g-h) Microarray of MGT- or LacZ-transduced CFs from day 0-14 plotted in PCA (g) or heatmap (h) showing average expression of representative genes in (a-b). (i) Comparison of CCA:CCI ratio in iFib, piCM, and iCM. (j-p) Cell cycle synchronization (j-l) or immortalization (m-p) of CFs for iCM induction (see Methods). Quantification of flow analysis shown in (k,l), n=4 samples. Representative 40× images of aActinin/cTnT with hoechst shown in (n) with quantification in (o,p). n=30 images, scale bar=100 μm, error bars indicate SEM, two-sided student’s t test: * p<0.05, ** p<0.01, *** p<0.001.
By analyzing CCA and CCI populations, we found that even though proliferative iCM (CCA iCM) was observed (Fig. 1a-d), iCM and piCM were predominantly CCI (Fig. 1i). We thus designed 4 sets of experiments to address the relationship between cell proliferation and iCM reprogramming by: 1) manipulating the expression of cell cycle-related genes on either lentiviral M/G/T-transduced fibroblasts (Extended Data Fig. 5a-p) or doxycycline (Dox)-inducible MGT-infected fibroblasts (Extended Data Fig. 5q-s); 2) synchronizing cell cycle of starting CFs (Fig. 1j-l); 3) transiently overexpressing large T antigen to accelerate CF proliferation (Extended Data Fig. 5t-z); 4) establishing an immortalized cardiac fibroblast line CF-T prior to initiation of iCM reprogramming (Fig. 1m-p). All four sets of experiments yielded congruent results that decreased proliferation or cell cycle synchronization enhanced iCM reprogramming while increased proliferation suppressed iCM generation.
We next examined the cellular composition of our isolated starting CFs (see methods) and identified five subpopulations (Fig. 2a-b, Extended Data Fig. 6a-i, Supplementary Discussion 1). To delineate how these subpopulations were reprogrammed, we applied HC calculated from the starting CFs to those transduced with M+G+T and determined the correlation of non-myocyte lineage markers expression to reprogramming (Fig. 2c). Expression of both endothelial and epicardial genes was significantly decreased in all cells transduced with M+G+T, irrespective of the reprogramming status. However, fibroblast and myofibroblast/smooth muscle genes were suppressed only in iCM but not in iFib or piCM (Fig. 2c, Extended Data Fig. 6j-k), supported by experimental data tracking protein expression of representative markers along reprogramming (Fig. 2d-f, Extended Data Fig. 6l-m). Thus we conclude that endothelial and epicardial genes can be readily suppressed, while fibroblast and myofibroblast/smooth muscle genes were gradually suppressed along reprogramming. This differential suppression is consistent with the distance among different cardiac cell lineages during development and suggests that the recent (epigenetic) memories might be easier to be erased than the ones gained further back. The progressive suppression of fibroblast markers also indicates a difference between iCM and iPSC reprogramming where early down-regulation of fibroblast markers such as Thy1 is one of the hallmarks and prerequisites for iPSC reprogramming to proceed18.
Figure 2. Heterogeneity of CF and stepwise suppression of non-cardiomyocyte lineages during iCM induction.
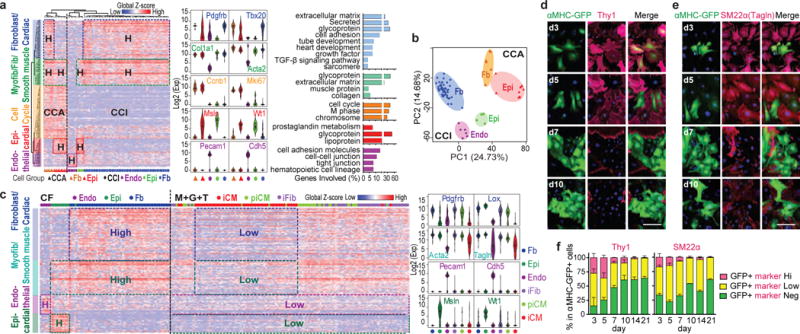
(a-b) HC (a) and PCA (b) of control CFs with representative gene expression and GO analysis of the five identified gene clusters. (c) HC calculated with control CFs (a) applied to M+G+T-transduced cells with representative gene expression. (d-f) 40× ICC images (d,e) with quantifications (f) of Thy1 and SM22α co-stained with αMHC-GFP during reprogramming. n=20 images, scale bar=100 μm, error bars indicate SEM.
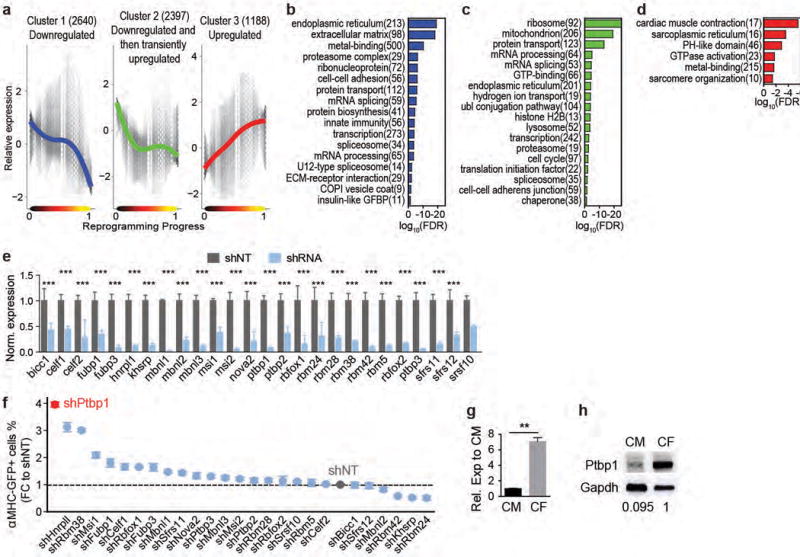
To understand the molecular cascades underlying iCM induction, we performed nonparametric regression and k-medoid clustering, and identified three major clusters of genes that are significantly related to and show similar trends over reprogramming (Extended Data Fig. 7a-d). Further analysis identified six smaller gene clusters with narrower variation over the trend and GO analyses were performed for each cluster (Fig. 3a-g, Supplementary Table 3, Supplementary Discussion 2). The largest Cluster 1 that shows a trend of immediate and continuous down-regulation of gene expression is enriched in GO terms related to protein translation/biosynthesis, modification and transportation (Fig. 3b). Such changes are probably to balance for increased energy requirements during the cell fate switch and/or to transit from a protein production and secretion factory (a fibroblast) to an energy-consuming power station (a CM). Cluster 2 downregulated genes are enriched in GO terms suggesting a late suppression of fibroblast genes and growth factors, while Cluster 4&5 upregulated genes are enriched in GO terms indicating engagement in metabolic shift and structural changes towards a CM fate (Fig. 3e-f).
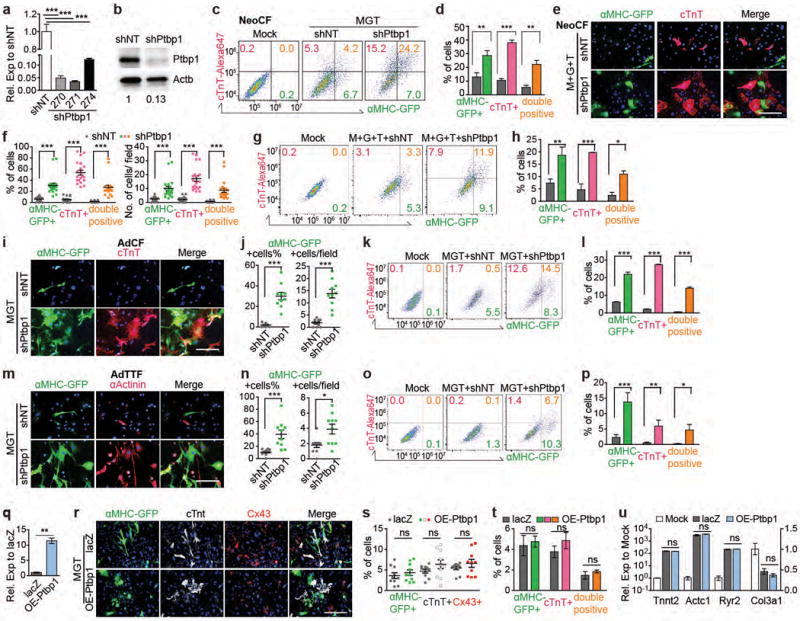
Figure 3. Identification of Ptbp1 as a barrier to iCM splicing repatterning.
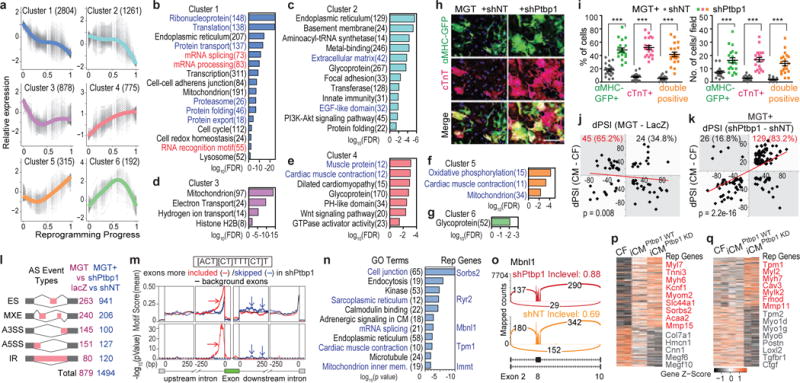
(a-g) Six gene clusters identified along reprogramming (a) with GO analysis (b-g, false discovery rate, FDR<0.05). Number of genes shown in parentheses. (h-i) 20× ICC images of cTnT and αMHC-GFP (h) with quantification (i) of MGT-infected CFs treated with shRNA against Ptbp1 (shPtbp1) or shRNA control (shNT). n=20 images, scale bar=200 μm, error bars indicate SEM, two-sided student’s t test: *** p<0.001. (j-q) Splicing analyses of d3 MGT-infected CFs treated with shPtbp1 or shNT. (j-k) Correlation between dPSI of CM vs CF, and dPSI of MGT vs lacZ (j) or MGT+shPtbp1 vs MGT+shNT (k). Trendline by linear regression and p from one-sided binomial test were shown. (l) Number of detected AS events among the five AS types. MEX: mutually exclusive exon. A3SS/A5SS: alternative 3′/5′ splicing site. IR: intron retention. (m) Positional distribution of a Ptbp1 binding motif (sequence shown in the black square). Dashed black line indicates p=0.05. (n-o) GO analysis of AS genes between MGT+shPtbp1 and MGT+shNT (n) with representative sashimi plot (o). (p-q) Expression of overlapping genes between DEG (MGT+shPtbp1 vs MGT+shNT) and DEG (MGT vs lacZ) (p) and shPtbp1-only DEGs (q).
Unexpectedly, we observed that Cluster 1 is also enriched in GO terms “mRNA splicing”, “mRNA processing” and “RNA recognition motif”. This finding prompted us to interrogate the role of splicing factor(s) in iCM induction. Thus we used icMEF line19 to screen a shRNA library that targeted 26 splicing factors representing the most common splicing factor families20 and identified Ptbp1 as the top candidate that also showed a differential expression in CFs versus CMs (Extended Data Fig. 7e-h). Importantly, knockdown of Ptbp1 in various primary fibroblasts consistently resulted in a significant increase in reprogramming efficiency (Fig. 3h-i and Extended Data Fig. 8a-p), demonstrating Ptbp1 as a general barrier to iCM induction. Overexpression of Ptbp1 yet has minimal effects (Extended Data Fig. 8q-u). To understand how Ptbp1 silencing led to improved iCM reprogramming, we performed high-depth RNA-seq to analyze alternative splicing (AS) events of day 3 reprogramming cells with or without Ptbp1. A total of 1494 AS events were detected upon Ptbp1 knockdown, 97% of which were not induced by MGT alone (Extended Data Fig. 9a, Supplementary Table 4-5). Importantly, calculation of the difference in percent spliced-in (dPSI) suggested that AS events between reprogramming vs control fibroblasts and endogenous CMs vs CFs were towards opposite direction (negative association, p=0.008). Knockdown of Ptbp1 in reprogramming fibroblasts, however, induced a strong positive association (p=2.2e-16), suggesting that Ptbp1 silencing together with MGT but not MGT alone shifted the splicing pattern from CF towards CM type (Fig. 3j-k). Furthermore, a much higher percentage of exon skipping (ES) events (63%) among the five known AS types was observed in MGT-infected cells upon Ptbp1 silencing (Fig. 3l). Motif analysis using rMAPS showed that a CT-rich Ptbp1 binding motif was significantly enriched in ES exons compared to background exons (Fib. 3m). Interestingly, for exons more included upon Ptbp1 knockdown, the motif was strongly enriched within 100 bp of the upstream intron (red arrows, p<1e-30); for exons more skipped upon Ptbp1 knockdown, the motif was less strongly enriched but showed a broad peak at 50-200 bp in the downstream intron (blue arrows, p<0.05). These data are consistent with the higher % of inclusion (69%) than skipping (31%) among ES events observed in Ptbp1 knockdown samples (Extended Data Fig. 9b), suggesting Ptbp1’s role as a repressor for exon inclusion when bound to upstream intron, and likely as a weaker activator for exon skipping when bound to downstream intron. Next we assessed the GO terms of genes alternatively spliced upon Ptbp1 silencing (Fig. 3n-o, Extended Data Fig. 9c-i). In addition to altering splicing patterns of genes related to CM lineage and function (Fig. 3n), Ptbp1 silencing resulted in splicing pattern changes of 21 other splicing factors, suggesting that Ptbp1 knockdown might trigger a second wave of splicing changes by regulating isoform switching of other splicing factors. To move one step further, we explored the potential downstream effects of Ptbp1-mediated splicing re-patterning (Supplementary Table 6, Supplementary Discussion 3). DESeq2 analyses of differentially expressed genes (DEG) revealed that Ptbp1 knockdown enhanced the MGT-induced CF to CM transcriptome shift by augmenting MGT-mediated changes (Fig. 3p, Extended Data Fig. 9j-n) and altering the expression of an additional set of cardiac and fibroblast lineage genes (Fig. 3q, Extended Data Fig. 9o).
To determine if cardiac reprogramming is a rare and random event or an M, G, T-determined process, we plotted the expression of M, G, and T and M+G+T in each cell against the reprogramming pseudotime of that cell calculated by SLICER (Fig. 4a, Extended Data Fig. 9p). We found that the expression levels of M, G, and T and M+G+T are highly correlated with the reprogramming progress, despite the fact that the expression of MGT was not used in building the trajectory. We also determined the average expression levels of M, G, and T and the average ratio of expression (M/G, M/T, and G/T) in the Fib, iFib, piCM, and iCM cell populations along the reprogramming trajectory (Extended Data Fig. 9q-s). Consistent with our previous studies6,14,21, we observed higher level of M than G and T in iCM, further underscoring the importance of high Mef2c expression in iCM induction.
Figure 4. M/G/T-determined iCM reprogramming and identification of novel surface markers.
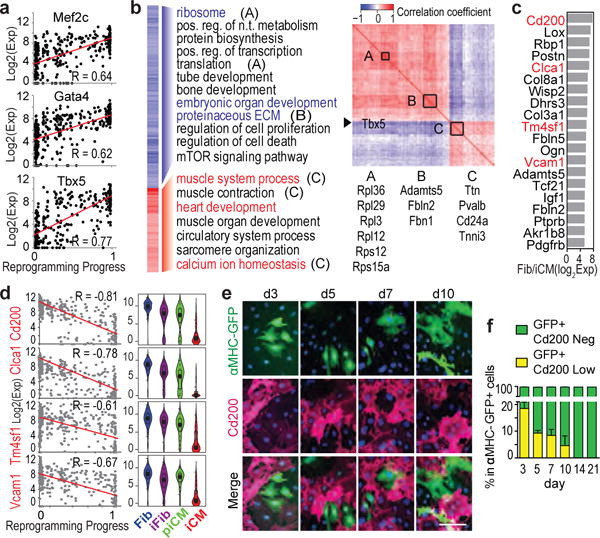
(a) Correlation between M/G/T expression and SLICER pseudotime. (b) Left: correlation between Tbx5 expression and its targets with GO analysis. Right: inter-correlation of genes on left. Three sets of co-expressed genes A, B, C were shown (p<2.6e-6). (c) Top 20 potential negative selection markers for iCM. (d) Correlation of the four surface marker (labeled in red in c) expression and reprogramming (left) and their expression in different cell groups (right violin plots). (e-f) 40× ICC images (e) with quantification (f) of Cd200 co-stained with αMHC-GFP along reprogramming. n=20 images, scale bar=100 μm, error bars indicate SEM, linear regression reports p<1e-41 (a), and p<1e-39 (d), α=0.05, two-sided.
To unravel the gene networks regulated by reprogramming factors, we navigated the relationship between the expression of a reprogramming factor and its downstream targets in each single cell. Using Tbx5 as an example, we calculated the Spearman correlation between Tbx5 expression and the expression of its downstream targets22,23 within each reprogramming cell (Fig. 4b left). Then we generated a correlation matrix for selected Tbx5 targets to determine their co-expression patterns (Fig. 4b right). The correlation patterns suggest Tbx5 acts through promoting cardiac function-related genes and suppressing protein biosynthesis and non-myocyte lineages (Fig 4b, Extended Data Fig. 9t-u).
Finally, we aimed to discover novel markers for targeting or enriching cell populations during iCM induction. To identify specific markers for each cell population along reprogramming trajectory, we selected genes that were expressed significantly higher (for positive selection marker) or lower (for negative selection marker) in the cell population of interest than the other three populations (Tukey-adjusted p-value < 0.05 in pairwise comparisons post ANOVA, Extended Data Fig. 10a-f, Supplementary Table 7). Negative selection markers for iCM appeared most attractive to supplement for cardiac positive selection markers. Among top 20 negative markers for iCM, we focused on four surface markers Cd200, Clca1, Tm4sf1, and Vcam1 (Fig. 4c). Linear regression suggests that their expression was highly anti-correlated with the reprogramming process, and was barely detectable in iCM (Fig. 4d). Further experimental validation confirmed Cd200 as a negative selection marker (Fig. 4e-f), and knocking down Cd200 didn’t affect reprogramming efficiency (Extended Data Fig. 10g-n).
We have used single cell transcriptomics analysis to gain insights into heterogeneity within an unsynchronized cardiac reprogramming system. The findings hold promise for improving the efficiency and detection of iCM formation. We also anticipate that the experimental and analytical methods presented here, when applied in additional cell programming or reprogramming contexts, will yield crucial insights about cell fate determination and the nature of cell type identity.
METHODS
Mouse strains and plasmids
Transgenic mice of CD1 background that contain αMHC promoter driven-GFP were described previously1. All animal experiments conformed to the NIH guidelines (Guide for the care and use of laboratory animals) and UNC Qian Lab animal protocol #15.277.0. This protocol was approved by the University of North Carolina at Chapel Hill Institutional Animal Care and Use Committee (IACUC) that oversees the university’s animal care and use (NIH/PHS Animal Welfare Assurance Number: A3410-0; USDA Animal Research Facility Registration Number: 55-R-0004; AAALAC Institutional Number: #329). pMXs retroviral vectors containing mouse Gata4, Mef2c, or Tbx5 were described previously1. The empty pMXs and pMXs-puro retroviral vectors were purchased from Cell Biolabs and they harbor a partial lacZ suffer sequence and were thereby referred to as lacZ in this manuscript. pMXs-DsRed and the polycistronic pMXs-puro-MGT were described previously14. pLenti-M/G/T were cloned by replacing the GFP insert in pLenti-GFP-Puro (Addgene #17448) with M, G, or T using BamHI and SalI. pTripZ-rTtA was cloned by removing the tet-on promoter and RFP in the pTripZ vector24 using XbaI and MluI followed by blunt-end ligation. pTripZ-iMGT was constructed by four steps. First, an intermediate plasmid pTripZ-iRFP was cloned to remove the Ubc promoter, rTtA and Puro sequences from the original pTripZ vector, which was achieved by replacing the sequences between MluI and Acc65I with PCR-amplified WPRE. Second, to introduce an AgeI site before Mef2c, the first ~600bp of Mef2c sequence before the BsrGI restriction site was PCR-amplified and cloned into pGEMT-easy (Promega), resulting in pGEMT-AgeI-Mef2c-BsrGI. Third, MGT was excised from pGEMT-MGT14 and inserted into pGEMT-AgeI-Mef2c-BsrGI with BsrGI and SalI, resulting in pGEMT-AgeI-MGT-MluI (there is a MluI site located in the pGEMT-easy vector after SalI). Last, pTripZ-iMGT was cloned by replacing RFP in pTripZ-iRFP with polycistronic MGT excised from the pGEMT vector using AgeI and MluI. For gene overexpression, Ptbp1, Cd200, and cell cycle-related genes (p15, p16, Ccnd1, Ccnd2, and Ccne1) were PCR amplified from neonatal mouse CF cDNA and cloned into the pLenti vector using BamHI and SalI (XbaI and SalI for Ptbp1 and Ccnd2, and BamHI and XhoI for Ccnd1). The control pLenti-lacZ vector was cloned by replacing the GFP insert in pLenti-GFP with the partial lacZ sequence from pMXs-puro using BamHI and SalI. Cloning primers were listed in the Supplementary Table 8. pBabe-Zeo-LargeT was purchased from Addgene (#1779). The non-targeting shNT pLKO.1-scramble plasmid was described previously24 and all other shRNAs (pLKO.1 vector based, MISSION shRNA glycerol stock) were purchased from Sigma and their TRC numbers were listed in the Supplementary Table 8.
Isolation of neonatal CF and CM, and generation of iCM
We chose to reprogram mouse neonatal CFs, which were used in the first1 and many of the follow-up cardiac reprogramming studies2–6,8,12,14–15,21,25. CFs were isolated using standard protocol as described previously21,25. Specifically, neonatal (day 1.5) hearts were isolated from αMHC-GFP+ pups and rinsed thoroughly with chilled phosphate buffer saline (PBS). The hearts were then minced by a razor blade, transferred to 8 ml warm 0.05% Trypsin-EDTA (Gibco), and incubated at 37 °C for 10 min. After 5 rounds of collagenase digestion (5 ml of warm 0.2% collagenase type II in HBSS for 3 min at 37 °C followed by vortexing for 1 min), a single cell suspension was obtained by passing through 40 μm cell strainers. The cells were then suspended in 1 ml of red cell lysis buffer (150 ml NH4Cl, 10 mM KHCO3, and 0.1 mM EDTA) for 1 min on ice and resuspended in magnetic-activated cell sorting buffer (MACS buffer: DPBS/0.5% BSA/2 mM EDTA). To sort Thy1+ cells, approximately 1 × 10⁷ cells were suspended in 90 μl MACS buffer with 10 μl Thy1.2 micro-beads (Miltenyi Biotec) at 4 °C for 30 min. The cells were then washed, suspended in MACS buffer and applied to equilibrated LS column (Miltenyi Biotec). Cells bound to beads were flushed out after two washes and seeded onto 0.1% gelatin-coated plates at 2.5 × 10⁴/cm2 in fibroblast media (IMDM/20% FBS/1 × Pen/Strep). After overnight culturing, media was replaced to remove unattached cells. We refer to the MACS-isolated Thy1+ adherent non-myocytes as neonatal CFs. For bulk RNA-seq experiments, neonatal CFs were similarly isolated except that MACS-isolated Thy1+ cells were directly lysed in TRIzol (Life Technology) without culturing. Neonatal CMs were isolated using the neonatal cardiomyocytes isolation system (Worthington Biochemical Corporation) except that all enzymes were used at a ¼ of the recommended concentration to increase cell viability. After a 1.5 hour pre-plating on uncoated surface to remove attached nonmyocytes, the unattached CMs were collected in TRIzol (> 80% viability by Trypan blue staining).
For iCM generation, pMXs retroviruses were packaged by transfecting platE cells (Cell Biolabs) with lipofectamine 2000 (Life Technology) as previously described14. Viruses collected from one 10 cm dish were resuspended in 100 μl iCM media (10% FBS in DMEM/M199 (4:1)) and added to cells at 5 μl of each virus (if co-transduction)/cm2 of surface area. All transduction was performed in iCM media containing 4 μg/ml of polybrene. For single-cell RNA-seq, CFs were untransduced, transduced with 1: 2 ratio of pMXs-DsRed: pMXs (lacZ), or transduced with equal amount of M, G, T viruses. For microarray experiments, CFs were transduced with the control pMXs-puro (lacZ) or the pMXs-puro-MGT viruses and collected in TRIzol. Day 5, 7, 10 and 14 samples were selected with 2 μg/ml puromycin from day 3 and maintained in 1 μg/ml puromycin from day 6. Day 0 samples were overnight cultured CFs that were collected immediately before viral transduction. For bulk RNA-seq, CFs were transduced with pMXs-puro (lacZ), pMXs-puro-MGT, pMXs-puro-MGT+shNT, or pMXs-puro-MGT+shPtbp1-271 for three days and then collected in TRIzol. All microarray and bulk RNA-seq samples were duplicated.
Capture of single cells, RNA spike-ins, and preparation of cDNA
Single cells were captured using the Fluidigm C1 system (up to 96 single cells/plate). A total of seven individual experiments (E1-E7) were performed starting from mouse breeding, CF isolation, iCM reprogramming, to single cell capture and cDNA preparation (see Extended Data Fig. 1 for experimental design and workflow). Three out of the seven experiments (expt) (E1, E2, and E4) contained only M+G+T-transduced cells. Four out of the seven experiments (E3 and E5-E7) contained cells treated with two different conditions in order to estimate the relative abundance of mouse mRNA between treatments. Specifically, for expt E1, E2, and E4, CFs transduced with M+G+T for 3 days were collected by trypsinization, stained with 7AAD or NearIR live/dead dye (Thermo Fisher Scientific), and FACS-sorted for live cells (negative for the live/dead dye). Pilot experiments showed an average diameter of 12.6 μm and a buoyancy of 7.5 (cells): 2.5 (buoyancy buffer) of CFs. Therefore, the sorted single cell suspension (~2000 cells μl−1) was loaded on a medium-sized (10-17 μm) microfluidic RNA-seq chip (C1 Single-Cell mRNA Seq IFC, cat # 100-6041, initially designed chips used in E1-E3 and redesigned chips used in E4-E7) and single cells were captured with the C1 system. Bright field images were taken for each capture site. For expt E3 and E5-E7, day 3 M+G+T-transduced (E5&E6) or untransduced (E3&E7) CFs were stained with the NearIR live/dead dye and 0.25 - 1 μM Carboxyfluorescein succinimidyl ester (CFSE, Thermo Fisher Scientific), and the DsRed-transduced CF were stained with the NearIR dye only. Then 12,000 CFSE+NearIR− green fluorescent cells and 12,000 DsRed+NearIR− red fluorescent cells were sequentially FACS-sorted into the same tube and mixed. For experiment E3, cell sorting was slightly different that 700 of each of CFSE single positive cells (untransduced), DsRed single positive cells (DsRed-transduced), and double negative cells (from the DsRed-transduced wells but no DsRed protein expression) were sorted into a single cell suspension. After cell capture, fluorescent images of GFP and RFP channels as well as bright field pictures were taken.
Next, control RNA spike-ins were added into lysis Mix A (see Fluidigm’s protocol), which were then loaded onto the IFC plate before cell lysis. Expt E1 and E2 used the Ambion Array Control spike-ins (AM1780) that were included in the SMARTer kit. E1 used only spike 1, 4, and 7 according to Fluidigm’s protocol but at a concentration that is 100 fold higher than suggested, based on recommendations from UNC Advanced Analytics Core (AAC) that provided the Fluidigm service. E2 used all 8 spike-ins contained in the kit at the following working concentrations (before addition to lysis Mix A): 10 pg/μl of spike 1, 1 pg/μl of spike 2, and 10 fold lower for the next spike and so on. For E3, we used the Ambion spike-ins at a half concentration of those used in E2 and another spike-in, the External RNA Controls Consortium (ERCC) RNA spike-in Mix 1 (Ambion, Life Technologies) after an 80,000-fold dilution. For E4-E7, only the ERCC spike-in was used after a 40,000-fold dilution and 1 μl of the diluted working spike-in was mixed with 19 μl of other components to make lysis Mix A. Then cell lysis, reverse transcription, and cDNA pre-amplification were performed on the chip according to Fluidigm’s standard protocol and the control RNA spike-ins were processed in parallel with cellular RNA. Differences in spike-ins added to each experiment reflected how the technology evolved over time during the progress of this project. To address the spike-ins issue, among others, we developed a pipeline described below in the “Processing and normalization of single-cell RNA-seq data” section to normalize and analyze all acquired useful data.
Illumina library preparation and sequencing
After in situ cDNA library preparation, the bright field and fluorescent images of each capture site (“nest”) on the chip were carefully examined. Forty-six empty nests, 30 nests with two or more cells, and 22 nests containing morphologically unhealthy cells out of 672 capture sites on seven chips were excluded for further analysis, resulting in 574 single-cell cDNA libraries. The size distribution and quality of cDNA libraries from each single cell were ensured by bioanalyzer. For E3 only, cDNA library concentrations were measured with picogreen (Thermo Fisher Scientific) and four single-cell cDNA libraries below 1 ng/μl were excluded from further analysis. E1-E4 each contained a negative control from an empty nest that was processed in parallel with other healthy single cells. Therefore a total of 574 high-quality cDNA libraries were submitted to the UNC High Throughput Sequencing Facility (HTSF). Illumina libraries were prepared using the Nextera XT DNA Sample Preparation kit according to Fluidigm’s standard protocol except with 13 cycles of amplification. The barcoded single-cell Illumina libraries of each experiment were pooled and sequenced for 50 base pairs (bp) single-end reads on Illumina HiSeq 2500. Illumina library preparation and sequencing were carried out in three batches: E1 by itself on two lanes, E2 and E3 processed together on one lane each, and E4-E7 processed together on one lane each. Previous studies showed that 0.5-1 million reads per cell were sufficient to detect most genes expressed by single cells26,27. In this study, we sequenced the cells at about 1-5 × 10⁶ reads per cell. Raw reads were re-assigned to each single cell by their unique Nextera barcode and sequencing reads removed of barcodes were received from HTSF in .fastq format.
For microarray and bulk RNA-seq samples, cellular RNA was extracted from TRIzol (microarray samples were further purified with the RNAeasy kit from Qiagen), and only samples with RNA integrity number (RIN) above 8 determined by bioanalyzer were further processed. Microarray samples were submitted to HTSF for one color Cy-dye labeling and long oligo (60 mer) Agilent high density microarrays. Bulk RNA-seq samples were prepared with the TruSeq Stranded mRNA Library Prep Kit (Illumina). The barcoded Illumina libraries were pooled and submitted to HTSF for sequencing. About 6 × 10⁷ 100 bp paired-end reads/sample were obtained and sequencing reads removed of Illumina indexes were received from HTSF in .fastq format.
Processing and normalization of single-cell RNA-seq data
The quality of sequencing results was first checked by FASTQC. Reads are in high-quality and no trimming was required. The raw reads were then mapped to the merged genome of mm10, ERCC, and E.coli K12 with Tophat2 using default settings. Information about the number of total reads and the percentages of reads mapped to spike-in or mouse genome for each single cell were detailed in the Supplementary Table 1. Outliers showing high ratios of % reads mapped to spike-in to % reads mapped to mouse genome were removed (Extended Data Fig. 1d). This step removed 61 outliers from the 574 sequenced single cells, resulting in 513 high-quality single cells for analysis (Supplementary Table 2). Gene expression was counted with Htseq-count using the union mode28 (http://www-huber.embl.de/users/anders/HTSeq).
Limit of detection of our single-cell RNA-seq was determined as previously described26. Briefly, the concentration of each ERCC spike-in in the lysis chamber was first calculated. For expt E3, seven of the spike-ins were presented at 1.24 molecules per chamber and are as follows: ERCC-00014, ERCC-00028, ERCC-00039, ERCC-00067, ERCC-00077, ERCC-00143, and ERCC-00150. For expt E4-E7, five of the spike-ins were present at 1.24 molecules per chamber and are as follows: ERCC-00031, ERCC-00033, ERCC-00058, ERCC-00069, and ERCC-00134. The number of non-zero measurements of each spike-in was then counted. This number divided by the total number of high quality cells from that plate is the probability of detection for each spike-in at this concentration. Average probability of detection of all 12 spike-ins is 0.30, consistent with previous findings26 and suggesting single-molecule sensitivity of our experiments.
We developed a three-step normalization strategy in order to extract biological meaningful information from all the single-cell RNA-seq data (Extended Data Figure 1c). Firstly, we normalized mouse gene raw counts to each cell’s technical and biological size factors within each experiment using a previously described method29. These two size factors account for technical variations within each experiment such as amplification efficiency and differences in the amount of biological starting material in each cell. Based on the normalized DsRed counts, cells in experiments that involved two treatments were classified as DsRed-transduced (E3R, E5R, E6R, and E7R, expressing high levels of DsRed), or M+G+T-transduced (E5M, E6M)/untransduced cells (E3U, E7U, Extended Data Fig. 1g).
Secondly, we corrected for “batch effects” that accounts for technical contributions to expt-to-expt variations due to different cell-capture efficiency, types/amounts of spike-ins and Fluidigm chips (Extended Data Fig. 1b), while preserving biological information such as total mRNA abundance. By comparing among biological replicate experiments, we found different mean total mRNA counts/cell (Extended Data Fig. 1h) that likely resulted from varying cell-capture efficiency/plate (68 sequenced cells in E5, 33% more compared to 51 cells in E6, Supplementary Table 2), various amounts of spike-ins used (100 fold more concentrated spike-ins in E1 than E2) and different types of spike-ins and Fluidigm chips used (Fluidigm spike-in and previous chip in E2 and ERCC spike-in and redesigned chip in E4), suggesting the existence of “batch effects”. To determine whether different treatments affected mouse mRNA abundance in the cell, we also examined mean total mRNA reads from different treatments in the same experiment (Extended Data Fig. 1h). We found no difference in average total mRNA counts between uninfected and DsRed-transduced cells (E3U vs E3R and E7U vs E7R) but 40% less counts in cells undergoing reprogramming (M+G+T-transduced, E5M, E6M) than DsRed-transduced cells (E5R, E6R), suggesting biological variations caused by treatment. Thus, to retain mRNA abundance information while correcting for batch effects, we normalized each treatment in each experiment to an expt size factor so that the median mRNA counts equals 1,000,000 for uninfected and DsRed-transduced cells and 616136 (deduced from the average M:R ratio of E5 and E6) for M+G+T-transduced cells (Extended Data Fig. 1h). This normalization successfully removed batch effects discussed above. An example was shown in Extended Data Fig. 1i for a comparison of cells from E5 and E6 on a PCA plot.
Lastly, we focused on nonimmune cells (462 cells in total, see Extended Data Fig. 3 for details) and removed residual batch effects using ComBat, a method that was designed for normalizing gene expression data30 and performed well in previous studies31. By examination of all experiments in each treatment condition with PCA plots (Extended Data Fig. 2a-c, the “Before” columns), we found no batch effects in PC1/PC2 plot but started to see incomplete overlap of different experiments in PC3 (for uninfected) or PC4 (for M+G+T- and DsRed-transduced), which represented < 5% variance of the data. Because batch effects were observed between different chips but not the same chips, we postulated that the use of two different versions of the Fluidigm medium-size chips might be the cause. The ComBat normalization was run separately for each treatment to remove only technical variations between batches while preserve biological variations between treatments. ComBat requires all input genes to be expressed in all batches, i.e. at least one cell in each batch. Therefore, genes that have non-zero counts in all batches were selected and normalized for each treatment. After the normalization, results from different treatments were merged. For those genes that were selected in one treatment but not others, expression levels were set to 0 in other treatment(s). After this procedure, there were a total of 14414 genes left. PCA analyses with ComBat-normalized counts showed that no batch effects we detected in the top 20 PCs (the “After” columns in Extended Data Fig. 2a-c for PC1-4, and data not shown), suggesting successful removal of all residual batch effects in our data.
Analysis of single-cell RNA-seq data
Outlier detection, PCA, HC, and the generation of violin plots were performed with the “SINGuLAR Analysis Toolset” package (Fluidigm) in R. First, normalized expression was log2 transformed before analysis. Outliers were detected and removed based on average gene expression and PCA using the SINGuLAR package (Extended Data Fig. 2d-e), resulting in 454 high-quality nonimmune cells for downstream analysis. Expression of the reprogramming factors M, G, and T was excluded before PCA, HC, or SLICER (see the next session) analysis. Next, top 400 PCA genes were selected by largest weight (loading) contribution to principle component 1, 2, or 3. Then HC was performed with these 400 genes and cells were grouped (Fig. 1a). The group information was used to generate PCA plots (Fig. 1b-c), violin plots (Extended Data Fig. 4b, l) and to perform analysis of variance (ANOVA, Fig. 4c, d, Extended Data Fig. 10a-e). ANOVA and Tukey post-hoc test were performed with custom scripts in R in order to identify positive or negative selection markers for iCM and piCM. For ANOVA, CCI but not CCA cells were used. For violin plots in Fig. 2 and 4, box plots were overlaid on top of them. The center dot represents median gene expression and the central rectangle spans the first quartile to the third quartile of the data distribution. The “whiskers” above or below the box show the locations of 1.5 interquartile range above the third quartile or below the first quartile. tSNE analysis was performed with the “Rtsne” package in R. GO analysis was performed using the DAVID functional annotation tool version 6.7 (https://david.ncifcrf.gov/). All GO terms shown in this study have p value or corrected p value (FDR) < 0.05. Abbreviation of GO terms: Fig. 1a, pos. reg. of SMC prolif. (positive regulation of smooth muscle cell proliferation); Fig. 3n, Cell. Resp. to DNA damage (cellular response to DNA damage), Mitochondrion inner mem. (mitochondrion inner membrane); Fig. 4b, pos. reg. of n.t. metabolism (positive regulation of nucleotide metabolism), pos. reg. of transcription (positive regulation of transcription). For the comparison of distributions of number of detected genes in different cell groups, we conducted the one-sided two-sample Kolmogorov-Smirnov test (Extended Data Fig. 4n-o). Since we are comparing the distributions of two samples, the conclusion is more general than a mean test such as t-test and does not rely on restrictive statistical assumptions such as normal distributions.
In Fig. 2a-c, cells from expt E1-E3 were presented. Analysis of data from expt E4-E7 showed consistent results (Extended Data Fig. 6e, f, and k). For Fig. 2c, first, CCI and CCA cells in Fb/Epi (Fig. 2a-b) were merged into one Fb/Epi group. Then a new HC for control cells in E3 was calculated using the four cell-lineage-related gene clusters but not the cell cycle genes identified in Fig. 2a. The calculated HC was very similar to that in Fig. 2a and was applied to reprogramming cells from E1 and E2 to generate Fig. 2c. For all correlation analyses, gene expression was always log transformed before analysis. In Fig. 4a, d, and Extended Data Fig. 9p, CCI cells were used. Linear regression was performed to obtain the regression coefficient (R value) and its corresponding p value (two-sided, α = 0.05). For correlation analysis of Tbx5 and its target genes in Fig. 4b, M+G+T-transduced CCI cells were included. The list of Tbx5 ChIP-seq peaks in HL-1 and the list of genes differentially expressed in wild type versus Tbx5 null mutant mice hearts were obtained from previous studies22–23. Genes present in both lists (2109 genes) were selected as Tbx5 downstream targets and used to calculate Fig. 4b. A total of 170 genes with spearman correlation coefficient > 0.3 or < −0.3 were selected and their correlation coefficient with Tbx5 was plotted in Fig. 4b left panel. Then inter-correlation between these genes was calculated and the correlation matrix ordered by HC was shown as a heatmap in Fig. 4b right panel. Three sets of genes A, B, C were found to be co-expressed (p<2.6e-6 by Spearman correlation). Representative genes of them were listed in the right panel and their corresponding GO terms were labeled on the left (Fig. 4b). For correlation analysis of M, G, T expression and expression of transcription factors or splicing factors, M+G+T-transduced CCI cells were presented in Extended Data Fig. 9t-u. The list of mouse transcription factors was obtained from public databases as previously described12 and the list of splicing factors was obtained from a previous study32.
Trajectory construction and identification of genes related to iCM reprogramming
We used SLICER (Selective Locally linear Inference of Cellular Expression Relationships)17, an algorithm that we previously developed, to construct cellular trajectories of iCM reprogramming. SLICER is implemented as an R package, which is freely available on the Comprehensive R Archive Network (CRAN) and on GitHub (https://github.com/jw156605/slicer). Briefly, SLICER discovers a nonlinear, low-dimensional manifold embedded in gene expression space that indicates how cellular gene expression profiles change during a sequential process. Additionally, SLICER automatically detects the presence, location, and number of branches in a trajectory, corresponding to multiple cell fates or multiple cellular processes occurring simultaneously. In this paper, the manifold corresponds to the reprogramming process by which fibroblasts turn into iCMs. To ensure consistency between the clustering and trajectory analyses, we ran SLICER on the control and reprogramming CFs using the top 400 PCA genes, rather than using SLICER’s gene selection approach. We performed nonlinear dimensionality reduction using a technique called local linear embedding (LLE), which is analogous to a nonlinear version of PCA. For this paper, we used a three-dimensional LLE projection for trajectory construction. We then build a k-nearest neighbor graph in the low-dimensional manifold space produced by LLE. Shortest paths through the neighbor graph correspond to geodesics along the manifold, and we use the lengths of these shortest paths to order cells according to their distances from a user-defined starting cell. The steps of the reprogramming process can then be traced by examining the cells one-by-one in the specified ordering. We also investigated the distribution of cells along pseudotime, reasoning that local differences in density could indicate the relative speed of changes and stability of intermediate states. We estimated the density of cells in pseudotime using a Gaussian kernel density estimator, then calculated “free energy” as max(density-density). NP M+G+T-transduced cells were used for free energy calculation (Fig. 1f).
Using a method similar to that described in Trapnell et al.33, we used nonlinear regression to identify genes significantly related to the reprogramming process. Only NP cells were included for this analysis. For each gene with mean expression above 1, we fit a generalized additive model (GAM) of the Tobit family (VGAM R package). The GAM approach uses cubic splines to fit a smooth nonlinear model, and the Tobit likelihood accounts for zero inflation by modeling gene expression dropout as data censoring. To avoid overfitting the data, which would result in a curve that is too “wiggly”, we constrained the GAM fits to use three degrees of freedom. We then identified genes that are significantly related to the reprogramming process using a likelihood ratio test, with a constant GAM as the null model. Using k-medoid clustering (pam algorithm from the cluster R package), we identified clusters of significantly related genes that showed similar trends over the reprogramming process (Fig. 3a and Extended Data Fig. 7a).
Analysis of bulk RNA-seq and microarray data
Bulk RNA-seq data were analyzed similarly as the single cell data except that they were only normalized for sequencing depth. Specifically, raw counts from HTseq-count were divided by the total number of mm10 mRNA reads from that sample and then multiplied by 1×10⁶ to give counts per million (CPM). For differential expression analysis of lacZ vs MGT samples and MGT+shNT vs MGT+shPtbp1 samples, raw counts were inputted into DESeq234 in R and lists of DEG were obtained (FDR < 0.05, fold change > 1.25). Heatmaps were generated using the heatmap.2 function in the “gplots” package in R. The microarray data were processed using the limma package from Bioconductor35. Raw data were first background corrected and normalized using “normexp” and “quantile” methods, respectively. Next, control probes and low intensity probes were filtered out using the 1.1 multiplier of 95% quantile for negative controls as a cutoff. Lastly, probe intensity data were log2 transformed and replicated probes for each gene were averaged for subsequent analyses. PCA were performed in R with the “prcomp” function using all of the 34378 detected genes and the 3d plot was generated with the “scatterplot3d” package in R (Extended Data Fig. 4p-q).
Analysis of splicing
We aligned the bulk RNA-seq data (100-bp, paired-end reads) to mm10 using Mapsplice 2.1.4. To detect alternative splicing, we used rMATS36 version 3.2.5 with Ensembl GRCm38.82 gene annotations and the novelSS (novel splicing site) flag to identify unannotated splicing events. All other rMATS parameters were set to the default values. In Fig. 3j-l, n-o, and Extended Data Fig. 9a-i, we used FDR < 0.05 and dPSI > 15 as cutoffs, resulting in 1494 AS events for MGT+shPtbp1 vs MGT+shNT and 879 AS events for MGT vs lacZ (see Supplementary Table 4-5 for the lists). In Fig. 3j-k, to determine whether the direction (sign) of PSI change is consistent between two group pairs, we identified the overlapping AS events between the samples (69 overlapping events between MGT vs lacZ and CM vs CF, and 155 events between MGT+shPtbp1 vs MGT+shNT and CM vs CF). We then conducted a binomial test by first transforming the paired dPSI data into either +1 or −1 based on if their signs agree or not, and then calculating the proportion of +1s and compare it with 50% using one-sided binomial test. The results for dPSI (CM-CF) vs (MGT-lacZ) showed that only 34.78% of times the signs in these two groups agree with each other (p=0.0077). Therefore we conclude that there’s enough statistical evidence to support that the directions (signs) in CM-CF and MGT-lacZ are different. The result for CM-CF vs shPtbp1-shNT shows that 83.22% of times the signs in two groups are the same (p=2.2e-16). Therefore we conclude that there is enough statistical evidence to support that the directions (signs) in CM-CF and shPtbp1-shNT are the same. To plot the positional distribution of Ptbp1 binding motifs, we used rMAPS37 version 1.0.5. The rMAPS tool can only be used for ES events and has a database of known binding motifs for RNA binding proteins, including Ptbp1. It considers ES events with FDR < 0.05 and dPSI > 5 as statistically significant and all others insignificant. Then it takes all ES events (both significant and insignificant) and uses the events that are not significant to create a background profile. We basically extracted the exon skipping events from the rMATS comparison of MGT+shPtbp1 vs MGT+shNT and ran rMAPS on this list to generate Fig. 3m.
Proliferation assays
Lentiviruses were packaged by transfecting 293T cells with lipofectamine 2000 as previously described12. For packaging shRNA viruses, a total of 10 μg plasmids consisting of equivalent concentrations of each of the four or five shRNA targeting different regions of the gene were used. Lentiviral M, G, T, iMGT and large T were added to cells at 5 μl of each virus (if co-transduction)/cm2 of surface area and all other lentiviruses (rTtA, lacZ, cell-cycle related genes, and shRNA) were used at 2.5 μl each/cm2. For Extended Data Fig. 5b-m, pMXs-puro-MGT were used for iCM induction. In the EdU incorporation assay, cells were pulsed with 10 μM of EdU for three days before staining with Alexa Fluor 647 labelled EdU in the Click-iT Plus Edu Alexa Fluor™ 647 Flow Cytometry Assay Kit (ThermoFisher Scientific, #C10634). Propidium iodide (PI, Life Technologies, #P3566) staining was performed as previously described19. For iMGT induction, doxycycline (Dox) was added at 1 μg/ml and changed every 2-4 days. Puromycin (Puro) selection was performed at 1 μg/ml and media were changed every 2-4 days. For cell cycle synchronization assay, CFs were treated with 400 ng/ml of Nocodazole (G2/M) or cultured in low serum condition (0.5% FBS, G0/G1) for 4 days before iCM induction; normal serum condition was 10% FBS. To generate CF-T cells, neonatal CFs were transduced with pBabe-largeT and selected by 600 ng/ml Zeocin in fibroblast medium (IMDM/20% FBS/1 × Pen/Strep) from day 2 for 2 weeks. The resulting CF-Ts were a relatively homogenous pool of cells after antibiotic selection. All data are representative of multiple repeated experiments.
shRNA library screen, immunofluorescence staining, flow cytometry and qRT-PCR
For screening of shRNA library targeting splicing factors, MGT expression was induced by 1 μg/ml doxycycline in icMEF cells19 and lentiviruses containing mixed clones of shRNAs targeting each gene were added to the cells at 5 μl/cm2. For Ptbp1 protein expression, western blotting was performed as previously described14 (anti-Ptbp1, Cell Signaling 8776, 1: 500 dilution). Adult CF (AdCF) and tail-tip fibroblast (AdTTF) were isolated by the explant method as previously described15. The clone 271 was used for all shPtbp1-related experiments except for the initial screen while mixed clones of shCd200 viruses were used for shCd200-related experiments. Information of shRNAs were listed in the Supplementary Table 8.
Immunofluorescence staining and flow cytometry were performed as previously described12. Primary antibodies were used at the following dilutions: rabbit anti-GFP (Invitrogen, A11122, 1:500), chicken anti-GFP (Abcam, ab13970, 1:1500), anti-αSMA (Sigma, A2547, 1:200), anti-SM22α (Abcam, ab14106, 1:200), anti-αActinin (Sigma, A7811, 1:500), anti-Cx43 (Sigma, C6219, 1:200), APC-Thy1.2 (ebioscience, 17-0902-81, 1:100) and APC-Cd200 (Biolegend, 123809, 1:200). Images were captured using EVOS® FL Auto Cell Imaging System (Life Technologies). All images shown in this study were overlaid with hochest nuclear staining except for live images. For quantification, 10-30 images from multiple repeated experiments were randomly taken under 10×, 20 × or 40 × magnifications at the same exposure setting and then counted in a blinded way. For Extended Data Fig. 6g-i, neonatal hearts were minced into small pieces and plated with fibroblast medium (the explant method14). After 7 days of migration, the adherent cells were either immunostained in situ (cy3-αSMA, Sigma, C6198, 1:500 dilution; APC-Thy1.1, ebioscience, 17-0900-82, 1:100 dilution; PE-CD31, Biolegend, 102408, 1:200 dilution), or trypsinized, filtered through 40 μm cell strainers (Thermo Scientific), immunostained for Thy1.2 and αSMA/CD31, and then analyzed by flow cytometry. All flow data were collected on a Beckman Coulter Cyan ADP flow cytometer (UNC Flow Cytometry Core Facility) and analyzed with the FlowJo software (Tree Star). qRT-PCR was performed as previously described12 (see Supplementary Table 8 for primer sequences). All data are representative of multiple repeated experiments.
Statistics
Unless otherwise stated, values are expressed as average ± standard deviation (SD) or standard mean of error (SEM) of multiple biologically independent samples. Statistical tests performed include student’s t test, one way ANOVA followed by post hoc correction, linear regression, Spearman correlation, Kolmogorov-Smirnov test, binomial test, likelihood ratio test, and Chi-square test. Application and results of these tests were described in details in METHODS and figure legends. Generally, a p value of < 0.05 was considered statistically significant (*), a p value of < 0.01 was considered highly significant (**), and a p value of < 0.001 was considered strongly significant (***). All data are representative of multiple repeated experiments.
Data availability
The RNA-sequencing data that support the findings of this study are available in GEO under the accession number GSE98571. Source data for all figures are available in the supplementary tables.
Extended Data
Extended Data Figure 1. Experimental design, analysis pipeline, quality control and normalization for single-cell RNA-seq.

(a) Experimental workflow. Hearts were isolated from P1.5 neonatal mice and cells were dissociated by enzymatic digestion. Thy1+ cells were then purified by MACS and plated overnight. The adherent cells (CF) were then transduced with retroviruses encoding the reprogramming factors M, G, and T or DsRed, or left untransduced (Mock). On day 3 post transduction, cells were trypsinized and live/dead stained. Additionally, for some experiments designed to examine the relative mouse RNA abundance in cells receiving different treatment, Mock/M+G+T cells were labeled with a green cell tracker CFSE, FACS-sorted for live cells, and then mixed at a designated ratio with FACS-sorted live DsRed+ cells from a parallel DsRed transduction. The single cell suspension was loaded onto a medium size chip (10-17 μm) and single cells were captured on a Fluidigm C1 machine. Brightfield and for some experiments, fluorescent images, were taken for all capture sites. Individual cDNA libraries for each cell were prepared in situ by RT with pre-amplification after adding RNA spike-in. Brightfield and/or fluorescent images for each capture site were examined and libraries from nests with 0 or multiple cells were excluded from downstream analysis. Illumina libraries were then prepared for each cell, pooled, quality-checked and sequenced on Hiseq 2500. (b) Design of the seven independent single-cell RNA-seq experiments including treatment, RNA spike-ins, and Fluidigm chips used. (c) Data analysis pipeline. Barcodes were trimmed off from RNA-seq raw reads and the quality of these reads was confirmed with fastqc. High quality reads were mapped to the mm10 genome with Tophat2 and counted with Htseq-count. Outliers were removed as described in (d). The raw counts were normalized first to technical and biological size factors within each experiment using DEseq and then to expt size factors calculated based on relative mouse mRNA abundance in cells receiving different treatments (h). Residual batch effects between experiments receiving the same treatment were removed using ComBat. Cell grouping and modeling were then performed using the normalized gene counts with PCA, HC, SLICER and more. The most important three quality control steps were labeled in red in (a) and (c). The above strict quality control criteria ensured that only high-quality and biologically meaningful data from healthy single cells were analyzed. (d) For each of the seven single cell experiments, percentage of reads mapped to spike-in in each cell was plotted against percentage of reads mapped to mouse genome (left panel) or mouse mRNA (right panel) in that cell. Cells outside of the red circles were outliers. (e) For each of the five single cell experiments that contained ERCC spike-in, average count numbers of each ERCC spike-in was plotted against their concentration in the lysis mix A (see Fluidigm’s protocol for details). Linear regression coefficients (R value) and their corresponding p values (two-sided, α=0.05) are shown. The results showed a dynamic range (~105) of ERCC concentration that covers the full spectrum of mouse gene expression levels. The high R values indicate strong correlation between hypothetical molecular concentrations and measured gene counts in our experiments. (f) Squared coefficients of variation (CV2) were plotted against average expression of ERCC spike-ins (left) or mouse genes (right) for experiments containing ERCC spikein. (g) DsRed counts in expt E3 and E4-E7 plotted against Mef2c counts and/or total mouse mRNA counts after normalization to technical and biological size factors within each experiment (Methods). Cells in in the four experiments were classified as DsRed-transduced (E3R, E5R, E6R, E7R), M+G+T-transduced (E5M, E6M), or untransduced cells (E3U, E7U) based on these plots. (h-i) Normalization to experiment size factors to account for technical contributions to expt-to-expt variations such as varied capture efficiency while retain biological variations such as differences in total mRNA abundance in cells receiving different treatments. (h) Median total mouse mRNA counts were calculated for each treatment in each experiment and average mRNA counts were compared between different treatments in one experiment (E3, E4-E7) with two-sided student’s t test (α=0.05). Experiment size factors were calculated based on the ratio of median mRNA counts between different treatments. After normalization to the expt size factors, the median mRNA count equals to 1,000,000 for uninfected and DsRed-transduced cells and 616136 for M+G+T-transduction. (i) PCA of two biological replicates E5 and E6 that have different sequencing depth/cell due to different capture efficiencies before (left) and after (right) normalization to experiment size factors. Top 400 PCA genes were used.
Extended Data Figure 2. Normalization and outlier removal of single-cell RNA-seq data (continued).
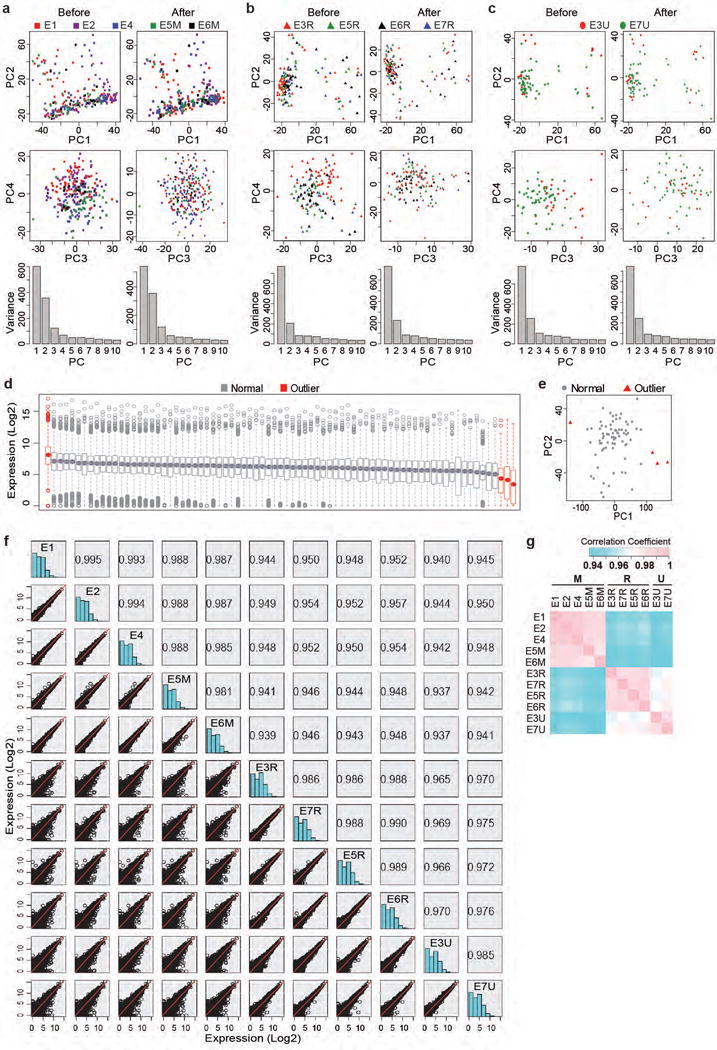
(a-c) Removal of batch effects using ComBat on non-immune (described in Extended Data Fig. 3) cells. PCA of all batches of M+G+T-transduced (a), DsRed-transduced (b) or uninfected (c) cells before (left panel) and after (right panel) ComBat normalization. (d-g) After ComBat normalization, outliers in each treatment group were further removed by examination of the average gene expression level of each cell (box plot, d) and PCA (e). Uninfected cells were shown as an example. A total of 454 healthy non-immune cells were left and further analyzed. (f) Pairwise comparison of average mouse gene expression between different experiments and treatment conditions. Correlation coefficient calculated by linear regression was shown. (g) Heatmap colored by correlation coefficient in (f). Strongest correlation was seen within each treatment group. DsRed-infected and uninfected cells also showed strong inter-treatment correlation. M+G+T-transduced cells showed relatively low correlation with DsRed-transduced and uninfected cells.
Extended Data Figure 3. Single cell analysis identified a sub-population of immune-like cells.
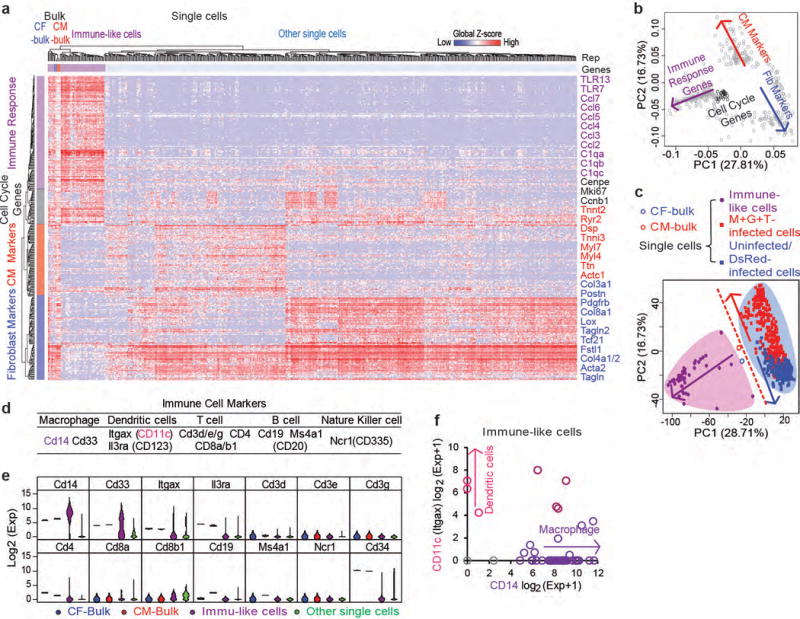
Data from 513 control or reprogramming CF single cells and bulk RNA-seq data of neonatal CFs and CMs were analyzed with PCA. To identify groups of related cells and genes, top 400 genes with highest loadings in the first three principal components were then analyzed by unsupervised HC (a) and PCA (b, c). Representative genes in each of the four gene clusters identified by HC were listed to the right of HC heatmap. Interestingly, in addition to CM, fibroblast, and cell cycle genes, immune response genes were identified as the other major gene cluster. (b) PCA loading plot showing four major gene clusters. (c) PCA score plot. Both HC and PCA results showed that bulk CF and CM data were very close in distance and both of them were clustered together with single cells expressing high levels of immune genes. (d) Table of markers for major immune cell lineages. (e) Violin plots for the expression of major immune cell lineage markers in bulk CFs, bulk CMs, immune-like single cells, and other single cells. (f) Expression of the macrophage marker Cd14 and the dendritic cell marker Cd11c in each immune-like cell showed that 42 cells express macrophage markers and 3 express dendritic cell markers, with 4 cells expressing both. These data suggest that the immune-like cells are likely cardiac resident immune cells38 which also express CF marker such as Thy1. Although follow-up work to delineate the potential of these immune cells to be reprogrammed into iCMs will be of great interest, it is not the focus of this study. Therefore, for all following analyses on single cell data, we focused on the non-immune CFs.
Extended Data Figure 4. Cell grouping, representative gene expression, and genes detected in single-cell RNA-seq data and population-based gene expression profiling along reprogramming.
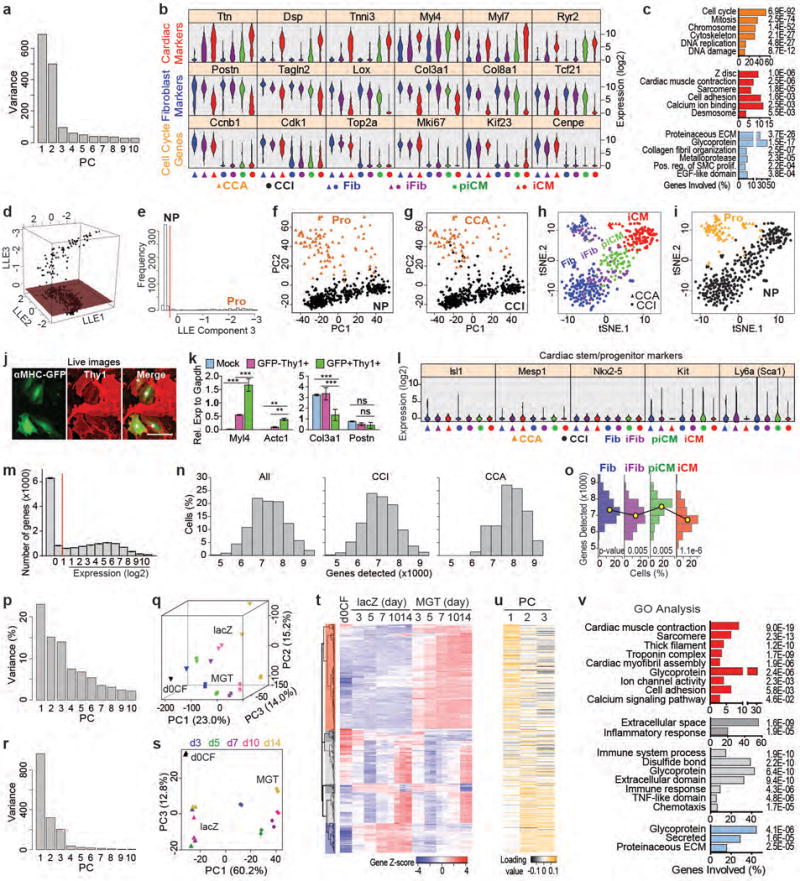
Related to Fig. 1a-h. (a) PCA scree plot showing variance of top 10 PCs. Related to Fig. 1a-c. (b) Violin plots showing the expression levels of representative cardiac, fibroblast and cell cycle genes in the 7 cell groups identified by HC and PCA (Fig. 1 a-c). (c) Fig. 1a GO analysis with p values of each presented GO term. (d-g) Determination of the proliferation status of each single cell using genes periodically expressed in cell cycle that were identified in a previous report39. (d) 3D LLE plot. (e) Frequency of cells on LLE component 3. The dark red plane in (d) and the red dotted line in (e) indicate the threshold for proliferating (Pro) and nonproliferating (NP) cells. (f-g) PCA plots as in Fig. 1c but color- and shape-coded by Pro and NP (f) or CCA and CCI (g). (h-i) tSNE plots of all single cells color- and shape-coded by HC/PCA cell groups (h) or Pro/NP cell groups (i). The cells that were grouped as iFib, piCM, or iCM constituted 30.6% (77/252), 24.6% (62/252), and 44.8% (113/252) of all cells transduced with M+G+T, respectively. In contrast to previous population- and marker-based studies, our single-cell RNA-seq data suggests that the fate conversion from fibroblast to iCM occurs rapidly (~ 3 days) with nearly 45% of the CF cells exhibiting transcriptomic signatures indicative of a cardiac fate. (j) Live fluorescent images of day 5 MGT-transduced CFs showing co-expression of αMHC-GFP and Thy1 (surface labeling). Double positive cells were labeled with *. All under 40×. Scale bar = 100 μm. (k) αMHC-GFP+Thy1+ and αMHC-GFP-Thy1+ cells were FACS-sorted from day 7 MGT-transduced CFs and expression of representative cardiac (Myl4/Actc1) and fibroblast (Col3a1/Postn) markers were determined by qRT-PCR. Day 7 mock-transduced cells were included as control. Average ± SD were shown. n = 4 samples. One-way ANOVA followed by Bonferroni correction (two-sided): ** p<0.01, *** p<0.001, ns, lack of enough evidence for significance. Myl4 and Actc1 expression increased 80-100 fold and reached approximately the same level as Gapdh in αMHC-GFP+/Thy1+ cells compared to mock transduction. Expression level of the fibroblast marker Postn was maintained at a high level in GFP+Thy1+ cells. For another fibroblast marker Col3a1, even though its relative expression in GFP+Thy1+ cells was decreased compared to Mock-transduced and GFP-Thy1+ cells, but its absolute expression was still high by comparing to Gapdh (~1.4 fold of Gapdh). The data strongly support the existence of CM- and fibroblast-marker double-positive piCM and suggest that piCM represents an intermediate cell population transitioning from iFib to iCM or locked between iFib and iCM during reprogramming. (l) To determine if iCMs may be differentiated from rare cardiac stem/progenitor cells, we plotted the expression of cardiac stem/progenitor markers in each of the HC/PCA single cell groups using violin plots. All of these markers were nearly undetectable in Fib, iFib, piCM and iCM, suggesting direct conversion from CF to iCM without going through a stem/progenitor stage. (m) Distribution of gene expression levels in single cells. Average ± SEM were shown. n = 454 cells. Limit of gene detection was set to 1 based on this plot. (n) Distribution of number of genes detected in all, CCI or CCA single cells. Comparison of the distributions in CCI and CCA cells with two-sample Kolmogorov-Smirnov test resulted in a one-sided p-value of 5.248e-11, suggesting that the number of genes in CCI is significantly smaller than that of CCA. Based on this result, only CCI cells were used in (o). (o) Distribution of number of genes detected in each CCI cell group shown by histogram. One-sided two-sample Kolmogorov-Smirnov test (p values: 0.00521 for iFib vs Fib, 0.00481 for piCM vs iFib, and 1.104e-6 for iCM vs piCM) suggests that the number of genes expressed decreased when the cells adopted the iCM fate. This observation demonstrates a dynamic re-patterning of transcription machinery during reprogramming and is consistent with HC analysis and experimental evidences that piCMs co-expressed both cardiac and fibroblast markers, further indicating that piCM constitutes an intermediate population during iCM reprogramming. (p-v) Population-based gene expression profiling of reprogramming CFs at day 0, 3, 5, 7, 10, and 14. (p-q) Results from PCA analysis using all genes were similar to those using top 400 genes (r-v). (p) Scree plot of top 10 PCs. (q) 3D PCA score plot. (r-v) Analyses with top 400 PCA genes. Related to Fig. 1 g-h. (r) Scree plot of top 10 PCs. (s) PCA score plot using PC1 and PC3. (t) HC identified four major gene clusters: gradually upregulated along reprogramming (Red, mainly cardiac genes), downregulated in MGT-transduced compared to lacZ-transduced (blue, mainly ECM genes), and gradually upregulated (light grey)/downregulated (dark grey) in both lacZ and MGT cells (culture or viral effects, mainly ECM and immune response genes). The results were consistent with the expression of representative genes selected from single cell data (Fig. 1h) showing gradually increased expression of CM markers along reprogramming, first increased and then decreased expression of cell cycle genes in both MGT and lacZ cells, and significantly lower fibroblast markers in MGT compared to lacZ cells at each time point. (u) Heatmap showing the loading of the genes in (t) on PC1, 2 and 3. Upregulated (cardiac) genes are highly weighted in PC1, and the other three gene clusters are highly weighted in PC2 and PC3. The results are consistent with Fig. 1g and (s). (v) GO analysis of the four gene clusters in (t) showing GO terms and their corresponding p-values (listed on the right).
Extended Data Figure 5. Inhibition of cell proliferation or cell cycle synchronization promotes iCM reprogramming.
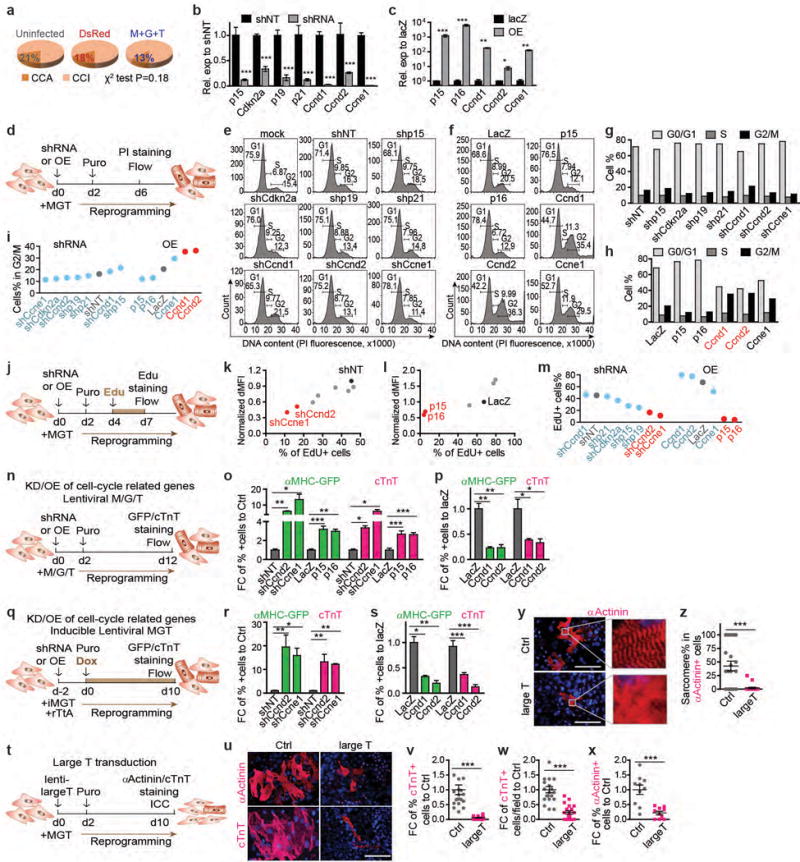
Related to Fig. 1i-p. (a) Comparison of the ratio of CCA: CCI cells in the three treatment groups: uninfected, DsRed-infected, and M+G+T-infected. Chi-square test suggests that proliferation states were not significantly different among the treatment groups at day 3. (b, c) Knockdown (KD) efficiency of shRNAs (b) or overexpression (OE) levels (c) of cell cycle-related genes were determined by qRT-PCR on day 4 lentiviral transduced cells. shNT, non-targeting control shRNA. Average ± SD was shown. n = 3 samples. (d-i) Cell cycle staging of CF cells simultaneously transduced with reprogramming factors and shRNA (e, g) or OE (f, h) constructs by PI staining. (e-f) Flow cytometry histogram of PI staining intensity. (g-i) Percentages of cells in G0/G1, S, or G2/M phases were calculated based on (e) and (f). (i) Summary of (g) and (h). (j-m) Measurement of DNA synthesis in CF cells simultaneously transduced with reprogramming factors and shRNA (k) or OE (l) constructs by EdU incorporation assay followed by flow cytometry. dMFI: delta median EdU fluorescence intensity between EdU+ cells and EdU− cells. (m) Summary of (k) and (l). Constructs that dramatically decreased or increased cell proliferation were labeled in red in (g-i) and (k-m) and were used for experiments in (n-s). (n-s) The impact of manipulation of cell proliferation through KD/OE of cell cycle-related genes on iCM reprogramming. Reprogramming factors were introduced by lentiviral vectors instead of retroviral vectors to avoid retroviral infection bias of proliferating cells. CF were simultaneously transduced with lentiviral M/G/T (n-p) or inducible MGT (iMGT, q-s) and lentiviral KD/OE constructs that dramatically decreased (o, r) or increased (p, s) cell proliferation. Percentages of αMHC-GFP+ and cTnT+ cells were quantified by flow cytometry. (t-z) The impact of large T transduction on iCM reprogramming. CFs were simultaneously transduced with reprogramming factors and lentiviral large T. After 10 days, αActinin+/cTnT+ cells were immunostained, imaged, and quantified by counting randomly selected 20× fields from multiple repeated experiments (u-x). Both percentages of positive cells per field (v, x) and numbers of + cells per field (w) were quantified. Percentages of cells showing sarcomere structure in αActinin+ cells were also quantified (y-z). The percentage of αActinin+ cells that show sarcomere structures decreased from 50% to 0% upon large T transduction and accelerated proliferation. (u, y) Representative images under 40× with hoechst nuclear staining. Scale bar = 100 μm. (o-z) Average ± SEM was shown. (o-s) n = 4 samples. (v, w, z) n = 20 images. (x) n = 10 images. (b, c, w-z) Two-sided student’s t test. (o-s) One-way ANOVA followed by Bonferroni correction (two-sided). Significance: * p<0.05, ** p<0.01, *** p<0.001.
Extended Data Figure 6. Heterogeneity of our isolated CFs (Thy1+ non-immune non-myocyte cardiac cells) and stepwise suppression of non-cardiomyocyte lineages during iCM reprogramming.
Related to Fig. 2. (a-c) Limited transcriptome change by retrovirus transduction. To determine whether introduction of viruses could influence cellular identities of CF, molecular features of the uninfected and DsRed-transduced cells were compared and only 25 genes were differentially expressed (ANOVA p value < 0.05), many of which related to immune response (data not shown), suggesting that uninfected and viral-infected CFs shared very similar gene expression profiles. (a) PCA of the control cells from expt E3 as shown in Fig. 2b but color-coded by treatment. The results showed that uninfected and DsRed-transduced cells were indistinguishable by PCA, suggesting limited global transcriptome changes by retroviral transduction. (b) Violin plots showing the expression of representative CM, fibroblast, and cell cycle genes in uninfected- and DsRed-transduced CF. Retroviral transduction does not affect the expression of these genes. (c) Same as (a) but with all control CF from expt E3, E5R, E6R, and E7. Based on results from (a-c), we concluded that retroviral transduction does not influence cellular identities of CF and therefore we analyzed control CFs containing both uninfected and DsRed-transduced cells together in Fig. 2a-b. (d) Fig. 2a GO analysis showing p values of each presented GO terms. (e) Violin plots showing the expression of additional non-myocyte lineage markers in CF. Related to Fig. 2a. (f) PCA analysis of control CF from all four expts (E3, E5R, E6R, and E7) with cells color-coded by non-myocyte lineage groups. Related to Fig. 2b. (g) Immunostaining of Thy1 and αSMA, or Thy1 and CD31 in day 7 explant CF culture. Images taken at 20×. Scale bar = 200 μm. (h-i) Representative flow cytometry plots (h) and quantification (i) of αSMA+ and CD31+ cells in Thy1+ cells. There were 72.6% αSMA+ and 9% Cd31+ CFs, consistent with the single-cell RNA-seq data in Fig. 2a showing a high percentage of cells expressing myofibroblast/smooth muscle markers and a low percentage of cells expressing endothelial markers. Average ± SD was shown. (j) Violin plots showing the expression levels of additional lineage markers. Related to figure 2c. (k) Same as (j) but using cells from expt E4-E7. These experiments were performed using the redesigned Fludigm medium chip as a repeat of expt E1-E3 (Fig. 2c), which used the original Fludigm medium chip. (l-m) Tracking of protein expression of a myofibroblast/smooth muscle cell marker αSMA by co-staining with αMHC-GFP in CF cells under reprogramming for 5, 7, 10, 14, and 21 days. (l) Representative images under 40× with hoechst nuclear staining. Scale bar = 100 μm. (m) Quantification of αMHC-GFP+ αSMA-high/low/neg cells. Average ± SEM was shown. The results showed that as reprogramming proceeded, protein expression of Thy1, SM22α (Fig. 2d-f), and αSMA in αMHC-GFP-positive cells decreased over time, with no Thy1-/SM22α-/αSMA-high cells and ~50-60% of Thy1-/SM22α-/αSMA-negative cells on day 21 of reprogramming.
Extended Data Figure 7. Identification of regulatory pathways involved in iCM reprogramming and screening of a shRNA library against major splicing factors during iCM induction.
(a-d) Three clusters of genes that significantly related to and showed similar trends over the reprogramming process were identified by nonlinear regression (see Methods). Number of genes included in each cluster is shown in parentheses. The solid line in each plot shows the overall trend of the cluster, and the grey color indicates the 2D density of gene trends passing through each region of the plot. (b-d) GO analysis of genes in the three clusters showing GO terms with FDR < 0.05. (e, f) Screening against a shRNA library of splicing factors for key regulators of iCM reprogramming. icMEF was induced by Dox to express MGT and at the same time transduced with lentiviruses encoding shRNA targeting various splicing factors. On day 3 post transduction, knockdown efficiency was determined by qRT-PCR (e, n=6 samples from 2 independent experiments) and αMHC-GFP+ cells were quantified by flow (f, n=3 samples, data representative of three independent experiments). Average ± SD was shown. Knocking down of Ptbp1 led to the highest fold increase in percentage of aMHC-GFP+ cells compared to shNT. (g, h) Ptbp1 expression in freshly isolated CF and CM was determined by qRT-PCR (g, average ± SEM, n=8 samples from two independent experiments) or Western blotting (h). (e, g) Two-sided student’s t test. Significance: ** p<0.01, *** p<0.001.
Extended Data Figure 8. Manipulation of Ptbp1 through loss- and gain-of-function during iCM reprogramming.
(a, b) Ptbp1 knock-down efficiency of different shRNA clones in d3 transduced MEF determined by qRT-PCR (a, average ± SEM, data representative of three independent experiments) or western blotting (b). shPtbp1-271 showed the highest knock-down efficiency (>97%) and was used for following experiments. (c-u) Ptbp1 was knocked-down (shPtbp1, c-p) or overexpressed (lentiviral OE-Ptbp1, q-u) in neoCF (c-h, q-u), AdCF (i-l), or AdTTF (m-p) when iCM reprogramming was induced by MGT (except in e-h, M+G+T was used as a further confirmation). After 10 days (14 days for OE-Ptbp1), expression of cardiac markers was determined by immunostaining followed by imaging and blinded quantification (e, f, i, j, m, n, r, s) or flow (c, d, g, h, k, l, o, p, t). (e, i, m, r) Representative 20× images with hoechst nuclear staining. Scale bar = 200 μm. (f, j, n, s) n = 10-20 images. Average ± SEM was shown. (c, g, k, o) Representative flow plots. Percentages of cells were shown. (d, h. l, p, t) Quantification of triplicated flow data. Average ± SD was shown. (q) Ptbp1 overexpression was verified by qRT-PCR (average ± SD). (u) Expression levels of representative cardiac (left axis, Tnnt2, Actc1 and Ryr2) and fibroblast (right axis, Col3a1) markers were determined by qRT-PCR (average ± SD). Mock: untransduced CF. Where appropriate, two-sided student’s t test or one-way ANOVA followed by Bonferroni correction (two-sided) was performed. Significance: * p<0.05, ** p<0.01, *** p<0.001, ns, lack of enough evidence for significance.
Extended Data Figure 9. Splicing re-patterning and transcriptome shift underlying shPtbp1-mediated enhancement of iCM reprogramming, and correlation of M/G/T expression and reprogramming.

(a-n) Splicing analyses of d3 reprogramming cells upon Ptbp1 silencing. Related to Fig. 3j-q. (a) Number of overlapping and non-overlapping AS events identified between MGT vs lacZ and MGT+shPtbp1 vs MGT+shNT. The minimal overlap suggests that Ptbp1 knockdown caused extensive re-patterning of the splicing landscape during iCM induction. (b) Number of ES events that skip (grey) or include (red) the exon more in MGT+shPtbp1 compared to MGT+shNT. (c) GO analysis of AS genes between MGT and lacZ. (d-e) A total of 138 AS events (83 genes) between MGT+shPtbp1 and MGT+shNT were reported by rMATS to be the most significant (p value = 0, which was actually < 1e-16). (d) Top 10 events ranked by junction counts include 4 events on tropomyosin genes (Tpm1 and Tpm2). Tropomyosins are critical genes for muscle contraction and they are known to undergo extensive alternative splicing40. The most studied tropomyosin AS events have been mutually exclusive exons and it is interesting to find here two ES events of Tpm1 as the top 2 AS events upon Ptbp1 knockdown during reprogramming. (e) GO analysis of these most significant AS genes. (f-i) Sashimi plots for the rest representative AS events in the blue-labeled GO terms in Fig. 3n. The event shown in Fig. 3o was on Mbnl, which is a critical splicing factor for cardiac function that switches isoforms during heart development41. The event shown in (h) was an exon skipping event on Tpm1 exon 3 (exon 2b in older literature), which was also the top event in (d). This exon3 skipped isoform of Tpm1 (Tpm1α) is the one enriched in cardiac and striated muscle cells, regulating the assembly and functionality of actin filament for contraction42. (j) Overlap of AS genes and DEGs between MGT+shPtbp1 vs MGT+shNT cells. (k) Overlap of DEGs between MGT vs lacZ and MGT+shPtbp1 vs MGT+shNT. (l) Percentage of overlapping DEGs in (k) showing the same or opposite direction of changes. (m-o) Based on (k), top GO terms for DEGs only between MGT and lacZ (m), overlapping DEGs (n), and DEGs only between MGT+shPtbp1 and MGT+shNT (o) were shown. (p-s) Correlation of M/G/T expression and reprogramming. Related to Fig. 4a. (p) Correlation between the total expression of M+G+T in individual cells and the SLICER-calculated reprogramming progress of each cell. Trendline and the correlation coefficient by linear regression was shown (p = 3.9e-78, α=0.05, two-sided). (q-s) Expression levels of M, G, and T in Fib, iFib, piCM, and iCM plotted as average ± SEM (q) or violin plots to show distribution (r). (s) Ratios of expression levels of M, G, and T in the four cell groups. Average ± SEM was shown. (t-u) Spearman correlation between M, G, T expression and the expression of 178 known and predicted splicing factors32 or 1602 additional transcription factors12. Genes with correlation coefficient > 0.3 or < −0.3 with one or more of M, G, T were selected and the inter-correlation matrix of the 17 selected splicing factors (t) and the 65 selected transcription factors (u) were calculated and plotted as heatmap. The splicing factors Mbnl1 and Rbms3 are strongly anti-correlated with M, G, T’s expression and Rbm20 is the only factor that is positively correlated with M, G, T expression (p values < 1e-7 by two-sided Spearman correlation, α=0.05). In (u), two sets of genes, A and B, were found to be strongly anti-correlated with M, G, T expression and meanwhile strongly co-expressed. These genes include Id1, Id2, Id3, Tcf21, and Foxp1 (p values < 1e-15 by two-sided Spearman correlation, α=0.05) that might serve as “secondary” key factors to further trigger the activation/inhibition of downstream cascades for successful conversion from fibroblasts to iCMs.
Extended Data Figure 10. Putative markers for iCM and piCM.
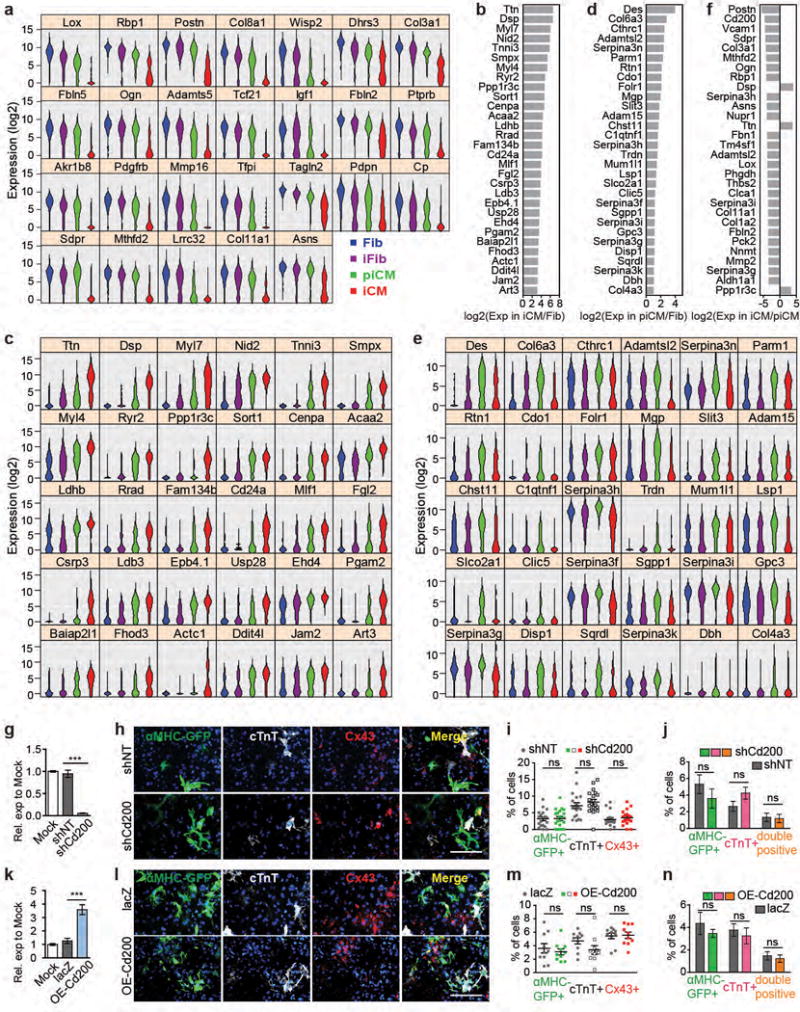
ANOVA identified 7624 DEGs among Fib, iFib, piCM, and iCM. There were 954/285 candidates for negative/positive selection markers of iCM and 55 candidates for positive markers of piCM. These candidates were expressed lowest/highest in iCM and highest in piCM, respectively. No gene passed the selection criteria for negative markers of piCM. Top candidates were selected by largest fold change of expression in the cell population of interest compared to that in Fib. (a) Violin plots showing the expression of non-surface genes in top 30 candidates for negative markers of iCM. Related to Fig. 4d. (b-e) Top 30 candidates for positive selection markers of iCM (b, c) or piCM (d, e). (b, d) Fold change of gene expression in iCM/Fib (b) or piCM/Fib (d). (c, e) Violin plots of the same genes in 4 cell populations. (f) Top 30 genes showing largest expression fold change in piCM and iCM. (g-n) Effect of Cd200 knockdown (g-j) or overexpression (k-n) on iCM reprogramming. CF was untransduced (Mock), or simultaneously transduced with MGT and lentiviral shNT/shCd200 or lacZ/OE-Cd200 for 14 days. Knockdown or overexpression efficiency was verified by qRT-PCR (g, k). Average ± SD was shown. n=3 samples. Percentages of αMHC-GFP+, cTnT+, and Cx43+ cells were determined by immunostaining followed by imaging and blinded quantification (h-i, l-m) with representative 20× images in (h, l). Scale bar = 200 μm. n= 20 (i) or 10 (m) images. Average ± SEM was shown. Percentages of αMHC-GFP+, cTnT+, and double-positive cells were also quantified by flow (j, n). Average ± SD was shown. n=3 samples. Two-sided student’s t test was used. Significance: *** p<0.001, ns, lack of enough evidence for significance.
Supplementary Material
Acknowledgments
We thank UNC AAC Core, HTSF Core, Flow Core for technical support. This study was supported by NIH HG06272 to J.F.P., NIH BD2K Fellowship (T32 CA201159) and NIH F31 Fellowship (HG008912) to J.D.W., NIH/NHLBI R00 HL109079 and American Heart Association (AHA) 15GRNT25530005 to J.L., AHA 13SDG17060010, Ellison Medical Foundation (EMF) AG-NS-1064-13, and NIH/NHLBI R01HL128331 to L.Q., and generous gifts from Dr. Hugh “Chip” McAllister and Cecil Sewell.
Footnotes
Supplementary Information is linked to the online version of the paper at www.nature.com/nature.
Author Contributions L.Q., Z.L., and L.W. conceived and designed the study. Z.L. and L.W. designed and performed single-cell RNA-seq. Z.L., L.W., Y.Z. and C.Y. prepared samples for microarray and bulk RNA-seq. L.W., Y.Z., H.M., H.V., C.Y., S.Y., B.W., S.A., and M.Z. performed other experiments. Z.L., J.W., J.P. performed data analysis and modeling. W.S. helped with statistical analysis. Z.L, J.W., J.L. and L.Q. wrote the manuscript, with extensive input from all authors. J.L. and L.Q. provided funding and overall supervision.
Author Information
The authors declare no competing financial interest. Readers are welcome to comment on the online version of the paper.
References
- 1.Ieda M, et al. Direct reprogramming of fibroblasts into functional cardiomyocytes by defined factors. Cell. 2010;142:375–386. doi: 10.1016/j.cell.2010.07.002. [DOI] [PMC free article] [PubMed] [Google Scholar]
- 2.Jayawardena TM, et al. MicroRNA-mediated in vitro and in vivo direct reprogramming of cardiac fibroblasts to cardiomyocytes. Circulation research. 2012;110:1465–1473. doi: 10.1161/CIRCRESAHA.112.269035. [DOI] [PMC free article] [PubMed] [Google Scholar]
- 3.Qian L, et al. In vivo reprogramming of murine cardiac fibroblasts into induced cardiomyocytes. Nature. 2012;485:593–598. doi: 10.1038/nature11044. [DOI] [PMC free article] [PubMed] [Google Scholar]
- 4.Song K, et al. Heart repair by reprogramming non-myocytes with cardiac transcription factors. Nature. 2012;485:599–604. doi: 10.1038/nature11139. [DOI] [PMC free article] [PubMed] [Google Scholar]
- 5.Dal-Pra S, Hodgkinson CP, Mirotsou M, Kirste I, Dzau VJ. Demethylation of H3K27 Is Essential for the Induction of Direct Cardiac Reprogramming by miR Combo. Circulation research. 2017;120:1403–1413. doi: 10.1161/CIRCRESAHA.116.308741. [DOI] [PMC free article] [PubMed] [Google Scholar]
- 6.Ma H, Wang L, Yin C, Liu J, Qian L. In vivo cardiac reprogramming using an optimal single polycistronic construct. Cardiovascular research. 2015;108:217–219. doi: 10.1093/cvr/cvv223. [DOI] [PMC free article] [PubMed] [Google Scholar]
- 7.Mathison M, et al. In vivo cardiac cellular reprogramming efficacy is enhanced by angiogenic preconditioning of the infarcted myocardium with vascular endothelial growth factor. Journal of the American Heart Association. 2012;1:e005652. doi: 10.1161/JAHA.112.005652. [DOI] [PMC free article] [PubMed] [Google Scholar]
- 8.Mohamed TM, et al. Chemical Enhancement of In Vitro and In Vivo Direct Cardiac Reprogramming. Circulation. 2017;135:978–995. doi: 10.1161/CIRCULATIONAHA.116.024692. [DOI] [PMC free article] [PubMed] [Google Scholar]
- 9.Zhao Y, et al. High-efficiency reprogramming of fibroblasts into cardiomyocytes requires suppression of pro-fibrotic signalling. Nature communications. 2015;6:8243. doi: 10.1038/ncomms9243. [DOI] [PMC free article] [PubMed] [Google Scholar]
- 10.Zhou H, Dickson ME, Kim MS, Bassel-Duby R, Olson EN. Akt1/protein kinase B enhances transcriptional reprogramming of fibroblasts to functional cardiomyocytes. Proceedings of the National Academy of Sciences of the United States of America. 2015;112:11864–11869. doi: 10.1073/pnas.1516237112. [DOI] [PMC free article] [PubMed] [Google Scholar]
- 11.Ifkovits JL, Addis RC, Epstein JA, Gearhart JD. Inhibition of TGFbeta signaling increases direct conversion of fibroblasts to induced cardiomyocytes. PloS one. 2014;9:e89678. doi: 10.1371/journal.pone.0089678. [DOI] [PMC free article] [PubMed] [Google Scholar]
- 12.Liu Z, et al. Re-patterning of H3K27me3, H3K4me3 and DNA methylation during fibroblast conversion into induced cardiomyocytes. Stem cell research. 2016;16:507–518. doi: 10.1016/j.scr.2016.02.037. [DOI] [PMC free article] [PubMed] [Google Scholar]
- 13.Muraoka N, et al. MiR-133 promotes cardiac reprogramming by directly repressing Snai1 and silencing fibroblast signatures. The EMBO journal. 2014;33:1565–1581. doi: 10.15252/embj.201387605. [DOI] [PMC free article] [PubMed] [Google Scholar]
- 14.Wang L, et al. Stoichiometry of Gata4, Mef2c, and Tbx5 influences the efficiency and quality of induced cardiac myocyte reprogramming. Circulation research. 2015;116:237–244. doi: 10.1161/CIRCRESAHA.116.305547. [DOI] [PMC free article] [PubMed] [Google Scholar]
- 15.Zhou Y, et al. Bmi1 Is a Key Epigenetic Barrier to Direct Cardiac Reprogramming. Cell stem cell. 2016;18:382–395. doi: 10.1016/j.stem.2016.02.003. [DOI] [PMC free article] [PubMed] [Google Scholar]
- 16.Shin J, et al. Single-Cell RNA-Seq with Waterfall Reveals Molecular Cascades underlying Adult Neurogenesis. Cell stem cell. 2015;17:360–372. doi: 10.1016/j.stem.2015.07.013. [DOI] [PMC free article] [PubMed] [Google Scholar]
- 17.Welch JD, Hartemink AJ, Prins JF. SLICER: inferring branched, nonlinear cellular trajectories from single cell RNA-seq data. Genome biology. 2016;17:106. doi: 10.1186/s13059-016-0975-3. [DOI] [PMC free article] [PubMed] [Google Scholar]
- 18.Polo JM, et al. A molecular roadmap of reprogramming somatic cells into iPS cells. Cell. 2012;151:1617–1632. doi: 10.1016/j.cell.2012.11.039. [DOI] [PMC free article] [PubMed] [Google Scholar]
- 19.Vaseghi HR, et al. Generation of an inducible fibroblast cell line for studying direct cardiac reprogramming. Genesis. 2016;54:398–406. doi: 10.1002/dvg.22947. [DOI] [PMC free article] [PubMed] [Google Scholar]
- 20.Fu XD, Ares M., Jr Context-dependent control of alternative splicing by RNA-binding proteins. Nature reviews Genetics. 2014;15:689–701. doi: 10.1038/nrg3778. [DOI] [PMC free article] [PubMed] [Google Scholar]
- 21.Wang L, et al. Improved Generation of Induced Cardiomyocytes Using a Polycistronic Construct Expressing Optimal Ratio of Gata4, Mef2c and Tbx5. Journal of visualized experiments : JoVE. 2015 doi: 10.3791/53426. [DOI] [PMC free article] [PubMed] [Google Scholar]
- 22.He A, Kong SW, Ma Q, Pu WT. Co-occupancy by multiple cardiac transcription factors identifies transcriptional enhancers active in heart. Proceedings of the National Academy of Sciences of the United States of America. 2011;108:5632–5637. doi: 10.1073/pnas.1016959108. [DOI] [PMC free article] [PubMed] [Google Scholar]
- 23.Waldron L, et al. The Cardiac TBX5 Interactome Reveals a Chromatin Remodeling Network Essential for Cardiac Septation. Developmental cell. 2016;36:262–275. doi: 10.1016/j.devcel.2016.01.009. [DOI] [PMC free article] [PubMed] [Google Scholar]
- 24.Zheng X, et al. Prolyl hydroxylation by EglN2 destabilizes FOXO3a by blocking its interaction with the USP9x deubiquitinase. Genes & development. 2014;28:1429–1444. doi: 10.1101/gad.242131.114. [DOI] [PMC free article] [PubMed] [Google Scholar]
- 25.Qian L, Berry EC, Fu JD, Ieda M, Srivastava D. Reprogramming of mouse fibroblasts into cardiomyocyte-like cells in vitro. Nature protocols. 2013;8:1204–1215. doi: 10.1038/nprot.2013.067. [DOI] [PubMed] [Google Scholar]
- 26.Wu AR, et al. Quantitative assessment of single-cell RNA-sequencing methods. Nature methods. 2014;11:41–46. doi: 10.1038/nmeth.2694. [DOI] [PMC free article] [PubMed] [Google Scholar]
- 27.Treutlein B, et al. Reconstructing lineage hierarchies of the distal lung epithelium using single-cell RNA-seq. Nature. 2014;509:371–375. doi: 10.1038/nature13173. [DOI] [PMC free article] [PubMed] [Google Scholar]
- 28.Anders S, Pyl PT, Huber W. HTSeq–a Python framework to work with high-throughput sequencing data. Bioinformatics. 2015;31:166–169. doi: 10.1093/bioinformatics/btu638. [DOI] [PMC free article] [PubMed] [Google Scholar]
- 29.Brennecke P, et al. Accounting for technical noise in single-cell RNA-seq experiments. Nature methods. 2013;10:1093–1095. doi: 10.1038/nmeth.2645. [DOI] [PubMed] [Google Scholar]
- 30.Johnson WE, Li C, Rabinovic A. Adjusting batch effects in microarray expression data using empirical Bayes methods. Biostatistics. 2007;8:118–127. doi: 10.1093/biostatistics/kxj037. [DOI] [PubMed] [Google Scholar]
- 31.Chen C, et al. Removing batch effects in analysis of expression microarray data: an evaluation of six batch adjustment methods. PloS one. 2011;6:e17238. doi: 10.1371/journal.pone.0017238. [DOI] [PMC free article] [PubMed] [Google Scholar]
- 32.Han H, et al. MBNL proteins repress ES-cell-specific alternative splicing and reprogramming. Nature. 2013;498:241–245. doi: 10.1038/nature12270. [DOI] [PMC free article] [PubMed] [Google Scholar]
- 33.Trapnell C, et al. The dynamics and regulators of cell fate decisions are revealed by pseudotemporal ordering of single cells. Nature biotechnology. 2014;32:381–386. doi: 10.1038/nbt.2859. [DOI] [PMC free article] [PubMed] [Google Scholar]
- 34.Love MI, Huber W, Anders S. Moderated estimation of fold change and dispersion for RNA-seq data with DESeq2. Genome biology. 2014;15:550. doi: 10.1186/s13059-014-0550-8. [DOI] [PMC free article] [PubMed] [Google Scholar]
- 35.Ritchie ME, et al. limma powers differential expression analyses for RNA-sequencing and microarray studies. Nucleic acids research. 2015;43:e47. doi: 10.1093/nar/gkv007. [DOI] [PMC free article] [PubMed] [Google Scholar]
- 36.Shen S, et al. rMATS: robust and flexible detection of differential alternative splicing from replicate RNA-Seq data. Proceedings of the National Academy of Sciences of the United States of America. 2014;111:E5593–5601. doi: 10.1073/pnas.1419161111. [DOI] [PMC free article] [PubMed] [Google Scholar]
- 37.Park JW, Jung S, Rouchka EC, Tseng YT, Xing Y. rMAPS: RNA map analysis and plotting server for alternative exon regulation. Nucleic acids research. 2016;44:W333–338. doi: 10.1093/nar/gkw410. [DOI] [PMC free article] [PubMed] [Google Scholar]
- 38.Pinto AR, et al. An abundant tissue macrophage population in the adult murine heart with a distinct alternatively-activated macrophage profile. PloS one. 2012;7:e36814. doi: 10.1371/journal.pone.0036814. [DOI] [PMC free article] [PubMed] [Google Scholar]
- 39.Whitfield ML, et al. Identification of genes periodically expressed in the human cell cycle and their expression in tumors. Molecular biology of the cell. 2002;13:1977–2000. doi: 10.1091/mbc.02-02-0030.. [DOI] [PMC free article] [PubMed] [Google Scholar]
- 40.Gooding C, Smith CW. Tropomyosin exons as models for alternative splicing. Advances in experimental medicine and biology. 2008;644:27–42. doi: 10.1007/978-0-387-85766-4_3. [DOI] [PubMed] [Google Scholar]
- 41.Terenzi F, Ladd AN. Conserved developmental alternative splicing of muscleblind-like (MBNL) transcripts regulates MBNL localization and activity. RNA biology. 2010;7:43–55. doi: 10.4161/rna.7.1.10401. [DOI] [PubMed] [Google Scholar]
- 42.Dube DK, McLean MD, Dube S, Poiesz BJ. Translational control of tropomyosin expression in vertebrate hearts. Anat Rec (Hoboken) 2014;297:1585–1595. doi: 10.1002/ar.22978. [DOI] [PubMed] [Google Scholar]
Associated Data
This section collects any data citations, data availability statements, or supplementary materials included in this article.
Supplementary Materials
Data Availability Statement
The RNA-sequencing data that support the findings of this study are available in GEO under the accession number GSE98571. Source data for all figures are available in the supplementary tables.