Abstract
Subject-specific musculoskeletal models are increasingly used in biomedical applications to predict endpoint forces due to muscle activation, matching predicted forces to experimentally observed forces at a specific limb configuration. However, it is difficult to precisely measure the limb configuration at which these forces are observed. The consequent uncertainty in limb configuration might contribute to errors in model predictions. We therefore evaluated how uncertainties in limb configuration measurement contributed to errors in force prediction, using data from in vivo measurements in the rat hindlimb. We used a data driven approach to estimate the uncertainty in estimated limb configuration and then used this configuration uncertainty to evaluate the consequent uncertainty in force predictions, using Monte Carlo simulations. We used subject-specific models of joint structures (i.e. centers and axes of rotation) in order to estimate limb configurations for each animal. The standard deviation of the distribution of predicted force directions resulting from configuration uncertainty was small, ranging between 0.27 and 3.05 degrees across muscles. For most muscles, this standard deviation was considerably smaller than the error between observed and predicted forces (between 0.57 and 70.96 degrees), suggesting that uncertainty in limb configuration could not explain inaccuracies in model predictions. Instead, our results suggest that inaccuracies in muscle model parameters, most likely in parameters specifying muscle moment arms, are the main source of prediction errors by musculoskeletal models in the rat hindlimb.
Index Terms: Biomechanical simulation, musculoskeletal model, Monte Carlo simulation, rat hindlimb
I. INTRODUCTION
Musculoskeletal models have provided important insights into the mechanics and control of movement, and are important for biomedical interventions to restore limb function. A complete musculoskeletal model requires measuring both properties of muscles and of the skeletal system. Muscle models are often created by measuring a number of properties of muscle and tendon function, such as sarcomere length, physiological cross sectional area, tendon slack length, or muscle moment arms, then using those measurements to specify the parameters of a canonical model of muscle force production [1–6, 7 ]. These properties are often obtained from cadavers or fixed tissue. However, to predict and interpret the action of muscles it is necessary to estimate the configuration of the limb. The limb configuration determines the non-linear transformations between the measured muscle properties and the production of muscle forces, joint torques, and limb movement; any small errors in the estimated limb configuration might result in large errors in predicted motor output [8].
The configuration of a limb consists of joint angles, the position and orientation of a reference coordinate frame usually fixed to the pelvis, and bone lengths. Measuring limb configuration in three dimensions is challenging, since these values have to be measured in vivo. In most biomechanical applications limb configuration is estimated indirectly, by measuring positions of bony landmarks (either after exposing the bone by dissection or from medical images), or by tracking external markers placed on skin with a motion capture system. Such indirect measurements could introduce errors in estimating limb configuration [9]. Here we investigate the significance of such errors in determining the actions of the musculoskeletal system.
As a motivating example, consider our previous work in which we developed a novel in vivo approach to evaluate a musculoskeletal model of the rat hindlimb [10]. We stimulated individual muscles and measured the evoked forces across the skeleton. We compared the model predictions to the observed forces and then used optimization to update model parameters (muscle origins and insertions, optimal fiber length, maximum force) to produce accurate force predictions. The resulting musculoskeletal model was valid by design, capturing the actual in vivo action of muscles.
However, in those experiments we estimated limb configuration from rough measurements of hip position, force transducer attachment location on the tibia, and segment lengths. We also used a subject-independent template for joint axes and centers of rotation at the hip and knee. These rough measurements and subject-independent assumptions could lead to uncertainties in the estimate of limb configuration and therefore inaccuracies in the forces predicted by the model [11]. Previous studies modelling muscles in the human thumb have shown that such incorrect estimates in limb configuration could be a significant source of musculoskeletal model force prediction errors [12–14]. In general, such errors in limb configuration will affect any musculoskeletal model evaluation comparing predicted and observed forces. These errors might be especially significant for human digits and rat limbs, given their small sizes. The consequence of these errors might also depend on the specific structure of the limb being studied, having a larger consequence in limbs with complex joint structures.
We examined these issues in the current study, evaluating whether uncertainty in estimating limb configuration could explain model prediction errors for the rat hindlimb. In contrast to the previous work in modelling of human thumb muscles, we find that uncertainty in predicted forces due to uncertainty in limb configuration estimates was small relative to the model prediction errors, suggesting that muscle model parameters, most likely muscle moment arms, were likely to be the main source of error.
II. METHODS
A. Experimental Force and Kinematic Data Collection
The preparation and experimental procedures were similar to those described previously [10, 15, 16]. Briefly, rats were anesthetized (ketamine/xylazine 80/20mg/kg) and hindlimb muscles were implanted with electrodes (stainless steel or silver wire) with an exposure size of 1-2mm. We generally implanted between 8 and 10 muscles, although we only report here those muscles that produced reliable forces. Muscles included vastus medialis (VM), vastus lateralis (VL), rectus femoris (RF), biceps femoris anterior (BFa), biceps femoris posterior (BFp), gracilis anterior (GA), gracilis posterior (GP), semimembranosus (SM), semitendinosus posterior (STp), adductor magnus (AM), and iliopsoas (IP). A common return electrode (~2 by 1cm brass plate) was placed under the skin on the back. Orthopedic pins were screwed and cemented into the pelvis both contralaterally and ipsilaterally to the implanted hindlimb. Bone screws were placed in the ipsilateral tibia at the ankle on the medial surface and a threaded attachment cemented to the screws. The animal was placed on a platform that supported its torso and forelimbs but that allowed its hindlimb to hang freely (Figure 1). The pins in the pelvis were attached to magnetic stands in order to mechanically secure the pelvis. The attachment on the medial surface of the ankle was secured to a 6 axis force transducer (ATI Mini-40). The force transducer was mounted on a series of translatable stages allowing the limb to be positioned throughout its workspace. We released the rotational degree of freedom around the mediolateral axis connecting the force transducer to the leg to avoid over-constraining force measurements [17]. We measured evoked forces at several configurations (6–10) for each muscle. Biphasic constant current stimulation trains (50–75Hz, 0.1ms pulses, 0.5-1s train duration) were applied through implanted electrodes using a programmable stimulator (FNS-16, CWE) controlled by custom software in Matlab. With the limb held fixed at each position, we collected recruitment curves for each muscle, varying the stimulation current magnitude and measuring the evoked force. Recruitment curves were inspected to identify stimulation levels at which the direction or magnitude of evoked force changed, indicating spread of current to adjacent muscles. Stimulation levels that produced the largest force but that were below this spillover level were included in subsequent analyses.
Figure 1.
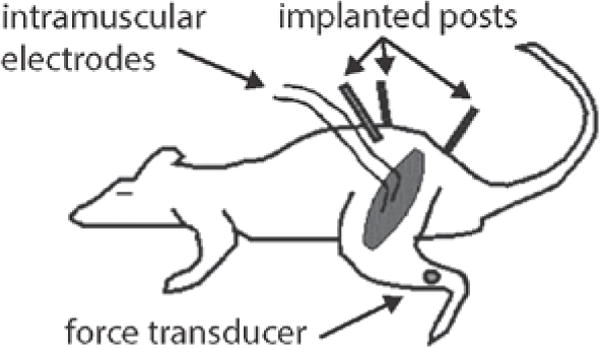
Schematic illustrating the experimental setup for measurement of forces evoked from stimulation of individual muscles in the rat hindlimb. Orthopedic pins were placed in the pelvis and clamped to immobilize the pelvis. A force transducer was attached to the distal tibia and could be positioned across the hindlimb workspace. Individual muscles were stimulated through intramuscular electrodes with the limb held at a single limb configuration and the evoked isometric force at the tibia was measured by the force transducer.
At the end of data collection, the animal was killed by pentobarbital overdose and the muscles overlying the implanted skeleton were dissected away. Bony landmarks on the skeleton were identified and cleared of tissue (4 on the pelvis, 5 on the femur, 4 on the tibia, see Figure 3A). We used a pointer with several retroreflective markers attached to it to identify each landmark. The tip of the pointer was then placed on each bony landmark and the 3D positions of the attached retroreflective markers recorded using a motion tracking system (Vicon, T20 cameras). The location of the tip, and therefore of the bony landmark, was found based on the known relationship between the markers and the tip position. We also measured the attachment point of the force transducer on the tibia. This process was repeated for each limb configuration at which forces were measured. Retroreflective markers were also attached to the force transducer and tracked as the transducer was moved along each of its axes, in order to register the reference frame of the force transducer to that of the bony landmark measurements.
Figure 3.
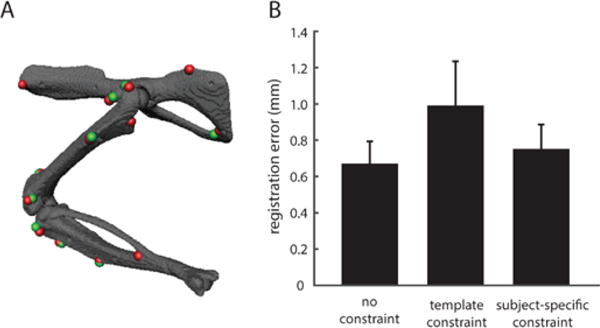
Subject-specific registration of bony landmarks in the rat hindlimb. (A) shows an example for one animal at one configuration, showing the registration between measured landmarks (red) and landmarks on the model’s skeletal surface (green). (B) summarizes the registration accuracy across animals. The bars show the registration error with no joint constraints, the error using the subject-independent joint centers and axes from the model template, and the error using the subject-specific joint centers and axes. The subject-specific error was obtained through cross-validation, fitting the joint model parameters at N-1 configurations and evaluating the error for the remaining configuration, then repeating for all N configurations.
B. Rat Hindlimb Musculoskeletal Model Template
Musculoskeletal mechanics were modeled and simulated using the strand framework [18]. A strand is a modeling primitive that represents a thin 3D solid, with mass, elasticity, and other constitutive properties. Each muscle was modeled as a strand; the skeleton was modeled as rigid bodies connected by idealized joints. Although the strand framework can capture aspects of musculoskeletal function such as muscle interactions or contact stresses [18], in this paper we only consider aggregate actions of muscle actions across the skeleton and so our results are not specific to this strand formalism.
We first created a musculoskeletal model template of the rat hindlimb (see Figure 2, adapting a previously published model [4], [20]). The hip was modeled as a three degree of freedom (dof) ball and socket joint and the knee was modeled as a universal joint with two dofs in flexion/extension and external/internal rotation (Figure 2A). Three dimensional models of the bones of the rat hindlimb were created from micro-CT scans of individual bones from an animal not included in this study. The bony landmarks measured experimentally, as described above, were identified on each bone model. All joint structure parameters (centers of rotation, axes of rotation) were expressed relative to these bony landmarks. Muscle origins and insertions as well as sliding constraint sites were also defined relative to the bone segments, using the data reported in [4] and reported in OpenSim [19]. Each musculotendon path was estimated as a B-spline curve that attached at the origin and insertion and passed through the constraint sites to define muscle wrapping and prevent penetration of muscle paths into bones (Figure 2B). For the quadriceps muscles we simulated a common patellar tendon constrained to slide on top of the knee surface in the patellar groove. Maximum muscle isometric forces were taken from the Johnson model [20].
Figure 2.
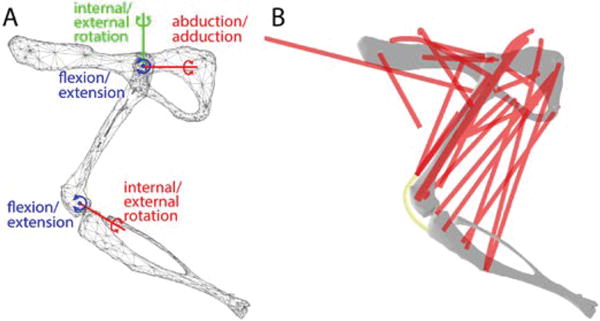
The musculoskeletal model of the rat hindlimb evaluated in this study. (A) shows the surface meshes of the pelvis, femur, and tibia along with the joint axes and centers of rotation for the generic, subject-independent model. The hip was modelled as a 3dof ball and socket joint. The knee was modelled as 2dof universal joint with orthogonal axes. (B) shows the muscle (red) and tendon (yellow) strands included in the model.
C. Registering Model Template to Experimental Data
In order to predict muscle forces, we first performed a subject-specific registration between the model template and each experimental animal using a two-step iterative optimization [11, 21]. In the first step, joint structural parameters (centers and axes of rotation) describing hip and knee joint structures were held constant and the model limb configuration was matched to each experimental limb configuration, finding the joint coordinates (joint angles) that minimize the residual squared error between modelled and measured bony landmark locations:
where Xi are the generalized coordinates describing the limb configuration for posture i, including a scaling constant to capture differences in animal size; J is the set of current joint structural parameters, treated as constants in this step; Pi is the vector of measured bony landmark locations for posture i; p′ are the corresponding bony landmark positions predicted by the model. These predicted positions p′ are a function of both the joint structural parameters J and the generalized limb configuration coordinates Xi.
In the second step, the limb coordinates Xi found for each limb configuration in the first step are held constant and the joint structural parameters are updated to minimize the residual error summed across all configurations:
where nf is the number of postures. We used Matlab (fmincon) to find parameters in each step, iterating between these steps until the optimization converged on a set of joint coordinates for each limb configuration and a set of joint structural parameters for that animal. To improve convergence and avoid local minima, initial joint coordinates in the first iteration of step 1 were estimated using an ad hoc hierarchical registration process, first registering the landmarks on each bone independently then estimating joint coordinates in a proximal-distal sequence. Initial joint structural parameters for the first iteration were taken from the model template.
We compared the registration accuracy when using the subject-specific joint models to the registration accuracy when using the joint structural parameters in the model template. Registration accuracy for the model template joint structure was calculated as the residual error obtained after step 1 on the first iteration of the optimization described above; i.e. finding the joint coordinates that best matched the model template to the measured landmarks. Registration accuracy for subject-specific joint models was calculated as the residual error upon convergence of the optimization. To control for overfitting of the model, we calculated the generalization error using a leave-one-out cross-validation, using N-1 limb configurations to identify the joint structure model then evaluating accuracy on the Nth configuration.
The registrations described above will be affected by the particular types of joint structures (ball joint for the hip, universal joint for the knee) used in the model, potentially limiting the range of limb configurations that can be matched. To evaluate how much these assumed joint structures affected registration accuracy, we also found the registration accuracy when no joints were used, simply translating, rotating, and scaling each bone segment in the model independently in order to best match measured landmark locations.
D. Model Prediction of Endpoint Force
After performing the subject-specific registration described above, the muscle attachments, constraint points, and muscle paths were updated according to the registered bone locations for each limb configuration. We then predicted the forces that would be measured by the force transducer when each muscle was activated. The force transducer attachment was simulated as a 1dof joint allowing rotation around the mediolateral axis, as was used in the experiments. Although this rotation was permitted, no rotation was actually observed in the model since the limb degrees of freedom were matched to those of the force transducer [17]. Muscles were maximally activated one at a time and the predicted force at the transducer was recorded for each limb configuration.
E. Contribution of Kinematic Measurement Errors to Model Predictions
We evaluated the contribution of uncertainty in estimation of limb configuration to the muscle force predictions. We performed a data driven, Monte Carlo sensitivity analysis [12, 22–28]. To estimate the uncertainty in the limb configuration, we first estimated the uncertainty in measuring bony landmarks. For each animal, we estimated the distribution in measured landmarks on the pelvis. Because the pelvis was fixed for each limb configuration, the distribution of these markers measured repeatedly reflects the variability in experimenters’ ability to identify and measure each landmark. We then used this distribution to perturb the measured bony landmark positions. Perturbations of the 3D location of each landmark were generated from an anisotropic multivariate normal distribution with standard deviations calculated from the distribution of repeated pelvis landmark measurements. These perturbed locations were then used to perform the subject-specific registration and prediction of muscle forces, as described above. This process was repeated 500 times for each model prediction, resulting in a distribution of predicted forces due to variability in measurement of bony landmarks.
III. RESULTS
A. Subject-specific Registration of Skeletal Landmarks
Figure 3A shows an example of the subject-specific registration found for one animal at a single limb configuration. Both joint structures (centers and axes of rotation) and limb coordinates (joint angles) for this animal were identified using the iterated two-step optimization described above. As seen in the figure, the registration was generally very good, with good correspondence between the model landmark locations (red) and measured landmark locations (green). The registration error for this configuration, averaged across all landmarks, was 0.76±0.42mm. Figure 3B shows the registration errors averaged across all configurations and all animals. The subject-specific registration error was 0.75±0.14mm, averaged across all markers. These are cross-validated errors, obtained from finding the joint structural parameters from N-1 configurations then evaluating the registration on the remaining configuration. The template constraint bar in the figure shows the registration error from aligning the bony landmarks while using the generic joint structural model parameters obtained from the model template, showing that there was a substantial improvement in registration accuracy using the subject-specific registration. The no constraint bar shows the registration error from registering the markers on each bone independently, without restricting relative bone movement by joint constraints. The registration error in this case was only slightly lower than that observed with the subject-specific registration. These results indicate that we were able to register bony landmarks with reasonably good accuracy, although there were residual errors that might limit the accuracy of estimated limb configurations.
B. Comparing Model Force Predictions to Experimental Forces
Figure 4A shows an example of the forces evoked from stimulation of iliopsoas (IP) at limb configurations throughout the hindlimb workspace. The black arrow at each configuration shows the forces observed experimentally, measured at the distal tibia. The shaded skeleton at each position shows the joint configuration estimated from subject-specific registration of bony landmarks, as described in the previous section. Stimulation of IP produced forces that drove the limb forward, consistent with the hip flexion action of IP. The green arrow at each position shows the force predicted from activating IP in the musculoskeletal model at the same limb configuration. We were primarily interested in the direction of muscle action in this study and so both experimental and predicted forces were normalized to be unit magnitude. Across the workspace, the predicted force for IP was very close to the experimentally observed force, suggesting that the musculoskeletal model was accurate for this muscle.
Figure 4.
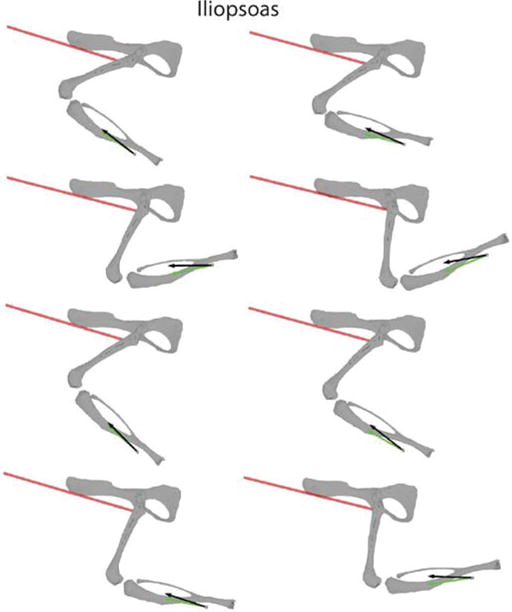
An example of measured and predicted muscle forces across different limb configurations. Each plot shows the measured force (black) and predicted force (green) at one limb configuration after stimulating IP. The red line indicates the muscle path for this muscle from the musculoskeletal model. The configuration of the skeleton illustrated in the figure was obtained from subject-specific registration of landmarks, such as illustrated in Figure 3A.
Figure 5 shows an example of the forces evoked from stimulation of semitendinosus (ST). ST produced a force directed dorsally and caudally, broadly consistent with the knee flexion/hip extension action of this muscle. Although the model predicted forces in a generally similar direction to those observed experimentally, there were substantial discrepancies between the forces observed experimentally and predicted.
Figure 5.
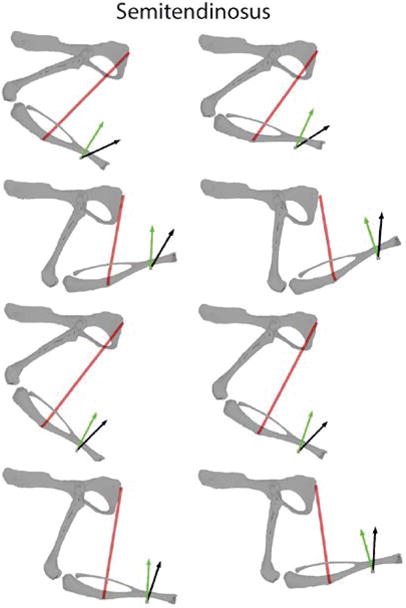
Another example of measured and predicted muscle forces. In this case, ST was stimulated. Conventions are the same as in Figure 4. The model for ST had larger prediction errors as compared to IP shown in Figure 4.
We quantified the difference between predicted and experimental forces as the 3D angle between force vectors. For the example of IP illustrated in Figure 4, the 3D angle averaged across limb configurations was 4.91±2.32 degrees; for the example of ST in Figure 5, the difference was 24.17±6.86 degrees. Figure 6 summarizes the 3D angles observed across all configurations and across all animals. Muscles differed considerably in how well the model predicted the experimentally observed forces, with average 3D angles ranging from 4.94 degrees for IP to 45.15 degrees for RF.
Figure 6.
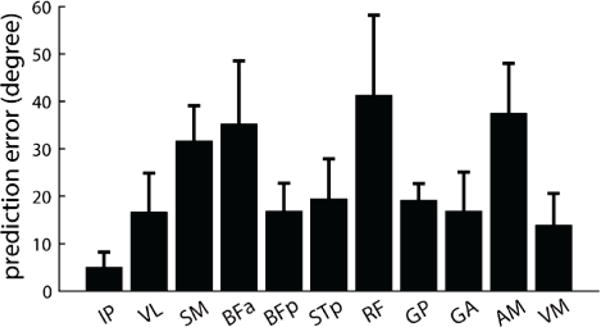
Summary of prediction errors across all muscles. Each bar shows the 3D angle between predicted and observed forces, averaged across all configurations and animals. Prediction errors varied considerably across muscles, with some muscles with very low prediction errors (IP), other muscles with moderate errors (VL, BFp, STp, GP, GA, VM) and others with more substantial errors (SM, BFa, RF, AM).
C. Contribution of Kinematic Measurement Uncertainty to Force Production Errors
Any errors in the measurement of bony landmarks will contribute to the errors in model force prediction seen in Figures 4–6. Although the registration errors found in Figure 3 were small, they might have a large effect on force prediction errors because of the nonlinear transformations involved in predicting model forces and the small size of the rat hindlimb. If this effect were large enough, the model prediction errors shown in Figures 6 might not imply that the underlying musculoskeletal model was inaccurate but might simply reflect uncertainties in measuring the limb configuration.
To evaluate this issue, we performed a Monte Carlo analysis, evaluating how errors in the measurement of bony landmarks affected predicted forces. We first estimated the accuracy in measuring bony landmarks. Because the pelvis was always in the same position across limb configurations, we used the distribution of measured pelvis landmarks as an estimate of our ability to measure landmarks consistently. The standard deviations of this distribution was 0.62±0.74mm (along x-axis), 0.83±0.79mm (along y-axis), and 0.63±0.76mm (along z-axis), averaged across animals. For each animal, we used its estimated distribution to add noise to the measured bony landmarks and repeated the subject-specific registration to the model landmarks, as described above. This process was repeated 500 times for each configuration. Figure 7A shows an example of the distribution of joint angles for each degree of freedom, taken from a single limb configuration in one animal. Figure 7B shows the standard deviations for each degree of freedom averaged across configurations and animals. Uncertainty in bony landmark measurements resulted in surprisingly narrow distributions of joint angles, with standard deviations ranging between approximately 1 degrees and 3 degrees (0.96, 2.04, 1.94, 0.98, 2.07 for each degree of freedom).
Figure 7.
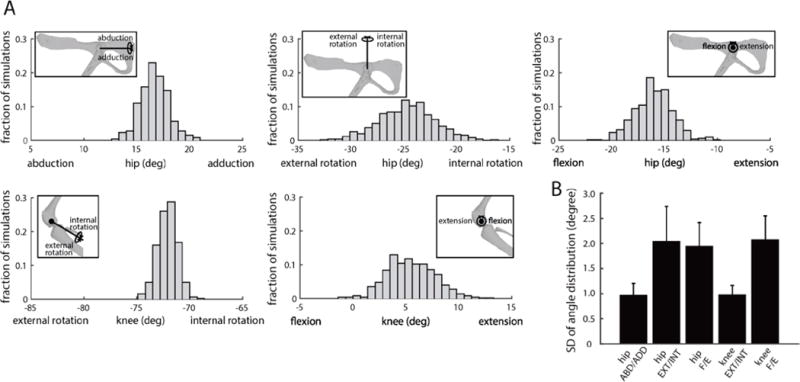
Uncertainty in joint configuration as a result of uncertainty in bony landmark measurement. The plots show the result of 500 Monte Carlo simulations obtained from registration of model bony landmarks and measured landmarks with variability added as expected by measurement error. (A) shows the results for one limb configuration in one animal. The insets in each figure illustrate the degree of freedom corresponding to each joint angle distribution. (B) shows the standard deviation of the joint angles for each degree of freedom, averaged across animals. In general, the uncertainty in joint configuration was low for all degrees of freedom.
We then examined how this uncertainty in limb configuration affected predicted forces. Figure 8 shows the distribution of predicted forces given the range of estimated joint configurations shown in Figure 7B, showing that uncertainty in limb configuration caused a modest spread in the predicted forces.
Figure 8.

An example of the consequences of the limb configuration uncertainty illustrated in Figure 7A on the uncertainty in force predictions for IP (A) and ST (B). Black arrows show the measured force vectors; green arrows show the forces predicted for the set of limb configurations obtained from landmark uncertainty, as illustrated in Figure 7A. This simulation was repeated for each position of the hindlimb in the workspace. The inset shows the set of predicted forces for one hindlimb position at a higher magnification, in order to illustrate the range of predicted forces. The left plot shows the forces in the sagittal plane, viewing the hindlimb from the side; the right plot shows the forces in the horizontal plane, viewing the hindlimb from above.
Figure 9 summarizes these results across configurations and animals, showing the average standard deviation of the distribution of 3D angles for each muscle. Uncertainty in limb configuration produced an uncertainty in predicted force direction between 0.5 and 3 degrees. For most muscles, this range of predicted forces was not large enough to explain the discrepancy between predicted and experimentally observed forces shown in Figure 6. Of the muscles examined here, only IP had constant prediction errors that were smaller than could be explained by uncertainty in limb configuration.
Figure 9.
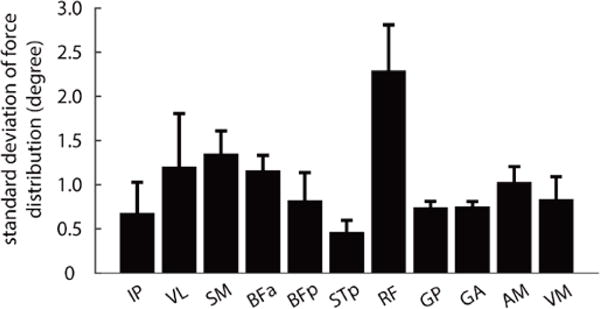
The standard deviation of the distribution of predicted forces due to uncertainty in estimating limb configuration. Each bar shows the standard deviation of the distribution of predicted force vectors, as illustrated in Figure 8, averaged across limb positions and animals.
In one animal, we evaluated what magnitude of configuration uncertainty would have been necessary to produce the observed force prediction errors shown in Figure 6. We found that a configuration uncertainty of 10mm standard deviation produced force prediction errors similar to those observed experimentally, ranging between 19 and 32 degrees. This level of configuration uncertainty was more than 10 times as large as the configuration uncertainty measured in these experiments, further suggesting that uncertainty in configuration estimates was unlikely to explain the force prediction errors observed here.
IV. DISCUSSION
The main result of the present study is that uncertainty in estimation of limb configuration explains only a small portion of the errors in model force prediction. This result suggests that errors in model force prediction likely reflect inaccurate musculoskeletal model parameters. We also showed that subject-specific registration of limb configuration and joint structural models substantially improved registration accuracy as compared to using generic, subject-independent joint structures.
The minimal effect of uncertainty in estimation of limb configuration was unexpected. We had expected that, given the small size of the rat hindlimb and difficulties in identifying often imprecise bony landmarks on the skeleton, this uncertainty would be able to explain a significant portion of the force prediction error. This expectation was also supported by previous research in modelling of human digit muscles, which suggested that errors in estimating thumb configuration were a major source of modelling inaccuracies [12, 13, 29]. That work showed that the force direction produced by a muscle in cadavers could be matched to the force predicted by a model if the thumb configuration differed from the configuration measured during the experiment [10]. The kinematics of the thumb are quite complex and so might be especially sensitive to configuration uncertainty as compared to other systems with simpler kinematics [30]. While the rat knee joint might be considered simpler that the human thumb, the limb properties that make a limb more or less sensitive to configuration errors are not obvious a priori and so the type of analyses performed in this study are necessary. In those experiments, however, only the position of the tip of the thumb was restrained and so joint angles could change substantially when a muscle was pulled; i.e. there was motion of unconstrained internal degrees of freedom. In the present study, the rat hindlimb was secured such that all degrees of freedom were fixed, and so changes in joint angles were limited to the compliance of the joints and force transducer. The current study therefore considered the uncertainty in limb configuration due to inaccurate bony landmark measurements rather than uncertainty due to internal motion of the limb. The present study shows that such errors in bony landmark measurements are insufficient to explain errors in model predictions for most muscles.
Instead, this study suggests that force prediction errors most likely reflect errors in the parameters of the musculoskeletal model. The most likely source of errors in force predictions observed in these experiments is inaccuracies in moment arms specified by muscle geometry (muscle origins, insertions and path). These errors might be especially important for muscles with complex curved paths or broad skeletal attachments. This is consistent with observation from previous studies which have showed that simplifying muscle geometries could significantly affect accuracy of the model prediction [8, 10]. Note that we focused on evaluating the prediction of force direction by the model, ignoring any differences in the magnitude of the forces between the observed and predicted forces. This focus was primarily due to the difficulty of evoking complete activation of muscles with the intramuscular electrodes used here; as a consequence it is difficult to make meaningful comparison between observed and predicted magnitudes. Internal muscle parameters affecting force magnitude, such as maximal force, tendon force length, or optimal muscle length would therefore not contribute to the errors evaluated here, although they might contribute more generally to muscle model prediction errors.
We have previously shown that optimizing model insertions and origins improved muscle force predictions so that they matched observed forces very accurately [10]. Those optimizations identified muscle anatomical parameters that were robust to local minima, consistent across animals, and physiologically realistic, suggesting that the isometric force measurements used in these experiments strongly constrain muscle model parameters. This approach has also been used to improve muscle moment arms for the thumb [14, 29]. Although we did not perform the same optimizations here, for many muscles the difference between measured and predicted forces appeared to be explicable by small alterations in muscle origins or insertions. For example, inspection of Figure 5 suggests that shifting the insertion of ST to lie closer to the knee would improve the accuracy of the model prediction. Similar observations could be made for several other muscles examined in this study. For other muscles it might be necessary to introduce additional complexity in the model structures in order to match observed muscle actions, such as adding muscle via points or multiple compartments. Taken together, these observations suggest that the optimization approach we have used previously might be able to substantially increase the accuracy of muscle model predictions. Alternatively, more accurate measurement or modelling of muscle paths and skeletal attachments might improve model predictions [31].
Another aspect of musculoskeletal models that could affect the accuracy of force predictions is the description of joint structures, such as joint axes and joint centers. In this study, we used the method described by Reinbolt et al. to identify joint axes and centers for each animal. We found that this subject-specific identification substantially improved cross-validated registration accuracy as compared to using a generic, subject-independent model of joint structures. We also found that the registration accuracy using subject-specific joint structures was only minimally worse than the accuracy from registering each bone independently with no joint constraints at all. This observation suggests that the joint structures used here (ball joint at the hip, orthogonal axes at the knee) capture the kinematics of the rat hindlimb very well. The good registration accuracy with orthogonal knee axes is in contrast to other work at the human thumb, which suggested that assuming orthogonal axes at the thumb resulted in substantial prediction errors [12].
The validity of orthogonal axes at the rat knee is consistent with our previous work showing accurate force predictions using orthogonal axes [10]. Further, in this study we observed errors for muscles acting only at the hip (e.g. BFa and AM); in those cases, it is clear that prediction errors are not due to the assumption of orthogonal knee axes. Nonetheless, it is possible that more detailed knee joint modelling consisting of different ‘topologies’ (e.g. capturing non-orthogonal and non-intersecting axes or moving centers of rotation) would reduce prediction errors further.
V. CONCLUSION
In this study, we evaluated how uncertainties in limb configuration measurement contributed to errors in force prediction, using data from in vivo measurements in the rat hindlimb. The results shown here illustrate the utility of in vivo measurements to evaluate the validity of musculoskeletal models. By directly measuring the action of muscles and of the uncertainty in limb configuration estimates, our results show that inaccuracies in estimating limb configuration make only small contributions to the inaccuracy of force predictions in the rat hindlimb. Future work will focus on refining model parameters specifying muscle moment arms in order to improve model predictions.
This work also emphasizes the need for similar Monte Carlo analyses when evaluating musculoskeletal models in other systems. There are many aspects of model development and specification that might contribute to model prediction errors. Evaluating their relative contributions, however, is difficult because of the specific structure of each limb and the complex nonlinear transformations between experimental measurements of model parameters and model predictions. By determining the major contributors to prediction error, analyses such as those used in this study help guide experiments to more efficiently improve the accuracy of musculoskeletal models, whether considering limbs in rats or humans.
Acknowledgments
This research was supported by NIAMS R01AR053608 (MCT) and NINDS grant R01NS086973 (MCT).
Footnotes
Digital Object Identifier 10.1109/TBME.2017.2775598
Contributor Information
Qi Wei, Qi Wei is with the Department of Bioengineering, George Mason University, Fairfax, VA 22030, USA.
Dinesh K Pai, Dinesh K Pai is with the Department of Computer Science, The University of British Columbia, Vancouver, BC V6T 1Z4, Canada.
Matthew C Tresch, Matthew C Tresch is with the Department of Biomedical Engineering, Department of Physical Medicine and Rehabilitation, Department of Physiology, Northwestern University, Chicago, IL 60611, USA; Shirley Ryan AbilityLab, Chicago, IL 60611, USA.
References
- 1.Arnold EM, Ward SR, Lieber RL, et al. A model of the lower limb for analysis of human movement. Annals of Biomedical Engineering. 2010;38(2):269–279. doi: 10.1007/s10439-009-9852-5. [DOI] [PMC free article] [PubMed] [Google Scholar]
- 2.Eng CM, Smallwood LH, Rainiero MP, et al. Scaling of muscle architecture and fiber types in the rat hindlimb. Journal of Experimental Biology. 2008;211(14):2336–2345. doi: 10.1242/jeb.017640. [DOI] [PubMed] [Google Scholar]
- 3.Holzbaur KRS, Murray WM, Delp SL. A Model of the Upper Extremity for Simulating Musculoskeletal Surgery and Analyzing Neuromuscular Control. Annals of Biomedical Engineering. 2005;33(6):829–840. doi: 10.1007/s10439-005-3320-7. [DOI] [PubMed] [Google Scholar]
- 4.Johnson WL, Jindrich DL, Roy RR, et al. A three-dimensional model of the rat hindlimb: musculoskeletal geometry and muscle moment arms. Journal of biomechanics. 2008;41(3):610–619. doi: 10.1016/j.jbiomech.2007.10.004. 2008. [DOI] [PMC free article] [PubMed] [Google Scholar]
- 5.Valero-Cuevas FJ. Biosystems & biorobotics. Springer; 2016. Fundamentals of neuromechanics; p. 1. online resource (xxiv, 192 pages) [Google Scholar]
- 6.Loeb G, Davoodi R. Musculoskeletal Mechanics and Modeling. Scholarpedia. 2016;11:12389. [Google Scholar]
- 7.Valero-Cuevas FJ, Hoffmann H, Kurse MU, et al. Computational Models for Neuromuscular Function. IEEE Reviews in Biomedical Engineering. 2009;2:110–135. doi: 10.1109/RBME.2009.2034981. [DOI] [PMC free article] [PubMed] [Google Scholar]
- 8.O’Neill MC, Lee LF, Demes B, et al. Three-dimensional kinematics of the pelvis and hind limbs in chimpanzee (Pan troglodytes) and human bipedal walking. Journal of Human Evolution. 2015;86:32–42. doi: 10.1016/j.jhevol.2015.05.012. [DOI] [PubMed] [Google Scholar]
- 9.Benoit DL, Ramsey DK, Lamontagne M, et al. Effect of skin movement artifact on knee kinematics during gait and cutting motions measured in vivo. Gait Posture. 2006;24(2):152–64. doi: 10.1016/j.gaitpost.2005.04.012. [DOI] [PubMed] [Google Scholar]
- 10.Yeo SH, Mullens CH, Sandercock TG, et al. Estimation of musculoskeletal models from in situ measurements of muscle action in the rat hindlimb. The Journal of Experimental Biology. 2011;214(5):735–746. doi: 10.1242/jeb.049163. [DOI] [PMC free article] [PubMed] [Google Scholar]
- 11.Reinbolt JA, Haftka RT, Chmielewski TL, et al. Are Patient-Specific Joint and Inertial Parameters Necessary for Accurate Inverse Dynamics Analyses of Gait? IEEE Transactions on Biomedical Engineering. 2007;54(5):782–793. doi: 10.1109/TBME.2006.889187. [DOI] [PMC free article] [PubMed] [Google Scholar]
- 12.Valero-Cuevas FJ, Johanson ME, Towles JD. Towards a realistic biomechanical model of the thumb: the choice of kinematic description may be more critical than the solution method or the variability/uncertainty of musculoskeletal parameters. Journal of Biomechanics. 2003;36(7):1019–1030. doi: 10.1016/s0021-9290(03)00061-7. [DOI] [PubMed] [Google Scholar]
- 13.Goehler CM, Murray WM. The sensitivity of endpoint forces produced by the extrinsic muscles of the thumb to posture. Journal of Biomechanics. 2010;43(8):1553–1559. doi: 10.1016/j.jbiomech.2010.01.032. [DOI] [PMC free article] [PubMed] [Google Scholar]
- 14.Wohlman SJ, Murray WM. A Biomechanical Model of the Thumb That Effectively Replicates Endpoint Forces Produced by Human Subjects and Measured in Anatomical Specimens. ASME 2012 Summer Bioengineering Conference, Parts A and B. 2012:873–874. [Google Scholar]
- 15.Berniker M, Jarc A, Kording K, et al. A Probabilistic Analysis of Muscle Force Uncertainty for Control. IEEE Transactions on Biomedical Engineering. 2016;63(11):2359–2367. doi: 10.1109/TBME.2016.2531083. [DOI] [PMC free article] [PubMed] [Google Scholar]
- 16.Jarc AM, Berniker M, Tresch MC. FES Control of Isometric Forces in the Rat Hindlimb Using Many Muscles. IEEE Transactions on Biomedical Engineering. 2013;60(5):1422–1430. doi: 10.1109/TBME.2013.2237768. [DOI] [PubMed] [Google Scholar]
- 17.Sandercock TG, Yeo SH, Pai DK, et al. Transducer and base compliance alter the in situ 6 dof force measured from muscle during an isometric contraction in a multi-joint limb. Journal of Biomechanics. 2012;45(6):1017–22. doi: 10.1016/j.jbiomech.2012.01.005. [DOI] [PMC free article] [PubMed] [Google Scholar]
- 18.Sueda S, Kaufman A, Pai DK. Musculotendon Simulation for Hand Animation. SIGGRAPH ‘08. :83:1–83:8. [Google Scholar]
- 19.Delp SL, Anderson FC, Arnold AS, et al. OpenSim: Open-Source Software to Create and Analyze Dynamic Simulations of Movement. IEEE Transactions on Biomedical Engineering. 2007;54(11):1940–1950. doi: 10.1109/TBME.2007.901024. [DOI] [PubMed] [Google Scholar]
- 20.Johnson WL, Jindrich DL, Zhong H, et al. Application of a Rat Hindlimb Model: A Prediction of Force Spaces Reachable Through Stimulation of Nerve Fascicles. IEEE Transactions on Biomedical Engineering. 2011;58(12):3328–3338. doi: 10.1109/TBME.2011.2106784. [DOI] [PMC free article] [PubMed] [Google Scholar]
- 21.Reinbolt JA, Schutte JF, Fregly BJ, et al. Determination of patient-specific multi-joint kinematic models through two-level optimization. Journal of Biomechanics. 2005 Mar;38(3):621–626. doi: 10.1016/j.jbiomech.2004.03.031. [DOI] [PubMed] [Google Scholar]
- 22.Santos VJ, Bustamante CD, Valero-Cuevas FJ. Improving the Fitness of High-Dimensional Biomechanical Models via Data-Driven Stochastic Exploration. IEEE Transactions on Biomedical Engineering. 2009;56(3):552–564. doi: 10.1109/TBME.2008.2006033. [DOI] [PMC free article] [PubMed] [Google Scholar]
- 23.Martelli S, Valente G, Viceconti M, et al. Sensitivity of a subject-specific musculoskeletal model to the uncertainties on the joint axes location. Computer Methods in Biomechanics and Biomedical Engineering. 2015;18(14):1555–63. doi: 10.1080/10255842.2014.930134. [DOI] [PubMed] [Google Scholar]
- 24.Lund ME, Andersen MS, Zee Md, et al. Scaling of musculoskeletal models from static and dynamic trials. International Biomechanics. 2015;2(1):1–11. [Google Scholar]
- 25.Morton NA, Maletsky LP, Pal S, et al. Effect of variability in anatomical landmark location on knee kinematic description. J Orthop Res. 2007;25(9):1221–30. doi: 10.1002/jor.20396. [DOI] [PubMed] [Google Scholar]
- 26.Valente G, Pitto L, Testi D, et al. Are subject-specific musculoskeletal models robust to the uncertainties in parameter identification? PLoS One. 2014;9(11):e112625. doi: 10.1371/journal.pone.0112625. [DOI] [PMC free article] [PubMed] [Google Scholar]
- 27.Muller A, Pontonnier C, Dumont G. Uncertainty propagation in multibody human model dynamics. Multibody System Dynamics. 2017;40(2):177–192. [Google Scholar]
- 28.Hughes RE, An KN. Monte Carlo simulation of a planar shoulder model. Med Biol Eng Comput. 1997 Sep;35(5):544–8. doi: 10.1007/BF02525538. [DOI] [PubMed] [Google Scholar]
- 29.Wohlman SJ, Murray WM. Bridging the gap between cadaveric and in vivo experiments: A biomechanical model evaluating thumb-tip endpoint forces. Journal of Biomechanics. 2013;46(5):1014–1020. doi: 10.1016/j.jbiomech.2012.10.044. [DOI] [PMC free article] [PubMed] [Google Scholar]
- 30.Valero-Cuevas FJ, Towles JD, Hentz VR. Quantification of fingertip force reduction in the forefinger following simulated paralysis of extensor and intrinsic muscles. J Biomech. 2000 Dec;33(12):1601–9. doi: 10.1016/s0021-9290(00)00131-7. [DOI] [PubMed] [Google Scholar]
- 31.Kurse MU, Lipson H, Valero-Cuevas FJ. Extrapolatable analytical functions for tendon excursions and moment arms from sparse datasets. IEEE Trans Biomed Eng. 2012 Jun;59(6):1572–82. doi: 10.1109/TBME.2012.2189771. [DOI] [PMC free article] [PubMed] [Google Scholar]


