

Abstract
Objective
We studied the correlation between motor evoked potentials (MEPs) and early TMS-evoked EEG potentials (TEPs) from single-pulse TMS before and after intermittent Theta Burst Stimulation (iTBS) to the left primary motor cortex (M1) in 17 healthy older participants.
Methods
TMS was targeted to the hand region of M1 using a MRI-guided navigated brain stimulation system and a figure-of-eight biphasic coil. MEPs were recorded from the right first dorsal interosseous muscle using surface EMG. TEPs were extracted from a 61-channel EEG recording. Participants received 90 single TMS pulses at 120% of resting motor threshold before and after iTBS.
Results
Across all participants, the change in N15-P30 TEP and MEP amplitudes were significantly correlated (r=0.69; p < 0.01). Average TEP responses did not change significantly after iTBS, whereas MEP amplitudes showed a significant increase.
Conclusions
Changes in corticospinal reactivity and cortical reactivity induced by iTBS are related. However, the effect of iTBS on TEPs, unlike MEPs, is not straightforward.
Keywords: TMS, iTBS, EMG, EEG, Plasticity, Cortical Excitability, Corticospinal Excitability
1. Introduction
Transcranial Magnetic Stimulation (TMS) is a versatile tool for studying human neurophysiology in vivo (Barker et al., 1985; Hallett, 2007; Rossini and Rossi, 2007). Single TMS pulses applied to the primary motor cortex (M1) can elicit motor evoked potentials (MEPs) in contralateral muscles that can be quantified using surface electromyography (EMG). The amplitude of MEPs averaged across batches of single pulses provides an index of cortico-motor reactivity (Rothwell, 1997). When applied in repetitive trains (repetitive TMS, rTMS) or in specific patterns inspired by synaptic plasticity protocols (theta-burst stimulation, TBS), TMS can produce changes in cortico-motor excitability, indexed by changes in MEP amplitude. Specifically, intermittent TBS (iTBS) has been shown to produce a prolonged facilitation of MEP amplitudes which may reflect synaptic plasticity processes such as long-term potentiation (Huang et al., 2005). However, because TMS effects are typically assessed via MEPs, TMS-based assessments of cortical plasticity have typically been confined to M1. Furthermore, as MEPs are the output of the corticospinal pathway, they may not accurately reflect the cortical changes induced by rTMS and TBS interventions. As an alternative, coupling TMS with encephalography (EEG) allows for the recording of TMS-evoked EEG potentials (TEPs), which may reflect synaptic activity at the surface of the cortex (Ilmoniemi et al., 1997; Komssi et al., 2002). Thus, TEPs provide a potential means to directly assess the cortical response to TMS that does not, at least initially, depend on the cortico-spinal pathway (Ferreri et al., 2011), and can be assessed outside of motor cortex.
Each TEP elicited by a single TMS pulse delivered to M1 is actually comprised of a sequence of negative and positive deflections (N15, P30, N45, P60, N100, P180) labeled for their direction and onset (e.g., N15 refers to negative deflection occurring at 15 ms post stimulus) (Bender et al., 2005; Komssi and Kähkönen, 2006). Although the exact cortical mechanisms of each element of the TEP have not been definitively established, previous studies have suggested that the early components N15 and P30 reflect fast excitatory mechanisms (Mäki and Ilmoniemi, 2010; Rogasch et al., 2013). The N45 is thought to be mediated by the activation of GABA–A receptor, and may also reflect an element of somatosensory return from the targeted muscle (Ferreri et al., 2011; Premoli et al., 2014); furthermore, studies in visual cortex suggest that components around 40 ms are modulated by attentional processes (Herring et al, 2015). The P60 component is believed to reflect somatosensory return (Paus et al., 2001), and the N100 has been associated with the activation of GABA-B receptors (Bonnard et al., 2009; Nikulin et al., 2003; Premoli et al., 2014). The P60, N100 and P180 components are also thought to be contaminated with an auditory evoked potential originated from the TMS pulse click (ter Braack et al., 2013).
Previous studies on somatosensory evoked potentials (SEPs) assessed via intracranial recordings have demonstrated that the conduction time for efferent and afferent signals between the cortex and periphery muscles in healthy individuals is between 20 to 30 ms (Allison et al., 1991). TMS studies have further supported this knowledge by showing that MEPs latencies are consistently in the 20-30 ms range post M1 stimulation in both young (Furby et al., 1992) and elderly (Matamala et al., 2013) healthy individuals. Somatosensory return signals, therefore, are expected to reach the cortex at approximately 40 to 60 ms (twice the conduction time) after M1 stimulation. Since EEG recordings are capable of capturing somatosensory return potentials, the TEPs occurring after 40 ms are likely contaminated by somatosensory returns. Conversely, earlier TEP components like N15 and P30–especially those seen at the motor and pre-motor cortex—are not contaminated by sensory inputs and are more likely to be related to the processes of descending corticospinal activity.
A growing number of studies have sought to describe the relationship between MEPs and TEPs, with somewhat inconsistent results. Mäki and Ilmoniemi (2010) reported a significant positive correlation between TMS-induced MEP amplitudes and the peak-to-peak N15-P30 TEP at the single-trial level within individual subjects. Ferreri et al. (2011) also reported a significant positive correlation between P30 amplitude and single-pulse MEPs across subjects; however, Bonato et al. (2006) reported a similar relationship (r=0.46), but which was not significant given the sample of only 6 subjects. In contrast, no clear correlation with later peaks has been consistently reported.
In addition, a few studies have investigated the relationship of MEPs and TEPs following neuromodulatory interventions, including both conventional rTMS and TBS. Van Der Werf and Paus (2006) reported a significant decrease in N45 amplitude after 1 Hz rTMS of primary motor cortex. However, the authors found no significant change in MEPs, and did not report the correlation between TEP and MEP changes. Casula et al. (2014) reported a significant decrease in MEP amplitude with a significant increase of P60 and N100 following 1Hz rTMS to M1; however, there was no significant correlation between TEP and MEP modulation. Using a continuous TBS (cTBS) protocol shown to reduce MEP amplitude, Vernet et al. (2013) reported a relation between reduction in MEP amplitudes and inhibition of P30, although the significance of this was not explicitly reported. The study also suggested that the main factor predicting the amplitude of MEPs following cTBS is a combination of the different elicited TEPs.
To date, no study has investigated the relationship between MEPs and TEPs following iTBS. Based on the prior literature that iTBS influences the interaction of interneurons and layer-5 pyramidal cells (Huang et al., 2007; Di Lazzaro et al., 2005), we hypothesized that changes in intracortical and corticospinal excitability might be related. Specifically, based on the prior literature reporting that N15-P30 amplitudes are correlated with MEPs within individual subjects (Mäki and Ilmoniemi, 2010) and later components are contaminated by afferent signals, we restricted our investigation to the amplitude of the N15-P30 complex.
Of note, this study was conducted on a population of healthy older individuals (50-80 years old) individuals. Although TMS-evoked EEG measures and plasticity measures are increasingly studied as potential biomarkers in age-related neurodegenerative diseases (Casarotto et al., 2011; Fried et al., 2016; Julkunen et al., 2011; Di Lorenzo et al., 2016), formal evaluation of TEP-MEP in this elderly population has been very limited. Notably, Julkenen and colleagues (2011) reported a decrease in the magnitude of the P30 response in mild cognitive impairment (MCI) and Alzheimer disease (AD) compared to healthy older individuals. However, the correlation of MEPs and TEPs was not reported. To our knowledge, this is the first TMS-EEG study of TBS-induced plasticity in an old healthy cohort.
2. Methods
2.1 Participants
Data acquired from seventeen right-handed healthy older volunteers (8 males and 9 females; mean age 62.8 ± 8.65; range 50-80 years) was analyzed for the present study. The subjects were drawn from the healthy control cohort in a study of iTBS on MEPs in Type-2 diabetes mellitus (Fried et al., 2016) (Subjects were excluded from the analysis if their EEG datasets were incomplete or if records of the visits indicated excessive movement or drowsiness). All participants provided written informed consent. The experiments herein conformed to the Declaration of Helsinki, and the study was approved by the Human Subjects Institutional Review Board of the Beth Israel Deaconess Medical Center. Participants were screened using a TMS exclusion criteria (Rossi et al., 2009), and underwent Mini-Mental Status Examination (MMSE) (Folstein et al., 1975) upon enrollment to confirm normal cognition (MMSE ≥ 27) as part of the inclusion criteria. Participants’ demographic and health information is summarized in Table 1.
Table 1.
Participants’ Demographic.
| Healthy subjects (n=17) |
|
|---|---|
| Gender (m:f) | 8:9 |
| Handedness (r:l:a) | 17:0:0 |
| Age (y) | 62.8 (50 – 80) |
| Mini-Mental State Examination | 29.4 (27 – 30) |
2.2 Experimental Procedure
In a single visit, each participant received three blocks of 30 single pulses of TMS both before and after a 600-pulse regimen of iTBS (Huang et al., 2005)(whereas previous studies suggest that a stable estimate of MEP amplitudes can be obtained with 30 trials (Chang et al. 2016), TEP analysis requires substantially more; three blocks of 30 pulses were collected as a baseline to parallel the post-iTBS data collection process). Prior to TBS, the three blocks of 30 single pulses (baseline) were delivered over approximately 3 minutes per block, with blocks administered approximately 2-5 minutes apart, over a total of approximately 20 minutes. Following TBS, the three blocks of 30 single pulses were delivered at 5, 10 and 20 minutes after TBS. Single pulses of TMS were delivered using a Nexstim eXimia figure-of-eight biphasic coil (Nexstim Ltd., Finland) at 120% of the resting motor thresholds (RMT; 5/10 ≥ 50 μV) of the FDI with a 5000-6000 ms (random jitter) interstimulus interval. Intermittent TBS was delivered using a passive-cooling figure-of-eight coil attached to a MagPro X100 stimulator (MagVenture A/S, Denmark) at 80% of active motor thresholds (AMT; 5/10 ≥ 200 μV during isometric contraction). The iTBS stimulation pattern consisted of a 2 s train of biphasic bursts (3 pulses at 50 Hz) repeated every 200 ms, for a total of 30 pulses per train. Trains were repeated 20 times with an 8 s inter-train interval, for a total of 600 pulses in 192 s. EEG and EMG were recorded continuously during each block of single TMS pulses. The timeline of experimental procedures is summarized in Figure 1. Full details on navigated brain stimulation, electromyography recording, and transcranial magnetic stimulation can be found in Fried et al. (2016).
Figure 1.
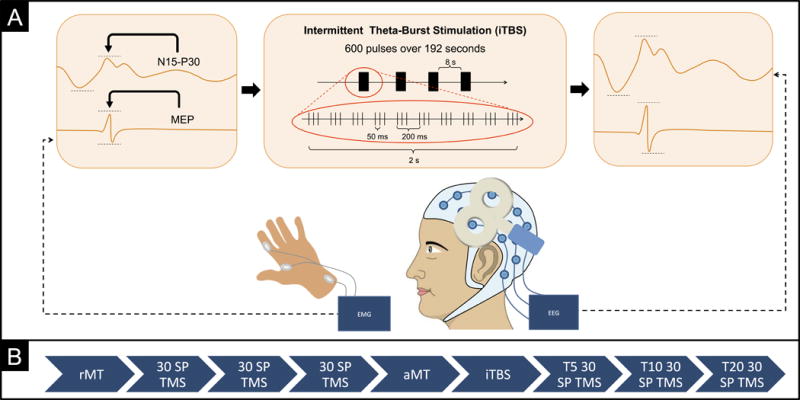
A) This figure shows a schematic overview of experimental procedures. A total of 90 single transcranial magnetic stimulation (TMS) pulses were applied to the left primary motor cortex (M1), eliciting motor evoked potentials (MEPs) recorded from the contralateral hand recorded via electromyography (EMG) and TMS-evoked electroencephalography (EEG) potentials (TEPs) recorded from the scalp via EEG. Average change in MEP and early TEP amplitudes prior and post intermittent theta-burst stimulation (iTBS) were compared. B) This figure displays the timeline of experimental sessions. Following assessment of the resting motor threshold (rMT), three blocks of 30 single TMS pulses were delivered. The active motor threshold (aMT) was then assessed and iTBS was applied after a 5-minute period of rest. Following iTBS, MEPs and TEPs were reassessed in three blocks of 30 pulses at 5, 10, 20 minutes (T5, T10, T20) after stimulation.
2.3 Electroencephalography (EEG)
EEG was recorded with a 61-channel TMS-compatible system (eXimia EEG, Nexstim), which utilizes a sample-and-hold circuit that holds the amplifier input constant from 100 microseconds prestimulus to 2 milliseconds poststimulus to avoid amplifier saturation by TMS. Recordings were referenced and grounded to external electrodes placed on the subject’s forehead, filtered (0.1–500Hz). Two additional electrodes were placed below and lateral to the left eye to monitor ocular artifacts. Impedances were kept below 5kΩ, and sampling frequency was 1450 Hz. Subjects wore earplugs to protect their hearing, and to minimize external noise. Operators monitored subjects for visible signs of drowsiness, and continuously prompted participants to stay awake and keep their eyes open during stimulation and recording.
2.4 EEG Data Processing
Offline EEG data processing was performed semi-automatically with EEGLAB 13.5.4b (Delorme and Makeig, 2004) and customized TMS-EEG processing scripts running in MATLAB R2015b (MathWorks Inc., USA). First, the three blocks of 30 trials were merged to form a single block of 90 trials for the separate pre- and post-iTBS conditions. The merged EEG signal was segmented into epochs starting 1000 ms before the TMS pulse and ending 2000 ms after it, and a baseline correction was applied on an interval of 800 ms (−900 ms to −100 ms) before the pulse for all epochs. Subsequently, the data was visually inspected for removal of excessively noisy channels, with an upper removal limit of 15% total channels (3 ± 2 channels deleted, on average; range 0-6, out of 61). Data was zero-padded between 0 and 14 ms after the pulse to remove the early TMS pulse artifact. Epochs were visually inspected for the removal of excessively noisy epochs, with an upper removal limit of 33% of totals epochs (35 ± 8 epochs deleted, on average; range 21-51, out of 181 ± 2). Next, the pre and post-iTBS blocks were merged in order to run the fast independent component analysis (fICA) function of EEGLAB.
A two-step fICA procedure was applied to avoid inaccurate ICA decompositions caused by large amplitude artifacts, such as TMS-evoked muscle activity. The goal of the first fICA was to exclusively identify and remove early TMS-evoked high-amplitude electrode and muscle artifacts. Once such large amplitude TMS-evoked artifacts were removed, the second round fICA was applied to identify and remove additional artifacts, such as eye blinks, muscle noise, residual TMS pulse artifact, single-electrode noise and other electrical artifacts (Rogasch et al., 2014). In both rounds of fICA, artefactual components were discriminated from neural components through the analysis of their amplitude, frequency, activity power spectrum, scalp map distributions, and time course.
Prior to the first round of fICA, principal component analysis (PCA) was used to compress the data to 40 dimensions to minimize overfitting and noise components. Components were individually inspected and those deemed mostly artefactual were deleted (1 ± 1 components deleted, on average; range 0-3, out of 40). Following the first fICA, the data was then interpolated for missing data (zero-padded period of 0-14 ms after pulse), filtered (forward-backward filtering using second-order Butterworth bandpass filter with lower and upper edges of 1Hz and 100Hz, respectively, and notch filter with lower and upper edges of 55Hz and 65Hz, respectively), and referenced to average. Next, PCA was used to compress the data to 37 dimensions and a second round of fICA was applied. Additional artifactual components were removed. Lastly, the data was interpolated for missing channels and the processed epochs of each participant were averaged into baseline and post-iTBS conditions.
2.5 Temporal and Spatial Region of Interest
We hypothesized that the relationship of MEPs and N15-P30 TEPs would be strongest at the electrodes positioned over the motor and pre-motor regions (e.g., FC3, FC1, FCz, FC2 and FC4). These electrodes, therefore, were defined as our region of interest for investigation. Our focus on bilateral frontocentral electrodes is based on previous studies showing that single-pulse TMS to M1 generates early activation in the region under the TMS coil, which spreads within 30 ms to adjacent motor, premotor and somatosensory as well as the homologous contralateral regions, presumably via callosal projections (Ilmoniemi et al., 1997; Komssi et al., 2002).
For TEPs, our primary analysis focused on the peak-to-peak amplitudes of the N15-P30 complex in the motor region of interest defined above. Our focus on the N15-P30 peak-to-peak amplitude was based on our hypothesis that the N15-P30 component may represent the output of pyramidal neurons induced by TMS (that drives both corticocortical evoked potentials and motor-evoked potentials), as well as on previous studies reporting a positive correlation between TMS induced MEP amplitudes and the N15-P30 TEP at the single-trial level (Mäki and Ilmoniemi, 2010). We specifically also focused on these early components since the 20-30 ms conduction time between the cortex and periphery means that later components such as the N45 and P60 may include somatosensory return, and thus be a secondary measure of MEP effects rather than primary cortical output. Additionally, our primary focus is on changes in the N15-P30 amplitude, since this measure is less likely to be affected by other factors that contribute to inter-subject variability in absolute amplitudes, such as skull-cortex distance or intrinsic differences in subject reactivity to TMS. The N15 and P30 peaks were identified for the average TEPs at the individual subject level, with the N15 peak defined as the minimum voltage between 14-25ms, and the P30 peak defined as the maximum voltage between 25-40 ms.
2.6 Data Analysis
Following EEG data processing, TEP amplitudes were computed semi-automatically using MATLAB. Average TEP amplitudes were calculated at all channels and separately at the region of interest, i.e. the channels over the motor and pre-motor regions (FC3, FC1, FCz, FC2 and FC4). For each of the pre and post-iTBS conditions, peak-to-trough amplitudes of N15-P30 were identified (Figure 2). Changes in N15-P30 TEP amplitude were expressed as log[TEP(post-iTBS)/TEP(pre-iTBS)] for each subject.
Figure 2.

Deflections identified as N15 and P30 (peaking at 14.7 ± 0.61 and 30.5 ± 3.35 on average across subjects) were seen in all TEP responses following M1 stimulation. This figure shows the average TEPs over the region of interest (electrodes FC3, FC1, FCz, FC2 and FC4) for pre and post-iTBS for one subject (pre-iTBS: green; post-iTBS: blue). Average N15-P30 amplitudes were measured peak-to-trough, as indicated by the red lines in the figure, and the changes in N15-P30 amplitude were expressed as the log of the ratio between the N15-P30 post-iTBS amplitude over the N15-P30 pre-iTBS amplitude for each subject. For the subject shown here, there was an increase in the N15-P30 amplitude following iTBS.
Similarly, peak-to-peak amplitudes of all MEPs were calculated automatically by Nexstim software. In parallel to the TEP analysis, MEP trials were averaged into a baseline block and a post-iTBS block. To test the null hypothesis that post-iTBS MEP amplitudes did not differ from baseline, data from the two blocks were entered into a paired-samples t-test using a two-tailed 95% confidence interval. Changes in MEP amplitude were similarly expressed as log[MEP(post-iTBS)/MEP(pre-iTBS)] for each subject. To test the null hypothesis that changes in N15-P30 TEP amplitudes are not related to changes in MEP amplitude, data were entered into a Pearson correlation using a normal distribution and a 95% confidence interval.
A Global Mean Field Power (GMFP) (Lehmann and Skrandies, 1980) analysis was performed to measure total cortical activation induced by TMS, using the following equation
| Equation 1 |
where is the voltage at electrode K at a certain point in time, and is the mean of instantaneous TEP across electrodes. GMFP represents the maximum amplitude of the evoked field, and can be used to measure the global brain response to TMS. A Local Mean Field Power (LMFP) analysis, calculated as the root-mean-square of the responses at the five channels of interest, was also performed to identify local changes in cortical excitability. Finally, to determine if iTBS had any effects at the specific site of stimulation, we assessed changes in the N15-P30 complex at the individual FC3 electrode, which corresponds to the site of stimulation. We also investigated any hemisphere-specific effects by averaging measures from electrodes FC1 and FC3 (corresponding to the hemisphere where stimulation was delivered), and FC2 and FC4 (hemisphere contralateral to the site of the stimulation).
GMFP and LMFP values were calculated for −100 to 300 ms after the TMS pulse, and for each pre and post-iTBS condition. We identified changes across all subjects at the specific time points of the traditional peaks of the M1 TEP (30, 60, 100 and 180ms). In addition, we also identified the individual peaks around 30 and 100 ms at the single subject level (P60 and P180 were not always clearly identifiable), and determined whether there was a change in the amplitude of these individually determined peaks across subjects. The significance of the change in GMFP and LMFP pre and post-iTBS was assessed with paired t tests using a two-tailed 95% confidence interval.
2.7 Age and other brain atrophy factors
Given the possibility that age or some related phenomenon such as brain atrophy might affect TEPs differently than MEPs, a series of multiple linear regression analyses were performed to investigate if the relationship between MEPs and TEPs was influenced by age, cortical thickness (precentral gyrus and central sulcus), or scalp-to-brain distance (over the M1 TMS hotspot).
3. Results
All participants tolerated TMS and iTBS without significant side effects. Results presented below describe (i) the relationship between MEP and N15-P30 amplitudes; (ii) the effect of iTBS on MEP and N15-P30 amplitudes, and (iii) the effect of iTBS on GMFP and LMFP measures.
3.1 Relationship between MEP and N15-P30 amplitudes
Our primary hypothesis was that iTBS-induced changes in N15-P30 amplitude would correlate with changes in peak-to-peak amplitude of MEPs. Average TEP responses for all subjects at all channels for the pre and post-iTBS conditions are displayed in Figure 3A. Deflections identified as N15 and P30 (peaking at 14.6 ± 0.46 and 31.1 ± 3.45 for the pre-iTBS condition and at 14.8 ± 0.74 and 30.5 ± 3.65 for post-iTBS) were identified in the TEPs responses across all subjects over the region of interest. Consistent with our hypothesis, there was a strong and significant correlation between the change in amplitude of MEPs and N15-P30 pre and post-iTBS (r=0.693; p=0.002) (Figure 4C). However, MEP and N15-P30 amplitudes were not significantly correlated at baseline (r=−0.411, p=0.101) or after iTBS (r=−0.153, p=0.558) (Figures 4A and 4B).
Figure 3.

A) Average TMS-evoked EEG potential responses averaged for all subjects at each channel for the pre and post-iTBS conditions (pre-iTBS: green; post-iTBS: blue). The region of interest (ROI) for this study consists of the channels positioned directly over the motor strip (e.g., electrodes FC3, FC1, FCz, FC2 and FC4), which are highlighted in red. B) Mean across-subjects at individual electrodes FC1, FC3, FC2 and FC4, respectively. C, D) FC1 and FC3 are located in the left hemisphere, where stimulation was delivered. D, E) FC2 and FC4 are located in the right hemisphere, contralateral to the site of the stimulation. There was no significant change between pre and post-iTBS N15-P30 measures in any of the four electrodes. F) Mean across-subjects of the across-ROI TEPs highlighting individual N15 and P30 peaks. Average N15-P30 responses did not change significantly after iTBS.
Figure 4.

A) MEP and N15-P30 amplitudes were not significantly correlated at baseline (r=−0.411, p=0.101), B) or after iTBS (r=−0.153, p=0.558). C) A significant positive correlation was found between the change of N15-P30 amplitudes and MEP amplitudes following iTBS over the region of interest (r=0.693; p = 0.002).
3.2 Effect of iTBS on MEP and N15-P30 amplitudes
Average RMT was 46.3 ± 11.7 % of maximum stimulator output, and pre-iTBS average MEP amplitude was 1.253 ± .0650 mV, whereas post-iTBS average MEP amplitude was 1.711 ± 0.894 mV. Pairwise t tests comparing the post-iTBS block with baseline revealed MEP amplitudes were statistically higher post-iTBS (p=0.013; Figure 5). These results are consistent with previous reports of the impact of iTBS on corticospinal reactivity in healthy subjects (Hinder et al., 2014; Huang et al., 2005; Di Lazzaro et al., 2008; Zafar et al., 2008). The average N15-P30 amplitude pre-iTBS across all subjects over the region of interest was 4.6 ± 3.1 μV. Pairwise t tests revealed that average N15-P30 amplitude was not statistically higher at post-iTBS measures (4.1 ± 4.0 μV, p=0.499; Figure 5). Similarly, there were no significant changes in the amplitudes of the individual N15 peak (pre-iTBS −0.7 ± 2.2 μV; post-iTBS −0.4 ± 2.9 μV; p= 0.588) or the P30 peaks (pre-iTBS 3.8 ± 2.1 μV; post-iTBS 3.7 ± 2.0 μV; p= 0.695) (Figure 3F; Supplementary Table S1).
Figure 5.

Average Change in MEP and N15-P30 for All Subjects. For MEPs, the paired-samples t-test revealed MEP amplitudes post-iTBS (1.712 ± 0.895 mV) were statistically greater than baseline (1.253 ± 0.650 mV, p=0.013). For TEPs, the paired-samples t-test revealed that the average N15-P30 amplitude post-iTBS (4.1 ± 4.0 μV) was not significantly different from pre-iTBS (4.6 ± 3.1 μV, p=0.499).
3.3 Effect of iTBS on GMFP and LMFP
GMFP results are shown in Figure 6A. Pairwise t tests revealed that there was no significant change between pre and post-iTBS amplitude measures at the individual time points 30 ms (p=0.929, uncorrected), 60 ms (p=0.379, uncorrected), 100 ms (p=0.968, uncorrected), and 180 ms (p=0.975, uncorrected). There was also no significant change between pre and post-iTBS measures at the individual approximate peaks at 30 ms (p=0.813, uncorrected) and 100 ms (p=0.799, uncorrected). LMFP results are shown in Figure 6B. Pairwise t tests revealed that there was no significant change between pre and post-iTBS measures at the individual time points 30 ms (p=0.949, uncorrected), 60 ms (p=0.247, uncorrected), 100 ms (p=0.693, uncorrected), and 180 ms (p=0.667, uncorrected). There was also no significant change between pre and post-iTBS measures at the individual approximate peaks at 30 ms and 100 ms (p=0.848 and p=0.763, respectively, uncorrected). Moreover, pairwise t tests revealed that there was no significant change between pre and post-iTBS amplitude measures at the individual electrode FC3 (p=0.877, uncorrected), which corresponds to the site of stimulation. There was also no significant change between pre and post-iTBS N15-P30 measures at the hemisphere-specific regions (FC1 and FC3; FC2 and FC4) (Figures 3B-E).
Figure 6.

A) Global Mean Field Power (GMFP) graph displaying the total cortical activation induced by TMS across all electrodes. There was no significant effect of iTBS at any time point. B) Local Mean Field Power (LMFP) graph displaying EEG activity in the region of interest (electrodes FC3, FC1, FCz, FC2 and FC4). There was no significant effect of iTBS.
3.4 Age and other brain atrophy factors
Follow-up linear regression analyses demonstrated log(MEPPost/Pre) remained a significant predictor of log(TEPPost/Pre) (p’s < 0.005) after controlling for age, motor cortex thickness, or scalp-to-brain distance. Supplementary Table S2 lists the significance of each covariate as a predictor of log(TEPPost/Pre), as well as changes in the regression coefficient of the model, and the significance and beta coefficient of log(MEPPost/Pre) (β1) after adding each covariate. None of the covariates contributed significantly to the model (p’s > 0.4), nor did they change the β1 by more than 3%, suggesting none of these factors had an impact on the relationship between log(TEPPost/Pre) and log(MEPPost/Pre).
4. Discussion
In this study, we compared changes in MEP amplitudes and the N15-P30 TEP amplitudes following iTBS to left M1 in 17 healthy older participants. We found that iTBS over left M1 induces changes in MEP amplitude that correlate with changes in the N15-P30 TEP amplitude over the motor and pre-motor electrodes in individual subjects. These findings support our hypothesis that neuromodulatory interventions such as iTBS might influence cortical circuits, resulting in related changes in both intracortical and corticospinal excitability. Our secondary hypothesis was that TEP amplitudes would change significantly following iTBS. Contrary to our hypothesis, although iTBS did facilitate MEPs at the group level, there were no significant effects of iTBS on the amplitude of the early components of the TEPs across subjects. All findings and conclusions presented here are restricted to the old healthy population.
Previous studies evaluating the correlation between TEPs and MEPs have had mixed results. A positive correlation has been reported between TMS induced MEP amplitudes and the N15-P30 TEP at the single-trial level within subjects (Mäki and Ilmoniemi, 2010). Across subjects, some studies have reported a significant correlation between absolute P30 amplitudes and MEP amplitudes (Ferreri et al., 2011), whereas others have not (Bonato et al., 2006; Rogasch et al., 2013). The strengths of this study over prior investigations include a fairly large sample size, the use of MRI-guided stimulation to ensure accurate and stable targeting, and an appropriate number of single TMS pulses for optimal consistency of MEPs (Chang et al., 2016). Furthermore, as these TMS-EMG-EEG measures are increasingly being used to investigate neurological and psychiatric diseases, such as Alzheimer’s disease, Parkinson’s disease, and stroke, that are more prevalent with advancing age, the study was conducted in a population whose demographics more closely match those populations of interest. While we believe this is a strength of the present study, it does limit the generalizability of the findings.
In our study, there was no significant correlation between the N15-P30 and MEP amplitudes across subjects at baseline. There are a number of plausible hypotheses for the lack of such a correlation; for example, there may be a non-linear relationship between EEG potentials and MEPs (as suggested by prior studies reporting clear TMS-evoked EEG potentials even at intensities well below those that generate MEPs (Kähkönen et al., 2004)); the N15-P30 complex and MEPs may be generated by different pools of neurons; or MEP and TEP amplitudes may be affected by different non-cerebral factors (e.g. spinal, motor neuron or muscle excitability for MEPs; scalp-cortex distance or skull thickness for TEPs).
Previous studies have also investigated correlates of MEPs and TEPs following neuromodulatory interventions. Changes in MEPs with paired-pulse stimulation have been associated with changes in P30 amplitude (Ferreri et al., 2011; Rogasch et al., 2013). Using a slightly modified cTBS protocol, Vernet and et al. (2013) reported a relationship between inhibition in MEPs and inhibition of P30. The study also suggested that the main factor predicting the amplitude of MEPs following cTBS is a combination of the different elicited TEPs. Consistent with the above findings, we find that across subjects, iTBS-induced changes in N15-P30 amplitudes are correlated with iTBS-induced enhancement of MEPs. These results are consistent with the notion that changes in cortical excitability, as indexed via changes in TEP amplitudes, are correlated with changes in corticospinal excitability, as indexed via MEP changes.
In line with previous studies (Hinder et al., 2014; Huang et al., 2005; Di Lazzaro et al., 2008; Zafar et al., 2008), our investigaton showed that iTBS induced changes in MEP amplitudes that were variable among individuals, but significantly higher than baseline at the group level. Conversely, while N15-P30 TEP responses were also variable across individuals, we did not find a significant change in the average N15-P30 TEP amplitude following iTBS. A potential explanation for this result is that the range of possible TEP changes is smaller than the range of possible MEP changes, i.e. the distributions are shifted/skewed for MEPs but not for TEPs, resulting in bigger effects on MEP amplitudes than on TEPs. As previously mentioned, another possibility is that the relationship between TEPs and MEPs is nonlinear, such that while changes between the two are correlated, absolute amplitudes are not. A third possibility is that iTBS is changing cortical dynamics in a manner that does not result in changes in the mean amplitude of the TMS-evoked EEG potentials. It is also possible that state-related changes in TMS-EEG properties (e.g. due to fatigue) could be shifting the mean of the evoked response in one direction, while iTBS could be shifting it in the opposite direction, resulting in no net change. Another possibility is that modulation of MEPs in healthy older adults may involve changes in subcortical excitability or depend on later cortical contributions, not captured by the early TEP components. Future studies will help test these various hypotheses. Of note, noise masking was not used in this study and thus auditory evoked potentials could contaminate the later TMS-EEG components (N50-P180). However, this does not influence our results in the N15-P30.
The effect of iTBS on MEP has not been shown to be altered in healthy older adults (Dickins et al., 2015), though Freitas et al. (2011) did find advancing age was associated with a reduced effect of cTBS. To our knowledge, no study has explored the relationship between age and TBS effects on TEPs, though several studies have looked at rs-EEG measures in older adults. While it is possible that age or some related phenomenon such as brain atrophy might cause TBS to affect TEPs differently than MEPs the follow-up multiple regression analyses demonstrated that the inclusion of age, cortical thickness, or scalp-to-brain distance did not change the underlying relationship between iTBS-induced changes in MEPs and TEPs, nor were any of the variables a significant predictor of TEP changes (Supplementary Table S2). Thus, we can conclude that age and cortical atrophy could not account for the relationship that we saw. Future studies should assess if the MEP-TEP relationship that we see in our study is also seen in younger populations.
The present study has important implications, as it suggests that TMS-EEG measures could be used to evaluate the effects of neuromodulatory TMS protocols on cortical excitability in regions in which conventional MEP measures are not available, such as DLPFC. However, more studies are needed to identify the optimal TEP components to assess. Future studies could compare TMS effects in motor cortex and DLPFC in individual subjects, and correlate EEG effects with changes in other measures such as BOLD functional MRI (Bestmann et al., 2005; Eldaief et al., 2011) and behavior to determine the relationship between TMS effects in these various domains. The present analysis should also be expanded to other stimulation protocols that are believed to modulate cortical excitability, such as rTMS, cTBS, paired associative stimulation (PAS), and transcranial direct current stimulation (tDCS).
Supplementary Material
Significance.
Our findings help elucidate the relationship between changes in cortical and corticospinal excitability in healthy older individuals. Going forward, TEPs may be used to evaluate the effects of theta-burst stimulation in non-motor brain regions.
Highlights.
TMS-EEG enables the assessment of cortical plasticity through the analysis of TMS-evoked EEG potentials (TEPs).
Changes in early TEPs correlate significantly with changes in motor evoked potentials (MEPs) following intermittent theta-burst stimulation (iTBS) over motor cortex.
TBS-induced changes in MEPs and TEPs show inter-subject variability in healthy elderly individuals.
Acknowledgments
This study was funded by a grant from the National Institutes of Health (NIH; R21 NS082870). Dr. Pascual-Leone was also supported in part by the Sidney R. Baer Jr. Foundation, the Broad Institute at MIT and Harvard, the NIH (R01HD069776, R01NS073601, R21 MH099196, R21 NS085491, R21 HD07616), and Harvard Catalyst | The Harvard Clinical and Translational Science Center (NCRR and the NCATS NIH, UL1 RR025758). Dr. Mouhsin Shafi is supported in part by Citizens United for Research in Epilepsy (CURE), the Broad Institute at MIT and Harvard, and the NIH (R01NS073601).
Abbreviations
- TMS
Transcranial Magnetic Stimulation
- EMG
Electromyography
- EEG
Encephalography
- MEPs
Motor-evoked potentials
- TEPs
TMS-evoked EEG potentials
- M1
primary motor cortex
- TBS
Theta Burst Stimulation
- fICA
fast independent component analysis
- RMT
resting motor threshold
- AMT
active motor threshold
Footnotes
The content is solely the responsibility of the authors and does not necessarily represent the official views of Harvard Catalyst, Harvard University and its affiliated academic health care centers, the National Institutes of Health, the Broad Institute at MIT and Harvard, or the Sidney R. Baer Jr. Foundation. Ms. T. Gedankien reports no disclosures. Dr. P.J. Fried reports no disclosures. Dr. A. Pascual-Leone serves on the scientific advisory boards for Nexstim, Starlab Neuroscience, Neuroelectrics, Constant therapy, Novavision, and Neosync; and is listed as an inventor on several issued and pending patents on the real-time integration of transcranial magnetic stimulation with electroencephalography and magnetic resonance imaging.
Conflict of Interest Statement
Dr. M. Shafi reports no disclosures. The authors declare no competing interests.
References
- Allison T, McCarthy G, Wood CC, Jones SJ. Potentials evoked in human and monkey cerebral cortex by stimulation of the median nerve. A review of scalp and intracranial recordings. Brain. 1991:2465–503. doi: 10.1093/brain/114.6.2465. [DOI] [PubMed] [Google Scholar]
- Barker AT, Jalinous R, Freeston IL. Non-invasive magnetic stimulation of human motor cortex. Lancet. 1985;1:1106–7. doi: 10.1016/s0140-6736(85)92413-4. [DOI] [PubMed] [Google Scholar]
- Bender S, Basseler K, Sebastian I, Resch F, Kammer T, Oelkers-Ax R, et al. Electroencephalographic response to transcranial magnetic stimulation in children: Evidence for giant inhibitory potentials. Ann Neurol. 2005;58:58–67. doi: 10.1002/ana.20521. [DOI] [PubMed] [Google Scholar]
- Bestmann S, Baudewig J, Siebner HR, Rothwell JC, Frahm J. BOLD MRI responses to repetitive TMS over human dorsal premotor cortex. Neuroimage. 2005;28:22–9. doi: 10.1016/j.neuroimage.2005.05.027. [DOI] [PubMed] [Google Scholar]
- Bonato C, Miniussi C, Rossini PM. Transcranial magnetic stimulation and cortical evoked potentials: A TMS/EEG co-registration study. Clin Neurophysiol. 2006;117:1699–707. doi: 10.1016/j.clinph.2006.05.006. [DOI] [PubMed] [Google Scholar]
- Bonnard M, Spieser L, Meziane HB, de Graaf JB, Pailhous J. Prior intention can locally tune inhibitory processes in the primary motor cortex: direct evidence from combined TMS-EEG. Eur J Neurosci. 2009;30:913–23. doi: 10.1111/j.1460-9568.2009.06864.x. [DOI] [PubMed] [Google Scholar]
- ter Braack EM, de Jonge B, van Putten MJAM. Reduction of TMS Induced Artifacts in EEG Using Principal Component Analysis. IEEE Trans Neural Syst Rehabil Eng. 2013;21:376–82. doi: 10.1109/TNSRE.2012.2228674. [DOI] [PubMed] [Google Scholar]
- Casarotto S, Määttä S, Herukka S-K, Pigorini A, Napolitani M, Gosseries O, et al. Transcranial magnetic stimulation-evoked EEG/cortical potentials in physiological and pathological aging. Neuroreport. 2011;22:592–7. doi: 10.1097/WNR.0b013e328349433a. [DOI] [PubMed] [Google Scholar]
- Casula EP, Tarantino V, Basso D, Arcara G, Marino G, Toffolo GM, et al. Low-frequency rTMS inhibitory effects in the primary motor cortex: Insights from TMS-evoked potentials. Neuroimage. 2014;98:225–32. doi: 10.1016/j.neuroimage.2014.04.065. [DOI] [PubMed] [Google Scholar]
- Chang WH, Fried PJ, Saxena S, Jannati A, Gomes-Osman J, Kim Y-H, et al. Optimal number of pulses as outcome measures of neuronavigated transcranial magnetic stimulation. Clin Neurophysiol. 2016b;127:2892–7. doi: 10.1016/j.clinph.2016.04.001. [DOI] [PMC free article] [PubMed] [Google Scholar]
- Delorme A, Makeig S. EEGLAB: an open source toolbox for analysis of single-trial EEG dynamics including independent component analysis. J Neurosci Methods. 2004;134:9–21. doi: 10.1016/j.jneumeth.2003.10.009. [DOI] [PubMed] [Google Scholar]
- Dickins DSE, Sale MV, Kamke MR. Plasticity Induced by Intermittent Theta Burst Stimulation in Bilateral Motor Cortices Is Not Altered in Older Adults. Neural Plast. 2015;2015:1–9. doi: 10.1155/2015/323409. [DOI] [PMC free article] [PubMed] [Google Scholar]
- Eldaief MC, Halko MA, Buckner RL, Pascual-Leone A. Transcranial magnetic stimulation modulates the brain’s intrinsic activity in a frequency-dependent manner. Proc Natl Acad Sci. 2011;108:21229–34. doi: 10.1073/pnas.1113103109. [DOI] [PMC free article] [PubMed] [Google Scholar]
- Ferreri F, Pasqualetti P, Määttä S, Ponzo D, Ferrarelli F, Tononi G, et al. Human brain connectivity during single and paired pulse transcranial magnetic stimulation. Neuroimage. 2011;54:90–102. doi: 10.1016/j.neuroimage.2010.07.056. [DOI] [PubMed] [Google Scholar]
- Folstein MF, Folstein SE, McHugh PR. “Mini-mental state” A practical method for grading the cognitive state of patients for the clinician. J Psychiatr Res. 1975;12:189–98. doi: 10.1016/0022-3956(75)90026-6. [DOI] [PubMed] [Google Scholar]
- Freitas C, Perez J, Knobel M, Tormos JM, Oberman L, Eldaief M, et al. Changes in Cortical Plasticity Across the Lifespan. Front Aging Neurosci. 2011;3:5. doi: 10.3389/fnagi.2011.00005. [DOI] [PMC free article] [PubMed] [Google Scholar]
- Fried PJ, Schilberg L, Brem A-K, Saxena S, Wong B, Cypess AM, et al. Humans with Type-2 Diabetes Show Abnormal Long-Term Potentiation-Like Cortical Plasticity Associated with Verbal Learning Deficits. J Alzheimer’s Dis. 2016;55:89–100. doi: 10.3233/JAD-160505. [DOI] [PMC free article] [PubMed] [Google Scholar]
- Furby A, Bourriez JL, Jacquesson JM, Mounier-Vehier F, Guieu JD. Motor evoked potentials to magnetic stimulation: technical considerations and normative data from 50 subjects. J Neurol. 1992;239:152–6. doi: 10.1007/BF00833916. [DOI] [PubMed] [Google Scholar]
- Hallett M. Transcranial Magnetic Stimulation: A Primer. Neuron. 2007;55:187–99. doi: 10.1016/j.neuron.2007.06.026. [DOI] [PubMed] [Google Scholar]
- Herring JD, Thut G, Jensen O, Bergmann TO. Attention Modulates TMS-Locked Alpha Oscillations in the Visual Cortex. J Neurosci. 2015;35:14435–47. doi: 10.1523/JNEUROSCI.1833-15.2015. [DOI] [PMC free article] [PubMed] [Google Scholar]
- Hinder MR, Goss EL, Fujiyama H, Canty AJ, Garry MI, Rodger J, et al. Inter- and Intra-individual Variability Following Intermittent Theta Burst Stimulation: Implications for Rehabilitation and Recovery. Brain Stimul. 2014;7:365–71. doi: 10.1016/j.brs.2014.01.004. [DOI] [PubMed] [Google Scholar]
- Huang Y-Z, Chen R-S, Rothwell JC, Wen H-Y. The after-effect of human theta burst stimulation is NMDA receptor dependent. Clin Neurophysiol. 2007;118:1028–32. doi: 10.1016/j.clinph.2007.01.021. [DOI] [PubMed] [Google Scholar]
- Huang Y-Z, Edwards MJ, Rounis E, Bhatia KP, Rothwell JC. Theta Burst Stimulation of the Human Motor Cortex. Neuron. 2005;45:201–6. doi: 10.1016/j.neuron.2004.12.033. [DOI] [PubMed] [Google Scholar]
- Ilmoniemi RJ, Virtanen J, Ruohonen J, Karhu J, Aronen HJ, Näätänen R, et al. Neuronal responses to magnetic stimulation reveal cortical reactivity and connectivity. Neuroreport. 1997;8:3537–40. doi: 10.1097/00001756-199711100-00024. [DOI] [PubMed] [Google Scholar]
- Julkunen P, Jauhiainen AM, Könönen M, Pääkkönen A, Karhu J, Soininen H. Combining transcranial magnetic stimulation and electroencephalography may contribute to assess the severity of Alzheimer’s disease. Int J Alzheimers Dis. 2011;2011:654794. doi: 10.4061/2011/654794. [DOI] [PMC free article] [PubMed] [Google Scholar]
- Kähkönen S, Wilenius J, Komssi S, Ilmoniemi RJ. Distinct differences in cortical reactivity of motor and prefrontal cortices to magnetic stimulation. Clin Neurophysiol. 2004;115:583–8. doi: 10.1016/j.clinph.2003.10.032. [DOI] [PubMed] [Google Scholar]
- Komssi S, Aronen HJ, Huttunen J, Kesäniemi M, Soinne L, Nikouline VV, et al. Ipsi- and contralateral EEG reactions to transcranial magnetic stimulation. Clin Neurophysiol. 2002;113:175–84. doi: 10.1016/S1388-2457(01)00721-0. [DOI] [PubMed] [Google Scholar]
- Komssi S, Kähkönen S. The novelty value of the combined use of electroencephalography and transcranial magnetic stimulation for neuroscience research. Brain Res Rev. 2006;52:183–92. doi: 10.1016/j.brainresrev.2006.01.008. [DOI] [PubMed] [Google Scholar]
- Di Lazzaro V, Pilato F, Dileone M, Profice P, Oliviero A, Mazzone P, et al. The physiological basis of the effects of intermittent theta burst stimulation of the human motor cortex. J Physiol. 2008;586:3871–9. doi: 10.1113/jphysiol.2008.152736. [DOI] [PMC free article] [PubMed] [Google Scholar]
- Di Lazzaro V, Pilato F, Saturno E, Oliviero A, Dileone M, Mazzone P, et al. Theta-burst repetitive transcranial magnetic stimulation suppresses specific excitatory circuits in the human motor cortex. J Physiol. 2005;565:945–50. doi: 10.1113/jphysiol.2005.087288. [DOI] [PMC free article] [PubMed] [Google Scholar]
- Lehmann D, Skrandies W. Reference-free identification of components of checkerboard-evoked multichannel potential fields. Electroencephalogr Clin Neurophysiol. 1980;48:609–21. doi: 10.1016/0013-4694(80)90419-8. [DOI] [PubMed] [Google Scholar]
- Di Lorenzo F, Ponzo V, Bonnì S, Motta C, Negrão Serra PC, Bozzali M, et al. Long-term potentiation-like cortical plasticity is disrupted in Alzheimer’s disease patients independently from age of onset. Ann Neurol. 2016;80:202–10. doi: 10.1002/ana.24695. [DOI] [PubMed] [Google Scholar]
- Mäki H, Ilmoniemi RJ. The relationship between peripheral and early cortical activation induced by transcranial magnetic stimulation. Neurosci Lett. 2010;478:24–8. doi: 10.1016/j.neulet.2010.04.059. [DOI] [PubMed] [Google Scholar]
- Matamala JM, Núñez C, Lera L, Verdugo RJ, Sánchez H, Albala C, et al. Motor evoked potentials by transcranial magnetic stimulation in healthy elderly people. Somatosens Mot Res. 2013;30:201–5. doi: 10.3109/08990220.2013.796922. [DOI] [PubMed] [Google Scholar]
- Nikulin VV, Kicić D, Kähkönen S, Ilmoniemi RJ. Modulation of electroencephalographic responses to transcranial magnetic stimulation: evidence for changes in cortical excitability related to movement. Eur J Neurosci. 2003;18:1206–12. doi: 10.1046/j.1460-9568.2003.02858.x. [DOI] [PubMed] [Google Scholar]
- Paus T, Sipila PK, Strafella AP. Synchronization of neuronal activity in the human primary motor cortex by transcranial magnetic stimulation: an EEG study. J Neurophysiol. 2001;86:1983–90. doi: 10.1152/jn.2001.86.4.1983. [DOI] [PubMed] [Google Scholar]
- Premoli I, Castellanos N, Rivolta D, Belardinelli P, Bajo R, Zipser C, et al. TMS-EEG Signatures of GABAergic Neurotransmission in the Human Cortex. J Neurosci. 2014;34:5603–12. doi: 10.1523/JNEUROSCI.5089-13.2014. [DOI] [PMC free article] [PubMed] [Google Scholar]
- Rogasch NC, Daskalakis ZJ, Fitzgerald PB. Mechanisms underlying long-interval cortical inhibition in the human motor cortex: a TMS-EEG study. J Neurophysiol. 2013;109:89–98. doi: 10.1152/jn.00762.2012. [DOI] [PubMed] [Google Scholar]
- Rogasch NC, Thomson RH, Farzan F, Fitzgibbon BM, Bailey NW, Hernandez-Pavon JC, et al. Removing artefacts from TMS-EEG recordings using independent component analysis: Importance for assessing prefrontal and motor cortex network properties. Neuroimage. 2014;101 doi: 10.1016/j.neuroimage.2014.07.037. [DOI] [PubMed] [Google Scholar]
- Rossi S, Hallett M, Rossini PM, Pascual-Leone A. Safety, ethical considerations, and application guidelines for the use of transcranial magnetic stimulation in clinical practice and research. Clin Neurophysiol. 2009;120:2008–39. doi: 10.1016/j.clinph.2009.08.016. [DOI] [PMC free article] [PubMed] [Google Scholar]
- Rossini PM, Rossi S. Transcranial magnetic stimulation: diagnostic, therapeutic, and research potential. Neurology. 2007;68:484–8. doi: 10.1212/01.wnl.0000250268.13789.b2. [DOI] [PubMed] [Google Scholar]
- Rothwell JC. Techniques and mechanisms of action of transcranial stimulation of the human motor cortex. J Neurosci Methods. 1997;74:113–22. doi: 10.1016/s0165-0270(97)02242-5. [DOI] [PubMed] [Google Scholar]
- Vernet M, Bashir S, Yoo W-K, Perez JM, Najib U, Pascual-Leone A. Insights on the neural basis of motor plasticity induced by theta burst stimulation from TMS-EEG. Eur J Neurosci. 2013;37:598–606. doi: 10.1111/ejn.12069. [DOI] [PMC free article] [PubMed] [Google Scholar]
- Van Der Werf YD, Paus T. The neural response to transcranial magnetic stimulation of the human motor cortex. I. Intracortical and cortico-cortical contributions. Exp Brain Res. 2006;175:231–45. doi: 10.1007/s00221-006-0551-2. [DOI] [PubMed] [Google Scholar]
- Zafar N, Paulus W, Sommer M. Comparative assessment of best conventional with best theta burst repetitive transcranial magnetic stimulation protocols on human motor cortex excitability. Clin Neurophysiol. 2008;119:1393–9. doi: 10.1016/j.clinph.2008.02.006. [DOI] [PubMed] [Google Scholar]
Associated Data
This section collects any data citations, data availability statements, or supplementary materials included in this article.