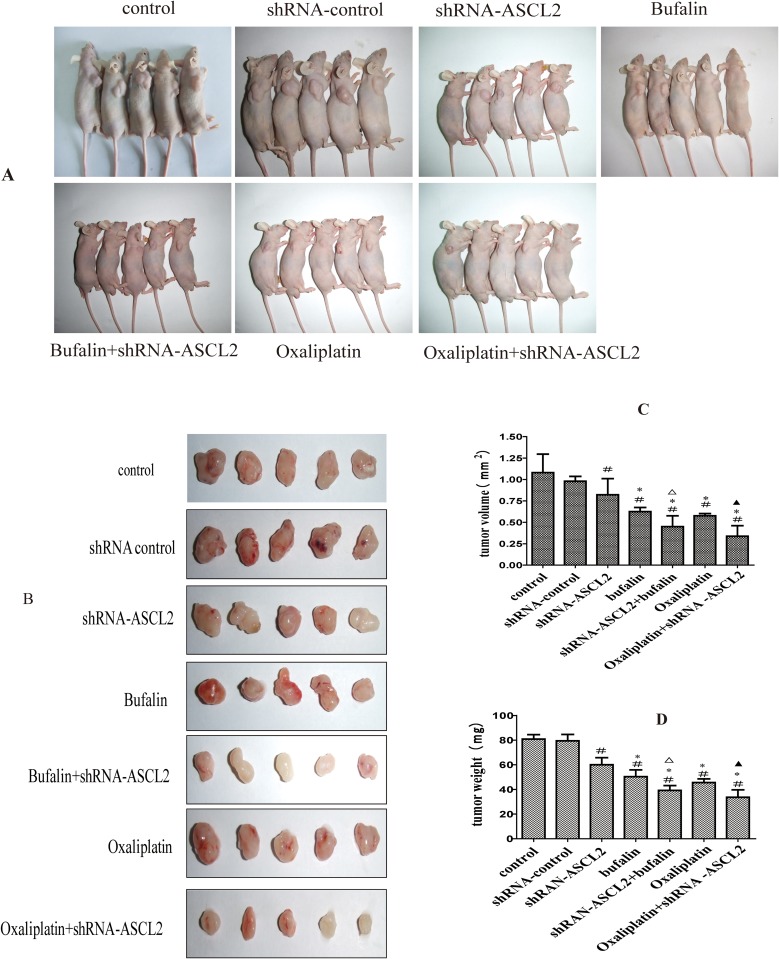
Figure 5.
The effect of bufalin on tumorigenic activity (A) Subcutaneous transplant model in nude mice. (B) Tumors extracted after subcutaneous growth. (C) Tumor volume of each group. (D) Tumor weight of each group. #P<0.01 compared with the control group, *P<0.05 compared with the shRNA-ASCL2 group, ΔP<0.05 compared with the bufalin group, ▲P<0.01 compared with the oxaliplatin group.

