Abstract
Purpose
Long non-coding RNA colon cancer-associated transcript-1 (CCAT1) is newly found to be related with diagnoses and prognosis of cancer. This meta-analysis was performed to investigate the relationship between CCAT1 expression and clinical parameters, including survival condition, lymph node metastasis and tumor node metastasis grade.
Materials and Methods
The primary literatures were collected through initial search criteria from electronic databases, including PubMed, OVID Evidence-based medicine Reviews and others (up to May 12, 2017). Eligible studies were identified and selected by the inclusion and exclusion criteria. Data was extracted and computed into Hazard ratio (HR) for the assessment of overall survival, subgroup analyses were prespecified based on the digestive tract cancer or others. Analysis of different CCAT1 expression related with lymph node metastasis or tumor node metastasis grade was conducted. Risk of bias was assessed by the Newcastle-Ottawa Scale.
Results
9 studies were included. This meta-analysis showed that high CCAT1 expression level was related to poor overall survival, the pooled HR was 2.42 (95% confidence interval, CI: 1.86-3.16; P < 0.001; fix- effects model), similarly in the cancer type subgroups: digestive tract cancer (HR, 2.42; 95% CI, 1.79–3.29; P < 0.001; fix- effects model) and others (HR, 2.42; 95% CI, 1.42–4.13; P = 0.001; fix- effects model). The analysis showed that high CCAT1 was strongly related to positive lymph node metastasis (Odds ratio, OR: 3.24; 95% CI, 2.04-5.16; P < 0.001; fix- effects model), high tumor node metastasis stage (OR, 3.87; 95% CI, 2.53–5.92; P < 0.001; fix- effects model).
Conclusions
In conclusion, this meta-analysis revealed that CCAT1 had potential as a diagnostic and prognostic biomarker in various cancers.
Keywords: long non-coding RNA, CCAT1, overall survival, lymph node metastasis, tumor node metastasis grade
INTRODUCTION
Cancers become a major public health problem with a leading cause of morbidity and mortality [1]. Although with the new and systemic therapies used for cancer, patients suffer from an enormous financial burden and the benefit is relatively small [2]. Delays in the diagnosis of cancer, patients unfortunately miss optimal opportunity for treatment, have poorer quality of life, less chance of surviving and more expensive costs [2–4]. Therefore, to explore a way for early detection of cancer is critical to prognosis and treatment.
Recent advances in epigenetic research have found that epigenetic regulation activates the development of cancer [5]. Detection of early epigenetic changes is an attractive tool to screen and diagnose cancer early, with early appearance of epigenetic alternations and their potential biomarkers in cancer [6]. Studies have showed that epigenetic alternations in various cancer result from epigenetic activated processes of long non-coding RNAs (lncRNAs) [7]. LncRNAs are often described as non-coding transcripts more than 200 nucleotides in length [8]. LncRNAs expression profiles are recognized as signals of cellular states and programs especially in cancer [9]. In recent years, colon cancer-associated transcript-1 (CCAT1) is a rising star of oncogenic lncRNAs associated with various cancers.
CCAT1 activates cancer cell proliferation, migration and invasion, with 2628 base pairs in length located on chromosome 8q24.21 [10]. The expression of CCAT1 is significantly higher in cancer samples compared with adjacent normal samples [11]. The overexpression of CCAT1 has been identified as key activated in initiation and progression of cancers, such as cholangiocarcinoma (CCA) [12], esophageal squamous cell carcinoma (ESCC) [13], hepatocellular carcinoma (HCC) [14–16], melanoma (MEL) [17], gastric cancer (GC) [18], breast cancer (BRC) [19], colon cancer (CC) [20]. The deregulation of CCAT1 is closely related to clinical parameters, including overall survival (OS), lymph node metastasis (LNM) and tumor node metastasis (TNM) grade. CCAT1 have been found to be consistently overexpressed in relevant cancers and may serve as a prognostic biomarker to evaluate clinical outcomes. Recently most studies about CCAT1 just have reported a unique type of cancer, however, there have not been any studies systemically to review the relationship between deregulation of CCAT1 and clinical prognosis. We therefore perform the meta-analysis to evaluate clinical prognosis for different CCAT1 expression in cancers.
MATERIALS AND METHODS
Literature search
The relevant studies were searched from electronic databases of PubMed, OVID Evidence-based medicine Reviews, Cochrane Library and China National Knowledge Infrastructure (CNKI) in May 2017. The following terms were used: “CCAT1 or colon cancer associated transcript-1” and “cancer or tumor or carcinomas or neoplasm”. The last update of searching time was May 12, 2017. All full-text articles were obtained according to citation lists of retrieved articles.
Inclusion and exclusion criteria
Inclusion criteria
To be included in this meta-analysis, studies had to met the following criteria: (1) Studies expressing an association between different expression levels of CCAT1 and prognosis of cancer patients; (2) Cancer patients was confirmed pathologically and never undergone chemotherapy and radiotherapy; (3) Relevant clinical variables such as LNM, TNM and OS for outcomes were reported; (4) Relevant data was extractable to perform the meta-analysis.
Exclusion criteria
Exclusion criteria are as the following: (1) Studies failed to meet the inclusion criteria; (2) Editorials, letters, case reports, expert opinions, abstracts and reviews, animal experiment studies; (3) Duplicate publications.
Data extraction
From the included studies, data was collected and organized independently by two of authors (Zhihui Zhang, Haibiao Xie), divergences were come to an agreement by another two of authors (Qiang Qi, Xinjian Yang). The primary characteristics were collected from each included study: cancer types, total numbers of patients, number of patients in high CCAT1 expression group or in low CCAT1 expression group, number of patients with positive LNM or negative LNM, number of patients in high TNM stage (HTS) or in low TNM stage (LTS), survival analysis, hazard ratios (HRs) and corresponding 95% CI for OS. In the absence of HR, the data was extracted from relevant figures of survival curve (SC). The secondary characteristics as follows: first author, publication date, country of origin, detection method and cut-off of CCAT1 expression levels, multivariate analysis and follow-up months.
Quality assessment
Quality of primary studies was assessed by the Newcastle-Ottawa Scale (NOS), a score of 0-8 was evaluated each studies. Six or more scores was of high quality. All of these were carried out independently by two of authors (Daqiang Liang and Feiguo Liang), any disagreement was resolved in conference by two of authors (Lanbing Huang and Xinjian Yang).
Statistical methods
Chi-square test was used to evaluate the heterogeneity for HRs between studies. If I2 < 50 and P(H) > 0.1, there was in absence of heterogeneity between studies, thus, the fixed-effects model was adopted. In contrast, the random-effects model was applied. Pooled HR with 95% confidence interval (CI) was calculated to describe survival situation comparing high CCAT1 expression group and low CCAT1 expression group. Funnel plots and Egger's test were adopted to assess the potential publication bias. Sensitivity analysis was performed to test the stability of the meta-analysis results. Furthermore, analysis of different CCAT1 expression related with LNM or TNM stage was conducted. Meta-analysis is performed by using the Stata12.0 with the level of significance set at 0.1%.
RESULTS
Studies selected
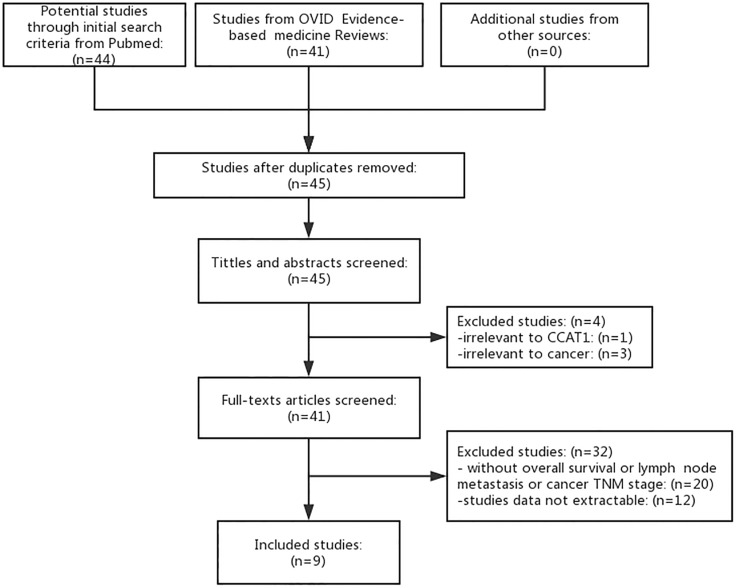
Forty-five articles were identified individually which met the initial search criteria. With all full-texts articles screened, we included nine eligible articles in the final analysis (Figure 1). The exclusions didn't cover extractable data of survival outcomes, LNM or TNM stage.
Figure 1. Flowchart of studies searched, selected, included and excluded.
The other sources means Cochrane Library and China National Knowledge Infrastructure (CNKI).
Characteristics of included studies
These nine studies published time were from 2014 to 2017, which were all from China. A total of 573 patients were included (range from 30 to 92). Not all these studies covered all of OS, LNM and TNM. Among these nine studies, seven studies covered OS, five studies covered LNM, six studies covered TNM. There were seven different types of cancer in this meta-analysis, including digestive tract cancers (1CCA, 1ESCC, 3HCC, 1GC, 1CC) and other types of cancers (1melanoma, 1BRC), all of patients were diagnosed definitely based on pathology. Expression levels of CCAT1 in these patients’ cancer tissue were detected by use of qRT-PCR, thus, patients were divided into two groups: high and low expression of CCAT1. Both of groups contained two subgroups: LNM group and TNM group. As for the absence of reporting HR statistic, we acquired HRs from relevant figures of SC (Supplementary Table 1). Almost all the included studies had low risk of bias through assessment by using Newcastle-Ottawa Scale (Table 1).
Table 1. NOS for risk of bias assessment of included studies.
| Study | Selection | Comparability | Outcome | Total | |||||
|---|---|---|---|---|---|---|---|---|---|
| Adequacy of case definition | Number of case | Representativeness of the cases | Ascertainment of exposure | Ascertainment of detection method | Ascertainment of cut-off | Assessment of outcome | Adequate follow-up | ||
| Jiang, X.M. [12] | 1 | 1 | 1 | 1 | 1 | 1 | 1 | 1 | 8 |
| Zhang, E. [13] | 1 | 1 | 1 | 1 | 1 | 1 | 1 | 1 | 8 |
| Dou, C.Q [14] | 1 | 0 | 1 | 1 | 1 | 1 | 1 | 0 | 6 |
| Lv, L. [17] | 1 | 0 | 1 | 1 | 1 | 1 | 1 | 1 | 7 |
| Zhou, B.G. [18] | 1 | 0 | 1 | 1 | 1 | 1 | 1 | 0 | 6 |
| Zhang, X.F. [19] | 1 | 1 | 1 | 1 | 1 | 1 | 1 | 1 | 8 |
| Zhu, H.Q [15] | 1 | 1 | 1 | 1 | 1 | 1 | 1 | 1 | 8 |
| Deng, L. [16] | 1 | 1 | 1 | 1 | 1 | 1 | 1 | 1 | 8 |
| He, X. [20] | 1 | 0 | 1 | 1 | 1 | 1 | 1 | 1 | 7 |
NOS = Newcastle-Ottawa Scale.
Meta-analysis result
The correlation between CCAT1 and OS in seven types of cancers
We obtained HRs for OS from seven studies incorporating 503 patients in seven types of cancers. There was no evidence of significant heterogeneity among the studies, thus, we use the fixed-effects model (Figure 2A). The Pooled HR was 2.42 (95% CI, 1.86–3.16; P < 0.001) that revealed a statistically significant negative correlation between expression levels of CCAT1 and OS. It was similar in the cancer type subgroups: digestive tract cancers (HR, 2.42; 95% CI, 1.79–3.29; P < 0.001) and others (HR, 2.42; 95% CI, 1.42–4.13; P = 0.001(Figure 2B)). It was statistically significant that OS had the benefit of low expression of CCAT1, in contrast, high expression of CCAT1 meant poor OS (Table 2).
Figure 2. Forest plot of the correlation between HRs of OS and CCAT1 expression levels.
(A) Forest plot of the correlation between HRs and CCAT1 expression levels in different cancer patients. (B) Forest plot of the subgroup analysis for HRs by the factor of cancer types. HRs = Hazard ratios; OS = overall survival.
Table 2. Results of this meta-analysis.
| Outcome | No.of studies | No.of patients | HR/OR (95% CI) | P | Heterogeneity | |
|---|---|---|---|---|---|---|
| I2(%) | p-value | |||||
| OS | 7 | 503 | 2.422 (1.858–3.157) | < 0.001 | 0 | 0.837 |
| DTC [12, 13, 15, 16, 20] | 5 | 381 | 2.423 (1.786–3.288) | < 0.001 | 0 | 0.694 |
| Others [17, 19] | 2 | 122 | 2.418 (1.416–4.129) | = 0.001 | 0 | 0.462 |
| LNM [12–14, 19, 20] | 5 | 361 | 3.244 (2.039–5.160) | < 0.001 | 0 | 0.711 |
| TNM [12–14, 18–20] | 6 | 391 | 3.870 (2.529–5.923) | < 0.001 | 21.3 | 0.273 |
OS: overall survival; LNM: lymph node metastasis; TNM: cancer TNM stage; DTC: digestive tract cancer; Others: other cancer types; HR: hazard ratios; OR: odds ratios; No: number; CI: confidence interval.
The correlation between CCAT1 and LNM
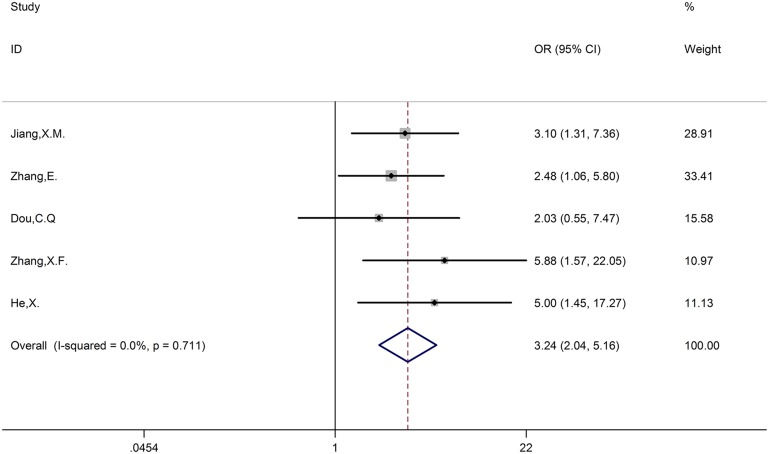
Five studies incorporating 361 patients reported the association between patients with positive LNM or negative LNM and different expression levels of CCAT1. There was no evidence of significant heterogeneity among the studies, thus, we use the fixed-effects model. The odds ratio (high CCAT1 expression group versus low CCAT1 expression group) was 3.24 (95% CI, 2.04–5.16; P < 0.001). The outcome showed that patients with positive LNM were associated with high CCAT1 expression, whereas patients with negative LNM were associated with low CCAT1 expression (Figure 3).
Figure 3. Forest plot of the correlation between LNM and CCAT1 expression levels.
LNM = lymph node metastasis.
The correlation between CCAT1 and TNM
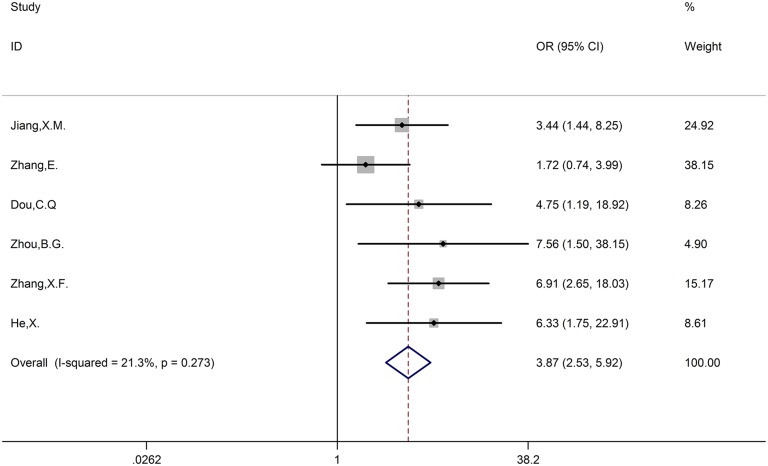
Six studies incorporating 391 patients reported the association between patients in different TNM stages and expression levels of CCAT1. There was no evidence of significant heterogeneity among the studies, thus, we use the fixed-effects model. The odds ratio (high CCAT1 expression group versus low CCAT1 expression group) was 3.87 (95% CI, 2.53–5.92; P < 0.001). The result showed that patients in high TNM stage (HTS) were associated with high CCAT1 expression, whereas patients in low TNM stage (LTS) were associated with low CCAT1 expression (Figure 4).
Figure 4. Forest plot of the correlation between TNM stage and CCAT1 expression levels.
Sensitivity analysis and publication bias
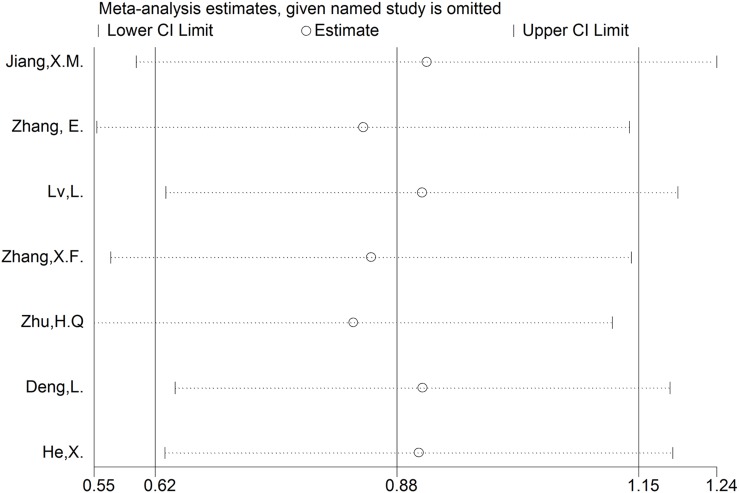
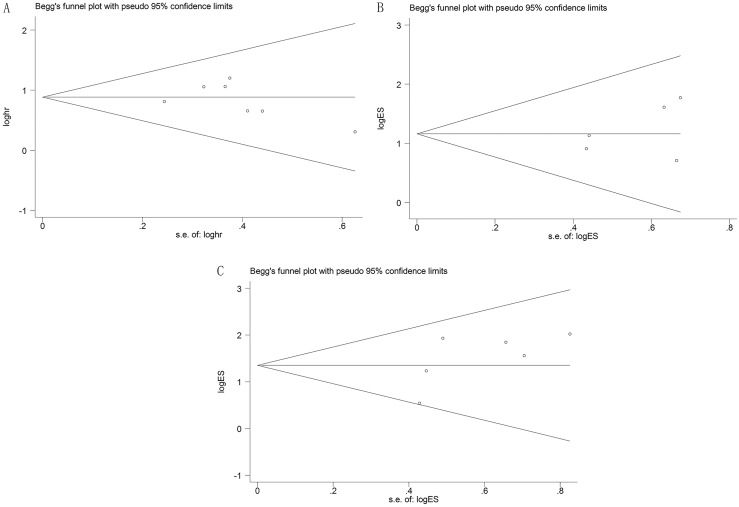
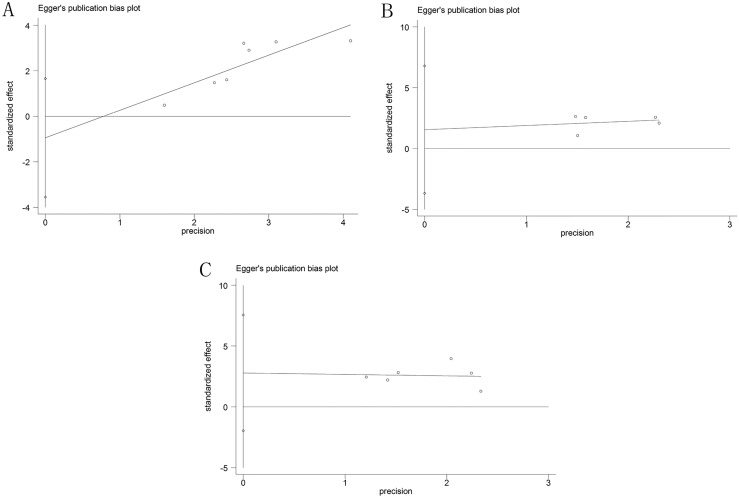
Sensitivity analysis was used to test the stability of the meta-analysis results of CCAT1 and OS. Consequently, the result pattern was not significantly impacted (Figure 5). The Funnel plots and Egger's test were conducted to evaluate the publication bias (Figures 6, 7). The result indicated no obvious publication bias in this meta-analysis: p(OS) = 0.395, p(LNM) = 0.417, p(TNM) = 0.179; t(OS) = -0.93, t(LNM) = 0.94, t(TNM) = 1.63.
Figure 5. Sensitivity analysis of effect of each study on the pooled HRs.
Figure 6. Funnel plots of potential publication bias.
(A) in OS group; (B) in LNM group; (C) in TNM group.
Figure 7. Egger's plot of potential publication bias.
(A) in OS group; (B) in LNM group; (C) in TNM group.
DISCUSSION
CCAT1, a newly discovered lncRNA, could activate cancer cell proliferation, migration and invasion and its overexpression is correlated with poor clinical outcomes [10]. We performed this meta-analysis included nine studies (involving seven types of cancer) to investigate clinical parameters of CCAT1. The pooled analysis indicated patients were at risk of poor survival, lymph node metastasis and high tumor stage, when the expression of CCAT1 was high. Therefore, our results showed that CCAT1 probably could serve as a diagnostic and prognostic biomarker in various cancers.
High expression levels of some lncRNAs have already been associated with poor prognosis in various types of cancer [21]. Likewise, CCAT1 had the same conclusion. As shown in Figure 2, we observed a statistically significant negative correlation between expression levels of CCAT1 and OS without obvious publication bias. Most of types of included cancers were digestive tract cancers, so we divided cancers into two groups digestive tract cancer and others to investigate the independent role in cancers. The result showed that CCAT1 was an independent prognostic factor for various cancers. As for LNM group and TNM group, we found that LNM or TNM was positively correlated with expression levels of CCAT1 in absence of obvious publication bias (Figures 3, 4). To conclude, CCAT1 might serve as an oncogenic lncRNA and could be a detectable diagnostic and independent prognostic biomarker for various cancers.
Furthermore, the relationship between CCAT1 expression and prognosis suggested its potential utilities as a clinical tool to detect cancers early. Likewise, a lot of previous meta-analyses investigated the relationship between the other lncRNAs expression and prognosis of corresponding cancers, such as HOTAIR [22], H19 [23] and MALAT1 [24]. These studies referred interrelated pathways that could influence processes of cancers. To explore deeper resource of CCAT1 on cancer, we further reviewed CCAT1 and its potential targets, pathways and related microRNAs, which had its potential utilities as a target therapy (Table 3).
Table 3. Summary of CCAT1 with their potential targets, pathways and related microRNAs.
| Potential targets | Pathways | Related microRNAs | Reference |
|---|---|---|---|
| Bcl-xl | proliferation | let-7c | [25] |
| BMI1 | proliferation, migration and invasion | miR-218 | [26–28] |
| c-Myc | proliferation, migration and invasion | let-7, miR-155 | [16, 20, 29–35] |
| CPEB2 | miR-181a/CPEB2 axis | miR-181a | [36] |
| HMGA2 | proliferation and migration | let-7 | [16, 29] |
| hnRNPA1 | CCAT1/miR-490 axis | miR-490 | [14, 18] |
| HOXB13 SPRY4 |
growth and migration | miR-7 | [13] |
| NA | cell proliferation and invasion | miR-33a | [17] |
| NA | proliferation | miR-410 | [37] |
| P53 | proliferation, migration and invasion | NA | [35] |
The strength of this meta-analysis is that we systemically reviewed the relationship between CCAT1 expression and clinical parameters, including OS, LNM and TNM. In addition, we designed two groups according to types of cancers: the digestive tract cancer and others.
However, there are also several limitations in the present meta-analysis as follows. Firstly, although we have exhausted to research relevant studies, at present only nine studies are eligible to have been included in this meta-analysis. Secondly, not all of included studies have OS, LNM and TNM and other studies didn't provided detailed information, resulting a less sample size of studies to analyze. Thirdly, four studies do not provide exact HR, it is undetected whether bias occurs or not when we obtain HR from the OS curve. Fourthly, all included studies are from China, so it is not known whether our results are applicable to other countries. Although the other countries have widely investigated and reported CCAT1 from the basic research side, there are few studies to express an association between different expression levels of CCAT1 and prognosis of cancer patients. Recently, more and more Chinese focus on lncRNAs and try to find a biomarker to dectect cancers early. Fifthly, the cut-off value of CCAT1 expression level in respective study has its own criteria (median or mean), the consistent measurement standards is not existing. Therefore, it is necessary to confirm our results using a large size of studies and better design studies.
In conclusion, this meta-analysis summarizes the accumulating evidence that suggests CCAT1 potential as a diagnostic and prognostic biomarker in various cancers. It is of great benefit to the clinical diagnosis, furthermore, it probably leads to new drugs for retarding the progress of cancers. Our results imply that high CCAT1 expression is related to poor OS, LNM and TNM, but the quantitative data on CCATA expression is needed to test.
SUPPLEMENTARY MATERIALS TABLE
Acknowledgments
We are indebted to the donors whose names were not included in the author list, but who participated in this program. This work was supported by Sanming Project of Medicine in Shenzhen.
Footnotes
CONFLICTS OF INTEREST
All authors declare that there is no conflicts of interests.
REFERENCES
- 1.Torre LA, Bray F, Siegel RL, Ferlay J, Lortet-Tieulent J, Jemal A. Global cancer statistics, 2012. CA Cancer J Clin. 2015;65:87–108. doi: 10.3322/caac.21262. [DOI] [PubMed] [Google Scholar]
- 2.Bradley CJ. Cancer, Financial Burden, and Medicare Beneficiaries. J Clin Oncol. 2017;35:2461–2462. doi: 10.1200/JCO.2017.73.1877. [DOI] [PubMed] [Google Scholar]
- 3.Gildea TR, DaCosta Byfield S, Hogarth DK, Wilson DS, Quinn CC. A retrospective analysis of delays in the diagnosis of lung cancer and associated costs. Clinicoecon Outcomes Res. 2017;9:261–269. doi: 10.2147/CEOR.S132259. [DOI] [PMC free article] [PubMed] [Google Scholar]
- 4.Car LT, Papachristou N, Urch C, Majeed A, El-Khatib M, Aylin P, Atun R, Car J, Vincent C. Preventing delayed diagnosis of cancer: clinicians' views on main problems and solutions. J Glob Health. 2016;6:020901. doi: 10.7189/jogh.06.020901. [DOI] [PMC free article] [PubMed] [Google Scholar]
- 5.Toh TB, Lim JJ, Chow EK. Epigenetics in cancer stem cells. Mol Cancer. 2017;16:29. doi: 10.1186/s12943-017-0596-9. [DOI] [PMC free article] [PubMed] [Google Scholar]
- 6.Lambert MP, Herceg Z. Mol Oncol; Epigenetics and cancer, 2nd IARC meeting; Lyon, France. 6 and 7 December; 2007. 2008. pp. 33–40. [DOI] [PMC free article] [PubMed] [Google Scholar]
- 7.Forrest ME, Khalil AM. Review: Regulation of the cancer epigenome by long non-coding RNAs. Cancer Lett. 2017;407:106–112. doi: 10.1016/j.canlet.2017.03.040. [DOI] [PubMed] [Google Scholar]
- 8.Crea F, Venalainen E, Ci X, Cheng H, Pikor L, Parolia A, Xue H, Nur Saidy NR, Lin D, Lam W, Collins C, Wang Y. The role of epigenetics and long noncoding RNA MIAT in neuroendocrine prostate cancer. Epigenomics. 2016;8:721–31. doi: 10.2217/epi.16.6. [DOI] [PubMed] [Google Scholar]
- 9.Schmitt AM, Chang HY. Long Noncoding RNAs in Cancer Pathways. Cancer Cell. 2016;29:452–463. doi: 10.1016/j.ccell.2016.03.010. [DOI] [PMC free article] [PubMed] [Google Scholar]
- 10.Xin Y, Li Z, Shen J, Chan MT, Wu WK. CCAT1: a pivotal oncogenic long non-coding RNA in human cancers. Cell Prolif. 2016;49:255–60. doi: 10.1111/cpr.12252. [DOI] [PMC free article] [PubMed] [Google Scholar]
- 11.Guo X, Hua Y. CCAT1: an oncogenic long noncoding RNA in human cancers. J Cancer Res Clin Oncol. 2017;143:555–562. doi: 10.1007/s00432-016-2268-3. [DOI] [PMC free article] [PubMed] [Google Scholar]
- 12.Jiang XM, Li ZL, Li JL, Zheng WY, Li XH, Cui YF, Sun DJ. LncRNA CCAT1 as the unfavorable prognostic biomarker for cholangiocarcinoma. Eur Rev Med Pharmacol Sci. 2017;21:1242–1247. [PubMed] [Google Scholar]
- 13.Zhang E, Han L, Yin D, He X, Hong L, Si X, Qiu M, Xu T, De W, Xu L, Shu Y, Chen J. H3K27 acetylation activated-long non-coding RNA CCAT1 affects cell proliferation and migration by regulating SPRY4 and HOXB13 expression in esophageal squamous cell carcinoma. Nucleic Acids Res. 2017;45:3086–3101. doi: 10.1093/nar/gkw1247. [DOI] [PMC free article] [PubMed] [Google Scholar]
- 14.Dou C, Sun L, Jin X, Han M, Zhang B, Li T. Long non-coding RNA colon cancer-associated transcript 1 functions as a competing endogenous RNA to regulate cyclin-dependent kinase 1 expression by sponging miR-490–3p in hepatocellular carcinoma progression. Tumour Biol. 2017;39:1010428317697572. doi: 10.1177/1010428317697572. [DOI] [PubMed] [Google Scholar]
- 15.Zhu HQ, Zhou X, Chang H, Li HG, Liu FF, Ma CQ, Lu J. Aberrant Expression of CCAT1 Regulated by c-Myc Predicts the Prognosis of Hepatocellular Carcinoma. Asian Pac J Cancer Prev. 2015;16:5181–5. doi: 10.7314/apjcp.2015.16.13.5181. [DOI] [PubMed] [Google Scholar]
- 16.Deng L, Yang SB, Xu FF, Zhang JH. Long noncoding RNA CCAT1 promotes hepatocellular carcinoma progression by functioning as let-7 sponge. J Exp Clin Cancer Res. 2015;34:18. doi: 10.1186/s13046-015-0136-7. [DOI] [PMC free article] [PubMed] [Google Scholar]
- 17.Lv L, Jia JQ, Chen J. The lncRNA CCAT1 Upregulates Proliferation and Invasion in Melanoma Cells via Suppressing miR-33a. Oncol Res. 2018;26:201–208. doi: 10.3727/096504017X14920318811749. https://doi.org/10.3727/096504017×14920318811749. [DOI] [PMC free article] [PubMed] [Google Scholar]
- 18.Zhou B, Wang Y, Jiang J, Jiang H, Song J, Han T, Shi J, Qiao H. The long noncoding RNA colon cancer-associated transcript-1/miR-490 axis regulates gastric cancer cell migration by targeting hnRNPA1. IUBMB Life. 2016;68:201–10. doi: 10.1002/iub.1474. [DOI] [PubMed] [Google Scholar]
- 19.Zhang XF, Liu T, Li Y, Li S. Overexpression of long non-coding RNA CCAT1 is a novel biomarker of poor prognosis in patients with breast cancer. Int J Clin Exp Pathol. 2015;8:9440–5. [PMC free article] [PubMed] [Google Scholar]
- 20.He X, Tan X, Wang X, Jin H, Liu L, Ma L, Yu H, Fan Z. C-Myc-activated long noncoding RNA CCAT1 promotes colon cancer cell proliferation and invasion. Tumour Biol. 2014;35:12181–8. doi: 10.1007/s13277-014-2526-4. [DOI] [PubMed] [Google Scholar]
- 21.Bartonicek N, Maag JL, Dinger ME. Long noncoding RNAs in cancer: mechanisms of action and technological advancements. Mol Cancer. 2016;15:43. doi: 10.1186/s12943-016-0530-6. [DOI] [PMC free article] [PubMed] [Google Scholar]
- 22.Cai B, Wu Z, Liao K, Zhang S. Long noncoding RNA HOTAIR can serve as a common molecular marker for lymph node metastasis: a meta-analysis. Tumour Biol. 2014;35:8445–50. doi: 10.1007/s13277-014-2311-4. [DOI] [PubMed] [Google Scholar]
- 23.Liu FT, Pan H, Xia GF, Qiu C, Zhu ZM. Prognostic and clinicopathological significance of long noncoding RNA H19 overexpression in human solid tumors: evidence from a meta-analysis. Oncotarget. 2016;7:83177–83186. doi: 10.18632/oncotarget.13076. https://doi.org/10.18632/oncotarget.13076. [DOI] [PMC free article] [PubMed] [Google Scholar]
- 24.Xue Y, Teng YQ, Zhou JD, Rui YJ. Prognostic value of long noncoding RNA MALAT1 in various carcinomas: evidence from nine studies. Tumour Biol. 2016;37:1211–5. doi: 10.1007/s13277-015-3915-z. [DOI] [PubMed] [Google Scholar]
- 25.Chen J, Zhang K, Song H, Wang R, Chu X, Chen L. Long noncoding RNA CCAT1 acts as an oncogene and promotes chemoresistance in docetaxel-resistant lung adenocarcinoma cells. Oncotarget. 2016;7:62474–62489. doi: 10.18632/oncotarget.11518. https://doi.org/10.18632/oncotarget.11518. [DOI] [PMC free article] [PubMed] [Google Scholar]
- 26.Ma MZ, Chu BF, Zhang Y, Weng MZ, Qin YY, Gong W, Quan ZW. Long non-coding RNA CCAT1 promotes gallbladder cancer development via negative modulation of miRNA-218–5p. Cell Death Dis. 2015;6:e1583. doi: 10.1038/cddis.2014.541. [DOI] [PMC free article] [PubMed] [Google Scholar]
- 27.Lu L, Xu H, Luo F, Liu X, Lu X, Yang Q, Xue J, Chen C, Shi L, Liu Q. Epigenetic silencing of miR-218 by the lncRNA CCAT1, acting via BMI1, promotes an altered cell cycle transition in the malignant transformation of HBE cells induced by cigarette smoke extract. Toxicol Appl Pharmacol. 2016;304:30–41. doi: 10.1016/j.taap.2016.05.012. [DOI] [PubMed] [Google Scholar]
- 28.Zhang H, Zhong J, Bian Z, Fang X, Peng Y, Hu Y. Long non-coding RNA CCAT1 promotes human retinoblastoma SO-RB50 and Y79 cells through negative regulation of miR-218–5p. Biomed Pharmacother. 2017;87:683–691. doi: 10.1016/j.biopha.2017.01.004. [DOI] [PubMed] [Google Scholar]
- 29.Zhuang K, Wu Q, Jiang S, Yuan H, Huang S, Li H. CCAT1 promotes laryngeal squamous cell carcinoma cell proliferation and invasion. Am J Transl Res. 2016;8:4338–4345. [PMC free article] [PubMed] [Google Scholar]
- 30.Xiang JF, Yin QF, Chen T, Zhang Y, Zhang XO, Wu Z, Zhang S, Wang HB, Ge J, Lu X, Yang L, Chen LL. Human colorectal cancer-specific CCAT1-L lncRNA regulates long-range chromatin interactions at the MYC locus. Cell Res. 2014;24:513–31. doi: 10.1038/cr.2014.35. [DOI] [PMC free article] [PubMed] [Google Scholar]
- 31.Yang F, Xue X, Bi J, Zheng L, Zhi K, Gu Y, Fang G. Long noncoding RNA CCAT1, which could be activated by c-Myc, promotes the progression of gastric carcinoma. J Cancer Res Clin Oncol. 2013;139:437–45. doi: 10.1007/s00432-012-1324-x. [DOI] [PMC free article] [PubMed] [Google Scholar]
- 32.Chen L, Wang W, Cao L, Li Z, Wang X. Long Non-Coding RNA CCAT1 Acts as a Competing Endogenous RNA to Regulate Cell Growth and Differentiation in Acute Myeloid Leukemia. Mol Cells. 2016;39:330–6. doi: 10.14348/molcells.2016.2308. [DOI] [PMC free article] [PubMed] [Google Scholar]
- 33.Arunkumar G, Murugan AK, Prasanna Srinivasa Rao H, Subbiah S, Rajaraman R, Munirajan AK. Long non-coding RNA CCAT1 is overexpressed in oral squamous cell carcinomas and predicts poor prognosis. Biomed Rep. 2017;6:455–462. doi: 10.3892/br.2017.876. [DOI] [PMC free article] [PubMed] [Google Scholar]
- 34.McCleland ML, Mesh K, Lorenzana E, Chopra VS, Segal E, Watanabe C, Haley B, Mayba O, Yaylaoglu M, Gnad F, Firestein R. CCAT1 is an enhancer-templated RNA that predicts BET sensitivity in colorectal cancer. J Clin Invest. 2016;126:639–52. doi: 10.1172/JCI83265. [DOI] [PMC free article] [PubMed] [Google Scholar]
- 35.Li T, Mo X, Fu L, Xiao B, Guo J. Molecular mechanisms of long noncoding RNAs on gastric cancer. Oncotarget. 2016;7:8601–12. doi: 10.18632/oncotarget.6926. https://doi.org/10.18632/oncotarget.6926. [DOI] [PMC free article] [PubMed] [Google Scholar]
- 36.Wang Q, Zhang W, Hao S. LncRNA CCAT1 modulates the sensitivity of paclitaxel in nasopharynx cancers cells via miR-181a/CPEB2 axis. Cell Cycle. 2017;16:795–801. doi: 10.1080/15384101.2017.1301334. [DOI] [PMC free article] [PubMed] [Google Scholar] [Retracted]
- 37.Wang ZH, Guo XQ, Zhang QS, Zhang JL, Duan YL, Li GF, Zheng DL. Long non-coding RNA CCAT1 promotes glioma cell proliferation via inhibiting microRNA-410. Biochem Biophys Res Commun. 2016;480:715–720. doi: 10.1016/j.bbrc.2016.10.047. [DOI] [PubMed] [Google Scholar]
Associated Data
This section collects any data citations, data availability statements, or supplementary materials included in this article.


