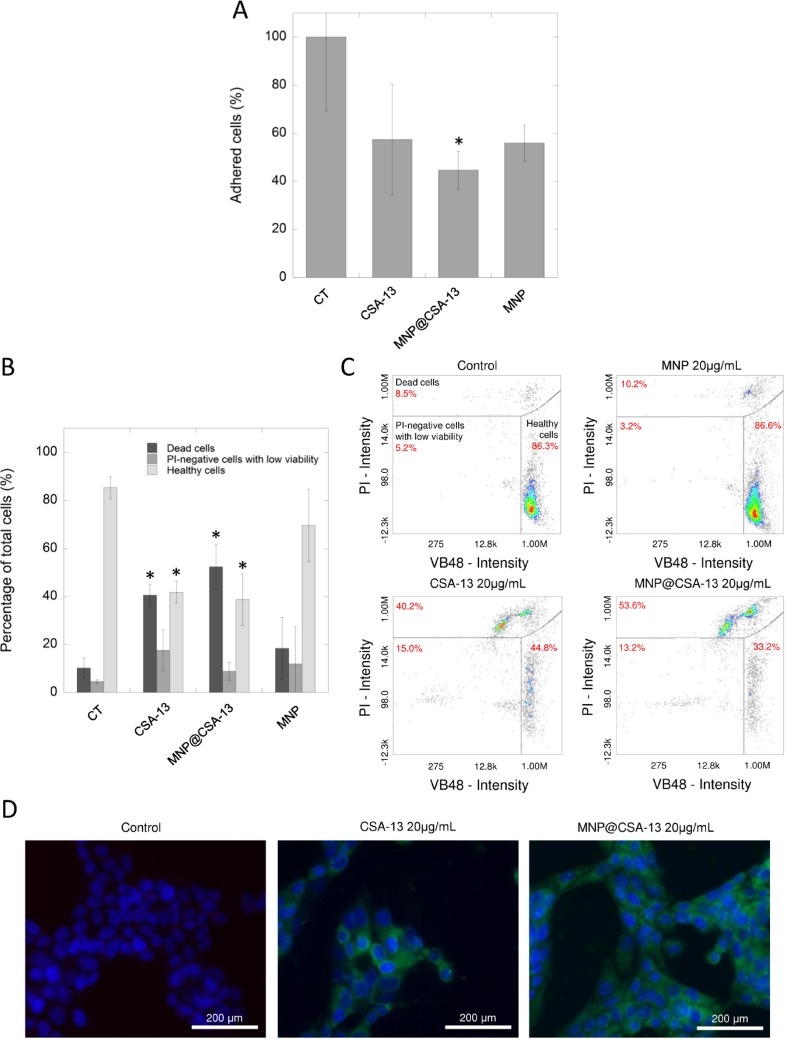
Figure 3. The impact of CSA-13 and MNP@CSA-13 on viability and adhesion of treated MCF-7 cells.
The adhesion of MCF-7-treated cells to the cell-treated surface assessed using CV staining (A). The percentages of dead cells (dark grey bars), PI-negative cells with low viability (grey bars) and healthy cells (light grey bars) in MCF-7 cells treated with CSA-13, MNP@CSA-13 and naked MNPs (B). (C) shows representative plots from flow cytometry analysis of viability of ceragenin-treated cells. Intracellular uptake of FITC-labeled CSA-13 and MNP@CSA-13 is demonstrated in the (D). All experiments were performed using agents at concentration of 20 µg/mL for 24 h. Panels A and B present results from 3 independent experiments ± SD, for panels C and D results from one representative experiment were shown. *indicates statistical significance (p < 0.05) when compared to untreated control (panel A) or corresponding cells population in control samples (panel B).

