

Abstract
Legacy perfluorinated compounds exhibit significant environmental persistence and bioaccumulation potential, which has spawned an ongoing effort to introduce replacement compounds with reduced toxicological risk profiles. Many of these emerging chemical species lack validated quantitative methods, and, frequently, appropriate analytical standards for accurate monitoring and identification. To fill this knowledge gap, a general method for the quantitative determination of perfluoroether carboxylic acids (PFECAs) by LC–MS/MS was single-lab validated on spike-recovery samples in surface, drinking, and wastewater for a variety of perfluorinated ether standards. Relative error measurements for spike-recovery samples in each matrix ranged from 0.36% to 25.9%, with an average error of 10% overall. Coefficient of variation (CV) for each compound ranged from 10 to 28% with an average of 17%. The quantitative methodology was applied during repeated weekly monitoring of the Cape Fear River during remediation of PFECA hexafluoropropyloxide dimer-acid (HFPO-DA), known by the brand name “GenX.” Semi-quantitative concentration estimates for emerging PFECA compounds lacking analytical standards was also carried out using surrogate calibration curves and mass labeled HFPO-DA as an internal standard. Estimates of the emerging compounds were possible using matched standards, but application of the estimation methodology to compounds with known concentration revealed that such estimates may possess up to an order of magnitude, or more, in uncertainty due to the difficulty of matching with an appropriate standard. Nevertheless, the estimation biases are primarily systematic (extraction efficiency and instrument response) rather than stochastic, enabling the collection of time-course data; both HFPO-DA and the emerging compounds were reduced in surface water and drinking water concentration of several orders of magnitude after removal of the source waste stream.
Keywords: Perfluoroalkyl substances, HFPO-DA, GenX, Cape fear river, LC–MS
1. Introduction
Per- and polyfluoroalkyl substances (PFASs) are recalcitrant environmental pollutants which have become a focus of significant public health interest in recent years [1]. In particular, the widely used compounds perfluorooctanoic acid (PFOA) and perfluorooctanesulfonate (PFOS) were found to have a negative toxicological profile and bioaccumulation potential [2,3], resulting in publication of a drinking water health advisory by the EPA [3,4], international restrictions [5], and pressure for banning under the Stockholm Convention on Persistent Organic Pollutants [6]. The primary manufacturers of these molecules phased out US production of PFOS/PFOA and related chemical species in the 2000s [7,8]. However, fluorinated surfactants, such as PFOA and PFOS, as well as the fluorinated polymer products whose production they support, exhibit unique chemical properties that are of substantial value in the textiles and consumer products industries [9]. As a consequence, numerous alternative chemistries have emerged to replace the discontinued species [10–12], with estimates as high as several thousand species [13].
One broad class of the replacement chemicals are fluorinated ether compounds [11], which consist of a series of short chain perfluorinated carbons linked by ether oxygens and capped with an acidic head group (Table 1). Many species demonstrating this general fluorinated ether structure have been detected in locations where fluorochemical manufacturing impacts the water supply [14,17], but toxicological data of these emerging compounds are limited. One particular chemical, 2,3,3,3-Tetrafluoro-2-(heptafluoropropoxy) propanoic acid, also known as hexafluoropropylene oxide dimer acid (HFPO-DA), or the trade name of its ammonium salt, GenX, [18] was designed as a fluorochemical processing surfactant that meets the requirements of the EPA PFASs management program [18,19]. HFPO-DA, and other HFPO related products have been found in significant concentrations in the discharge from certain fluorochemical manufacturing sites [14,16,20]. The limited toxicological studies of the HFPO-DA compound indicate that acute toxicity and metabolism are of limited concern for the replacement chemical, [21–24] but long-term exposure effects require additional study. [23–27] The detection of the compound in the Cape Fear River in North Carolina sparked an intensive investigation and establishment of a statewide health goal [28] amid concerns over its potential long-term effects.
Table 1.
A) Reference perfluoro-ether carboxylic acids included in the PFECA standard mixture and B) emerging perfluorinated ether species lacking analytical standards.
| A) Perfluorinated Ether Standards | |||
|---|---|---|---|
| Compound Name | CAS | Formula | Structure |
| Perfluoro(4-oxapentanoic acid) (“Surrogate 1”) | 863090–89-5 | C5HF9O3 |

|
| Perfluoro(3,6-dioxaheptanoic acid) (“Surrogate 2”) | 151772–58-6 | C5HF9O4 |

|
| Perfluoro(3-oxabutanoic acid) (“Surrogate 3”) | 377–73-1 | C4HF7O3 |
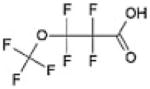
|
| Perfluro(5-oxa-6-dimethylhexanoic) acid (“Surrogate 4”) | 801212–59-9 | C7HF13O3 |

|
| Perfluoro(2-methyl-3-oxahexanoic) acid (“HFPO-DA”) | 13252–13-6 | C6HF11O3 |

|
|
| |||
| B) Emerging Compounds | |||
|
| |||
| Compound Name | CAS | Formula | Structure |
| Perfluoro-methoxyacetic acid (PFMOAA) | 674–13-5 | C3HF5O3 |

|
| Perfluoro-3,5-dioxahexanoic acid (PFO2HxA) | 39492–88-1 | C4HF7O4 |

|
| Perfluoro-3,5,7-trioxaoctanoic acid (PFO3OA) | 39492–89-2 | C5HF9O5 |

|
HFPO-DA is but one of an amalgamation of related fluorochemical compounds emerging as pollutants of interest in surface, ground, and drinking water, and, while existing non-targeted methodologies have allowed for the detection of novel structures, [12–16] quantitative methods will be necessary for long term environmental monitoring and health effects studies regarding new fluorochemicals like HFPO-DA/GenX. Existing methodologies, such as EPA method 537, were developed for the analysis of legacy compounds, straight chain perfluorinated carboxylic acids and sulfonates, in drinking water, but there is substantial need for general methods sufficient to analyze known and emerging compounds in environmental matrices. Further, as emerging contaminants frequently lack authenticated standards, methods for tracking and estimating fluorochemical concentrations are needed for monitoring environmental levels of unknown contaminants. Here we demonstrate a quantitative sample preparation and LC–MS/MS method suitable for emerging perfluoroether compounds, validate it in multiple water source matrices, and apply it to the ongoing monitoring of an impacted watershed. Further, we estimate concentrations and conduct time course monitoring of perfluoroether compounds with no existing standards by using closely related surrogate species to model instrument responses and construct non-matched calibration curves.
2. Materials and methods
2.1. Preparation of PFECA standards
Reference standards of perfluoroether carboxylic acids were obtained from Synquest Laboratories (Table 1) along with 13C3 labeled 2,3,3,3-Tetrafluoro-2-(heptafluoropropoxy) propanoic acid (HFPO-DA) for use as an internal standard (Wellington Labs). A stock solution of each standard was prepared in 95:5 methanol:2.5 M NaOH to prevent the formation of the methyl ester. From these stocks, a mixed PFECA standard was prepared containing equal mass of each native species and diluted to the desired final concentrations in methanol.
Standard PFECA solution mixtures were prepared using water sourced from three locations as the background matrices. Background matrix water was sourced as followed: surface water collected from Discovery Lake, Research Triangle Park, NC, waste water collected from Jacksonville Wastewater Treatment facility effluent, Jacksonville, NC, and drinking water collected from a laboratory faucet in the Environmental Protection Agency office in Research Triangle Park, NC. Each source sample was collected into one liter pre-cleaned high-density polyethyelene (HDPE) Nalgene bottles and spiked with a standard mixture of PFECAs (Table 1) at either 0, 50, or 200 ng/L. Five replicates of these matrix spiked samples were prepared for each combination of background matrix (Surface Water, Waste Water, Drinking Water) and PFECA level (Blank, Low Spike, High Spike) resulting in 45 samples. The prepared spiked samples were stabilized by pH adjustment to pH ~ 2 with the addition of 5 mL of 35% nitric acid. A set of samples of the PFECA mixture at 0, 10, 25, 50, 100, 150, 200, and 250 ng/L was also prepared in deionized water (DI) and processed immediately in tandem to construct calibration curves.
2.2. Environmental sampling
Fluorochemical contaminated water samples were acquired from North Carolina Department of Environmental Quality (NCDEQ) at a location near the industrial waste out fall for a local fluorochemical manufacturer, as well as from downstream drinking water treatment plants. Location 1 was the source water drawn from the Cape Fear River for a downstream water treatment facility and Location 2 was finished drinking water delivered to Wilmington, NC. Each sample was collected in a one liter HDPE bottle and stabilized by pH adjustment with nitric acid as previously described [29]. Samples were stored at room temperature, extracted and analyzed within five days of the sampling date.
2.3. Solid phase extraction of PFECAs from aqueous matrix
The previously prepared, stabilized samples were decanted into a 1000 mL HDPE graduated cylinder and their total volume recorded; water in excess of 1000 mL was discarded. The maximum oversampling possible in a one liter HDPE bottle is ~10%, allowing a worst case 10% bias if 100% of in-solution PFASs bind to the bottle surface and the maximum amount of excess water is discarded. This scenario can be avoided by not filling bottles completely; the maximum sample collection overfill was <10 mL in this sample set. The sample bottle was then rinsed with 10 mL of methanol to remove any compounds that partially adhere during sample processing and storage; the retained water was returned to the bottle alongside the methanol. An internal standard of 13C3 labeled HFPO-DA was added to each water sample at a concentration of 100 ng/L of sample, and shaken vigorously before being vacuum filtered through a Whatman GF/A glass filter.
Oasis weak anion exchange (WAX) Plus (225 mg) solid phase extraction (SPE) cartridges (Waters Corporation) were conditioned according to the manufacturer instructions, as follows: the SPE cartridges were equilibrated under 10 mL/min methanol flow for 2.5 min, followed by 2.5 min of deionized water (DI) at 10 mL/min; flow was maintained through a SPC10-P Sep-Pak concentrator binary piston pump (Waters Corporation). Samples were concentrated at a flow rate of 10 mL/min for 50 min (500 mL total volume) and SPE cartridges were removed for later elution. The Sep-Pak system was flushed with 25 mL of methanol (2.5 min at 10 mL/min) between sample cartridges to prevent sample carryover.
After sample concentration, the SPE cartridges were washed with 4 mL of 25 mM pH 4.0 acetate/acetic acid buffer, followed by a wash of 4 mL of neutral methanol. Compounds of interest were then eluted with 4 mL of freshly prepared 0.1% ammonium hydroxide in methanol and evaporated in a polypropylene tube at 40°C under a dry nitrogen stream to a final volume of ~ 1 mL. The evaporated samples were diluted 4-fold in 2.5 mM ammonium acetate to match the starting conditions for liquid chromatography.
2.4. LC–MS/MS data acquisition and quantification
LC–MS/MS quantification took place on a Waters Acquity ultra performance liquid chromatograph which had been modified to replace OEM PTFE filters and solvent plumbing with stainless steel or PEEK tubing and incorporate a PFC isolation column (Waters P/N 176001744). The chromatographic separation was carried out using a Waters ACQUITY UPLC BEH C18 column (2.1 mm × 50 mm, 1.7 μm), a flow rate of 500 μL/min, 50 μL injection volume, and a binary mobile phase gradient with mobile phases A (95:5, 2.5 mM ammonium acetate: Methanol) and B (95:5, Methanol: 2.5 mM ammonium acetate). The gradient program was a follows: 10–85% B (5 min), 85–100% (0.1 min), 100% (hold for 1.9 min), 100–10% (0.1 min), 10% (hold for 1.9 min). Detection and quantitation was performed with an interfaced Waters Quattro Premier XE triple quadrupole mass spectrometer in negative mode (Supplemental Table 1) with individual transition parameters for each PFECA species analyzed (Table 2). Stable isotope labeled (SIL) HFPO-DA was used as an internal standard for all measured compounds.
Table 2.
Multiple reaction monitoring (MRM) transition table for surrogate and emerging PFECAs analyzed in this study.
| Species | Molecular Formula | Precursor Mass (Da) | Product Mass (Da) | Cone Voltage (V) | Collision Energy (eV) |
|---|---|---|---|---|---|
| Surrogate 1 | C5HF9O3 | 279.0 | 84.9 | 14 | 22 |
| 134.8 | 22 | 24 | |||
| Surrogate 2 | C5HF9O4 | 295.0 | 84.9 | 10 | 26 |
| 200.9 | 10 | 10 | |||
| Surrogate 3 | C4HF7O3 | 229.0 | 84.9 | 10 | 10 |
| 184.9 | 22 | 18 | |||
| Surrogate 4 | C7HF13O3 | 379.0 | 184.8 | 16 | 12 |
| 134.9 | 16 | 34 | |||
| HFPO-DA | C6HF11O3 | 329.2 | 168.9 | 10 | 12 |
| 286.9 | 10 | 6 | |||
| HFPO-DA IS | [13C]3C3HF11O3 | 332.2 | 168.9 | 10 | 12 |
| 286.9 | 10 | 6 | |||
| PFMOAA | C3HF9O5 | 178.9 | 84.9 | 10 | 12 |
| PFO2HxA | C4HF7O4 | 245.0 | 84.9 | 22 | 18 |
| 178.8 | 22 | 4 | |||
| PFO3OA | C5HF9O5 | 311.1 | 84.9 | 22 | 20 |
| 150.8 | 22 | 4 |
MRM transitions were previously optimized for the four surrogate perfluoroether compounds and HFPO-DA using available standards. Additional transitions for three emerging PFECAs previously described (Table 1, Supplemental Fig. 1–3), [16] but currently lacking analytical standards, were selected using direct infusion of extracts prepared from the Cape Fear River. For method validation, the MRM method contained only the surrogate and HFPO-DA transitions, while environmental samples included the three MRM transitions for the emerging PFECAs as well.
The PFECA mixture was used to prepare an eight-point calibration curve for each constituent PFECA standard for quantitation. Ion abundances were normalized to the HFPO-DA internal standard intensity and curves were fitted as a concentration weighted (1/x) quadratic curve with two injections per concentration. For spike recovery experiments, quantitation was derived from the matching standard curve. For quantitative measurements of HFPO-DA and semi-quantitative estimates for the emerging PFECAs in environmental samples, systematic application of each surrogate standard curve was used to calculate estimated concentrations.
3. Results and discussion
3.1. Spike-recovery validation
Representative figures of merit were calculated for the quantitative spike recovery assessment based on the five sample preparations for each combination of background matrix and concentration (Fig. 1). For each replicate, the relative percentage error (RE) ranges from 0.36% to 25.9%, with an average of ~10% when aggregated across compounds and background matrices (Table 3). Sample precision was calculated with average coefficient of variation of 17% across matrices and spike levels (Table 3). A method limit of detection (LOD) for PFECAs was estimated at 16 ng/L using a 3X signal-to-noise cutoff. The method noise was estimated as the standard deviation of repeated injections of the 10 ng/L calibration curve point. This reported LOD value is not a physical limitation, and can be reduced through modifications to the SPE concentration step, sample blow down, or injection volume to increase the on-column analyte load and improve sensitivity, or use of an MS platform with better intrinsic sensitivity.
Fig. 1.

Measured PFECA concentrations for a synthetic PFECA mixture in varying matrices at 200 ng/L (HS), 50 ng/L (LS), and 0 ng/L (BL) spike levels, with 95% confidence intervals.
Table 3.
Calculated relative percentage error (RE) and coefficient of variation (CV) for measurements (n = 5) in waste water (WW), surface water (SW) and drinking water (DW) matrices for a series of PFECA compounds.
| Compound | Matrix | RE (%) | CV (%) |
|---|---|---|---|
| HFPO-DA | DW | 9.2 | 20% |
| SW | 8.6 | 20% | |
| WW | 7.4 | 25% | |
| Surrogate 1 | DW | 12.9 | 14% |
| SW | 13.4 | 14% | |
| WW | 9.1 | 22% | |
| Surrogate 2 | DW | 13.0 | 14% |
| SW | 9.2 | 12% | |
| WW | 7.5 | 23% | |
| Surrogate 3 | DW | 4.7 | 17% |
| SW | 12.2 | 12% | |
| WW | 15.6 | 28% | |
| Surrogate 4 | DW | 15.9 | 10% |
| SW | 7.0 | 10% | |
| WW | 7.5 | 19% |
For the HFPO-DA compound, the measurement retains accuracy regardless of matrix or sample concentration within the range of the calibration curve; all measurements correspond to their theoretical values within the 95% confidence interval and demonstrate acceptable RE (<10%) and CV (<30%) values. However, the other PFECA compounds demonstrate a small, systemic overestimation of their concentration in some background matrices. This effect is attributable to a non-matched internal standard, and can be corrected in the future as appropriate stable isotope labeled species become available. The reproducibility of the assay is still high; CVs of the surrogate compounds are equivalent or better than HFPO-DA with one exception, and the RE remains under 20% in all cases, with results from each matrix being statistically indistinguishable from each other. Thus, the methodology can be generally applied even in absence of matched internal standards. Of note, a single replicate of waste water – high spike was excluded from the collection sample set due to a significant contaminant in the preparation. Investigation of the sample revealed significant (>5-fold) signal suppression of HFPO-DA and the SIL HFPO-DA standard in only that prep. HFPO-DA quantification was unaffected due to the matched internal standard, but surrogate concentration estimates were >3.5 standard deviation outliers due to the suppressed SIL used for normalization. This event demonstrates that caution remains necessary when using non-matched internal standards, especially in heterogeneous matrices such as waste water.
3.2. Application in longitudinal monitoring of HFPO-DA
Initial environmental samples obtained in June 2017 from fluorochemical manufacturing outfall, surface, and drinking water far exceeded the designated calibration range and required significant dilution to enter the calibration curve range for accurate quantitation. Following this sampling, the manufacturer ceased waste stream emissions from one of their manufacturing lines and the measured concentrations of all monitored species dramatically declined in both the direct outfall and downstream locations (Figs. 2 and 3). Of note, local contamination from pumps and piping at the manufacturing site are hypothesized to be the cause of the persistently high concentrations in the waste outfall through the third sampling week in spite of the immediate decline observed at downstream locations. Continuous monitoring of both outfall and impacted drinking water sites demonstrated minor daily variation but consistent reduction below North Carolina’s targeted health goal of 140 ng/L [28].
Fig. 2.

Measured HFPO-DA concentrations in manufacturing outfall over time. The vertical line indicates diversion of PFECA generating waste stream, the horizontal line indicates targeted HFPO-DA health goal (140 ng/L), inset shows shaded region.
Fig. 3.

Measured HFPO-DA concentrations at drinking water treatment plants located in the Cape Fear River basin. Vertical line indicates diversion of PFECA generating waste stream, horizontal line indicates targeted health goal (140 ng/L).
Blank, low spike, and high spiked standard mixtures were carried to the sampling site as field blanks each week and returned for QC analysis. Throughout the sampling course, QC samples measured were quantified with an average RE of 22%. Each week, a randomly selected 10% subset of the environmental samples were replicated and inter-replicate CVs were <10%, demonstrating long term method stability and precision.
3.3. Semi-quantitative estimates of emerging PFECAs
For compounds tentatively identified as PFMOAA, PFO2HxA, and PFO3OA [16], the lack of a matched standard and reliance on a surrogate internal standard limits the potential accuracy of quantitative efforts. Nevertheless, semi-quantitative estimates can inform public health decisions and provide focus for further development of analytical methods [30]. The PFECA mixture was used to prepare an eight-point calibration curve for each constituent PFECA standard. Ion abundances were normalized to the HFPO-DA internal standard intensity and calibration curves were fitted as a concentration weighted (1/x) quadratic curve. Estimated concentrations for the three emerging compounds, which lack standards, and HFPO-DA were obtained using each of the five calibration curves each sampling week, as well as a global estimate curve built from the response of all five individual surrogates.
To establish an estimate of the level of error when using surrogate compounds for concentration estimates, the HFPO-DA value from its matched calibration curve was compared to values obtained using the calibration curves from the four surrogate compounds. The surrogate estimated concentrations yielded average errors of 1.3%, 0.6%, 48%, and 0.3% for Surrogates 1–4 respectively. The three closely matching surrogates, 1, 2 and 4, elute within a 1-min window, very near the HFPO-DA peak (Supplemental Fig. 4–7). As a consequence, they demonstrate remarkably little bias in estimated concentrations for HFPO-DA, unlike Surrogate 3, which elutes much earlier in the chromatographic run, and has significant peak distortions resulting from its more hydrophilic character than the other species. Surrogate 3 however, does have a more similar chromatographic profile to PFMOAA and PFO2HXA. For the HFPO-DA, a best case scenario of a closely matched chemical structure for the calibration curve and internal standard yields accurate results within the error margins of the matched curve and standard, while a poorly matched species yields a several-fold, but still manageable, level of bias in estimation. Matching of surrogates can be performed empirically, by selecting similar chemical structures and confirming similar chromatographic and MS performance, but a general solution to determining “good” surrogate matches is beyond the scope of this paper.
The emerging species exhibit significantly more variability in estimated concentrations compared to the surrogate standards (Fig. 4). Structurally, the emerging compounds appear similar to the surrogate PFECA compounds, however, their elution time indicates substantially higher hydrophilicity consistent with their low molecular weight and increased oxygen content; PFMOAA elutes nearly in the void volume, and PFO2HxA falls somewhere between the PFMOAA and surrogate standards (Supplemental Fig. 5). Further, the extraction efficiency of non-targeted species in SPE is currently unknown, and can contribute to significant variability, but we assume the binding to be consistently high when using anion exchange phases with easily ionized species such as perfluoroacids [31].
Fig. 4.

Estimated concentrations of three emerging PFECA compounds at Location 2, using five surrogate calibration curves and a global calibration of all species.
The systematic dissimilarity between the lower molecular weight emerging compounds and the surrogate standards impacts the concentration estimates. The predicted concentrations are consistent in their ordering, with HFPO-DA estimate being the highest value and Surrogate 4 underestimating that value by ~10-fold.
The systematic bias of estimated concentration is consistent across sampling location and date, implying it is intrinsic to the process, likely the result of hydrophobic bias in the chromatography and/or electrospray that cannot be corrected for without more closely matched calibration curve and/or internal standard. A conservative application of the variation between the five closely related PFECA standards suggests the error of the global average is on the order of ten-fold and can be considered semi-quantitative at best. Regardless, using the global average calibration curve of the PFECA standards provides a rough estimate of concentration that can be useful for directing further work. The most recent PFMOAA estimate range still falls partially above the health goal for HFPO-DA and it is worthy of further scrutiny, while the other compounds have been reduced below that target level, even when using the highest estimate of the concentration.
Nevertheless, all three of the non-standard PFECA compounds demonstrated substantial reduction over time as the result of halted upstream emission, similarly to the behavior of the HFPO-DA compound. This signifies that all the related PFECA compounds likely derive from the single fluoropolymer manufacturing process whose waste was diverted. Further, time trends indicate that the overall concentration has dropped ~2 orders of magnitude, similar to the HFPO-DA, regardless of the calibration source used. This methodology is therefore suitable for tracking temporal changes in compounds lacking standards even though the specific estimation of concentrations remains highly uncertain, presuming that such species can be detected by LC–MS.
4. Conclusion
The ongoing proliferation of new perfluorinated species to serve industrial chemical need in absence of the legacy compounds PFOA and PFOS is a burgeoning topic in environmental and public health with substantial interest. Monitoring efforts for these new species require a robust, generalized method for quantitative determinations of exposure. The availability of a SIL internal standard for HFPO-DA allows for robust analysis of this species, and allows its use as a surrogate internal standard for other compounds barring the production of matching SIL perfluoroethers. The methodology presented here is robust to variations in the environmental matrix (tap, surface, and waste water) and offers an extended range of sensitivity through the use of multiple concentration steps. Nevertheless, the calibration range utilized, with a method limit of detection ~10 ng/L, is sufficient for exposure monitoring, as the existing health advisory/goal levels for both the legacy and emerging perfluorinated compounds are around an order of magnitude higher. Lower health targets for legacy species exist in some states [32], and increased concentration factors or improved instrument sensitivity would be necessary to achieve the necessary lower method detection limits.
The same sample preparation technique can be applied to the analysis of only partially characterized species assuming chemically similar standards are available for purchase. Using one or more related species to construct calibration curves, even with surrogate internal standards, allows for an estimation of concentrations that can inform future research and policy efforts in environmental exposure. This can act as supplemental and supporting information to other mass spectrometry related monitoring efforts in non-targeted analysis. For species with some available structural information and a closely related standard, the error is on the same order as the method variation and theoretically suitable for quantitative work. However, this should be consisted a stop-gap technique prior to the acquisition of standards or validation of the assumption of similar extraction efficiency and instrument response. suitable for quantitative work. The estimates from less closely matched calibrations curves vary by >10-fold depending on the selected calibration species, but nevertheless can reveal accurate time-trend data for determining the impact of systemic changes and determining whether multiple species have correlated behaviors in response to an intervention.
Supplementary Material
Acknowledgments
The United States Environmental Protection Agency, through its Office of Research and Development, funded and managed the research described here. It has been subjected to Agency administrative review and approved for publication. James McCord was supported by an appointment to the Internship/Research Participation Program at the Office of Research and Development, U.S. Environmental Protection Agency, administered by the Oak Ridge Institute for Science and Education through an interagency agreement between the U.S. Department of Energy and EPA. Thanks are extended to the North Carolina Department of Environmental Quality for collecting the water samples used for the longitudinal monitoring application.
Appendix A. Supplementary data
The following is Supplementary data to this article:
References
- 1.Lindstrom AB, Strynar MJ, Libelo EL. Polyfluorinated Compounds: past, present, and future. Environ Sci Technol. 2011;45(19):7954. doi: 10.1021/es2011622. [DOI] [PubMed] [Google Scholar]
- 2.Stahl T, Mattern D, Brunn H. Toxicology of perfluorinated compounds. Environ Sci Eur. 2011;23(1):38. [Google Scholar]
- 3.Lifetime Health Advisories and Health Effects Support Documents for Perfluorooctanoic Acid and Perfluorooctane Sulfonate E. P. A, editor. Federal Register. United States: 2016. pp. 33250–33251. [Google Scholar]
- 4.Provisional Health Advisories for Perfluorooctanoic Acid (PFOA) and Perfluorooctane Sulfonate (PFOS) United States Environmental Protection Agency; Washington DC: 2009. [Google Scholar]
- 5.Report of the Conference of the Parties of the Stockholm Convention on Persistent Organic Pollutants on the Work of Its Fourth Meeting (2009)
- 6.Proposal for a COUNCIL DECISION on the Submission, on Behalf of the European Union, of a Proposal for the Listing of Additional Chemicals in Annex A to the Stockholm Convention on Persistent Organic Pollutants Council of the European Union (2016)
- 7.Fact Sheet. 2010/PFOA Stewardship Program. 2015 https://www.epa.gov/assessing-and-managing-chemicals-under-tsca/fact-sheet-20102015-pfoa-stewardship-program.
- 8.EPA and 3 M Announce Phase Out of PFOS. 2018 https://yosemite.epa.gov/opa/admpress.nsf/0/33aa946e6cb11f35852568e1005246b4.
- 9.Kissa E. Fluorinated Surfactants and Repellents. Vol. 97. CRC Press; 2001. [Google Scholar]
- 10.Scheringer M, Trier X, Cousins I, de Voogt PT, Fletcher T, Wang Z, Webster TF. Helsingør Statement on poly- and perfluorinated alkyl substances (PFASs) Chemosphere. 2014;114:337–339. doi: 10.1016/j.chemosphere.2014.05.044. [DOI] [PubMed] [Google Scholar]
- 11.Wang Z, Cousins IT, Scheringer M, Hungerbühler K. Fluorinated alternatives to long-chain perfluoroalkyl carboxylic acids (PFCAs), perfluoroalkane sulfonic acids (PFSAs) and their potential precursors. Environ Int. 2013;60:242. doi: 10.1016/j.envint.2013.08.021. [DOI] [PubMed] [Google Scholar]
- 12.Xiao F. Emerging poly- and perfluoroalkyl substances in the aquatic environment: a review of current literature. Water Res. 2017;124:482–495. doi: 10.1016/j.watres.2017.07.024. [DOI] [PubMed] [Google Scholar]
- 13.Wang Z, DeWitt JC, Higgins CP, Cousins IT. A never-Ending story of per- and polyfluoroalkyl substances (PFASs) Environ Sci Technol. 2017;51(5):2508–2518. doi: 10.1021/acs.est.6b04806. [DOI] [PubMed] [Google Scholar]
- 14.Sun M, Arevalo E, Strynar M, Lindstrom A, Richardson M, Kearns B, Pickett A, Smith C, Knappe DRU. Legacy and emerging perfluoroalkyl substances are important drinking water contaminants in the cape fear river watershed of north Carolina. Environ Sci Technol Lett. 2016;3(12):415–419. [Google Scholar]
- 15.Newton S, McMahen R, Stoeckel JA, Chislock M, Lindstrom A, Strynar M. Novel polyfluorinated compounds identified using high resolution mass spectrometry downstream of manufacturing facilities near Decatur, alabama. Environ Sci Technol. 2017;51(3):1544–1552. doi: 10.1021/acs.est.6b05330. [DOI] [PMC free article] [PubMed] [Google Scholar]
- 16.Strynar M, Dagnino S, McMahen R, Liang S, Lindstrom A, Andersen E, McMillan L, Thurman M, Ferrer I, Ball C. Identification of novel perfluoroalkyl ether carboxylic acids (PFECAs) and sulfonic acids (PFESAs) in natural waters using accurate mass time-of-flight mass spectrometry (TOFMS) Environ Sci Technol. 2015;49(19):11622. doi: 10.1021/acs.est.5b01215. [DOI] [PubMed] [Google Scholar]
- 17.Heydebreck F, Tang J, Xie Z, Ebinghaus R. Alternative and legacy perfluoroalkyl substances: differences between european and chinese River/Estuary systems. Environ Sci Technol. 2015;49(14):8386–8395. doi: 10.1021/acs.est.5b01648. [DOI] [PubMed] [Google Scholar]
- 18.DuPont™ GenX Processing Aid for Making Fluoropolymer Resins Chemours (2010)
- 19.Risk Management for Per- and Polyfluoroalkyl Substances (PFASs) Under TSCA. United States Environmental Protection Agency; Washington DC: 2015. [Google Scholar]
- 20.Pan Y, Zhang H, Cui Q, Sheng N, Yeung LW, Guo Y, Sun Y, Dai J. First report on the occurrence and bioaccumulation of hexafluoropropylene oxide trimer acid: an emerging concern. Environ Sci Technol. 2017;51(17):9553–9560. doi: 10.1021/acs.est.7b02259. [DOI] [PubMed] [Google Scholar]
- 21.Gannon SA, Fasano WJ, Mawn MP, Nabb DL, Buck RC, Buxton LW, Jepson GW, Frame SR. Absorption, distribution, metabolism, excretion, and kinetics of 2,3,3,3-tetrafluoro-2-(heptafluoropropoxy)propanoic acid ammonium salt following a single dose in rat, mouse, and cynomolgus monkey. Toxicology. 2016;340:1–9. doi: 10.1016/j.tox.2015.12.006. [DOI] [PubMed] [Google Scholar]
- 22.Caverly Rae JM, Craig L, Slone TW, Frame SR, Buxton LW, Kennedy GL. Evaluation of chronic toxicity and carcinogenicity of ammonium 2,3,3,3-tetrafluoro-2-(heptafluoropropoxy)-propanoate in Sprague–Dawley rats. Toxicol Rep. 2015;2:939–949. doi: 10.1016/j.toxrep.2015.06.001. [DOI] [PMC free article] [PubMed] [Google Scholar]
- 23.Hoke RA, Ferrell BD, Sloman TL, Buck RC, Buxton LW. Aquatic hazard, bioaccumulation and screening risk assessment for ammonium 2,3,3, 3-tetrafluoro-2-(heptafluoropropoxy)-propanoate. Chemosphere. 2016;149:336–342. doi: 10.1016/j.chemosphere.2016.01.009. [DOI] [PubMed] [Google Scholar]
- 24.Rushing BR, Hu Q, Franklin JN, McMahen RL, Dagnino S, Higgins CP, Strynar MJ, DeWitt JC. Evaluation of the immunomodulatory effects of 2,3,3,3-Tetrafluoro-2-(Heptafluoropropoxy)-Propanoate in C57BL/6 mice. Toxicol Sci. 2017;156(1):179–189. doi: 10.1093/toxsci/kfw251. [DOI] [PMC free article] [PubMed] [Google Scholar]
- 25.Agency EC. Ammonium 2,3,3,3-tetrafluoro-2-(heptafluoropropoxy)propanoate. Acute Toxicity Endpoint Summary. 2018 https://echa.europa.eu/registration-dossier/-/registered-dossier/2679/7/3/1.
- 26.Beekman MZP, Muler A, de Vriew W, Janssen P, Zeilmaker M. Evaluation of Substances Used in the GenX Technology by Chemours. The Dutch National Institute for Public Health and the Environment (RIVM); Dordrecht: 2016. [Google Scholar]
- 27.Smit C. Research into Indicative Water Quality Standards for Substances Used in the GenX Technology. The Dutch National Institute for Public Health and the Environment (RIVM); 2017. [Google Scholar]
- 28.NC DHHS. Preliminary Risk Assessment FAQ for GenX (Perfluoro2-propoxypropanoic Acid) North Carolina: Department of Health and Human Services; 2017. [Google Scholar]
- 29.Nakayama SF, Strynar MJ, Reiner JL, Delinsky AD, Lindstrom AB. Determination of perfluorinated compounds in the upper mississippi river basin. Environ Sci Technol. 2010;44(11):4103. doi: 10.1021/es100382z. [DOI] [PubMed] [Google Scholar]
- 30.Environmental Decisions in the Face of Uncertainty. National Research Council; 2013. [PubMed] [Google Scholar]
- 31.Goss KU. The pKa values of PFOA and other highly fluorinated carboxylic acids. Environ Sci Technol. 2008;42(2):456–458. doi: 10.1021/es702192c. [DOI] [PubMed] [Google Scholar]
- 32.Maximum Contamination Level Recommendation for Perfluorooctanoic Acid in Drinking Water. Drinking Water Quality Institute; New Jersey: 2017. [Google Scholar]
Associated Data
This section collects any data citations, data availability statements, or supplementary materials included in this article.