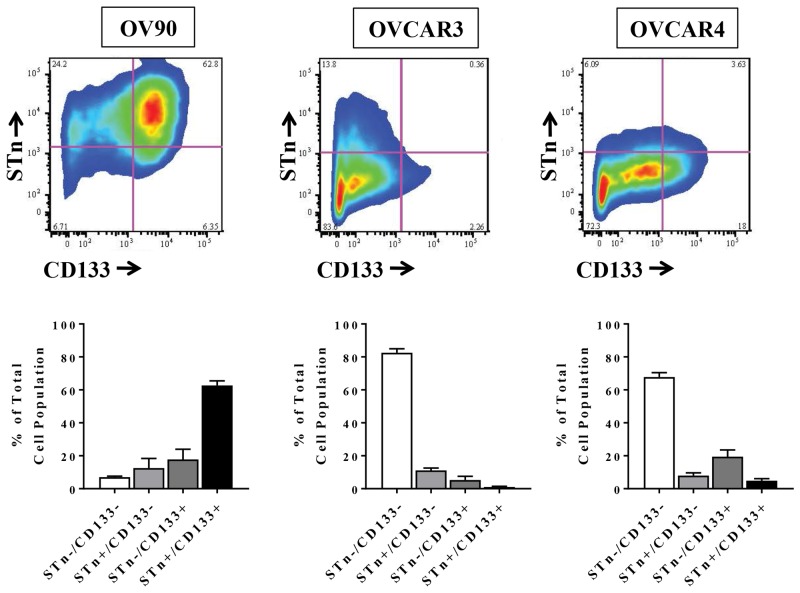
Figure 1. STn+ and CD133+ are co-expressed in human ovarian cancer cell lines.
A representative example of flow cytometric scatter plots for STn+ and CD133+ levels in OV90, OVCAR3 and OVCAR4 cells is shown along with quantification of the four populations analyzed (STn-/CD133-, STn-/CD133+, STn+/CD133- and STn+/CD133+). Error bars represent the mean ± SEM of three independent experiments.

