Abstract
Obesity is an increasingly severe socioeconomic health issue worldwide. Rodents with diet-induced obesity (DIO) are widely used as models of obesity. The main aim of this study was to establish a DIO model using Wistar lean (+/+ or +/−) rats by feeding a high-fat diet (45 kcal% fat) to dams during the latter term of gestation and the lactation period. A second aim was to examine the effect of post-weaning nutrition independently of maternal nutrition. Some pups (group D) were fed the same high-fat diet after weaning, while others (group C) were fed a chow diet after weaning. In the control groups, the dams were fed only the chow diet and the pups were fed either the chow diet (group A) or high-fat diet (group B) after weaning. Between 16–21 weeks of age, group D showed the heaviest body weight and visceral adipose tissue weight among groups, in addition to glucose intolerance and high concentrations of glucose and cholesterol in plasma. Group B showed mild obesity with dysfunctions in glucose and lipid metabolism. Interestingly, group C showed mild obesity and impaired glucose tolerance, similar to the phenotype of group B. In summary, the high-fat diet challenge of dams during gestation and lactation caused an increase in adipose tissue weight and abnormalities of glucose and lipid metabolism in their adult offspring. Our results suggest the importance of both maternal and post-weaning nutrition for DIO production and provide useful DIO models.
Keywords: diet-induced obesity (DIO) model, high-fat diet, maternal nutrition, post-weaning nutrition, Wistar lean rat
Introduction
Obesity is an increasingly severe socioeconomic health issue not only among developed countries but also among rising nations. Numerous investigations into obesity-induced health problems such as diabetes, hyperlipidemia, and hypertension have been performed using genetically obese rodents [4, 8]. In addition to genetic factors, environmental factors are also important for the development of human obesity [3, 13]. Especially, over-nutrition during the fetal and/or childhood periods affects metabolic processes during adulthood [1, 3, 9]. Therefore, diet-induced obesity (DIO) is a good model of human obesity due to excessive calorie intake, especially during the fetal and childhood periods.
One of the two aims of this study was to establish a new DIO model using Wistar lean (+/+ or +/−) rats by feeding a high-fat diet to dams during the latter term of gestation and the lactation period. The other aim was to examine the effect of post-weaning nutrition independently of maternal nutrition by feeding either a high-fat diet or a laboratory chow diet to offspring until 21 weeks of age. As a result, unique DIO models with different severities of obesity were produced.
Materials and Methods
Animals and foods
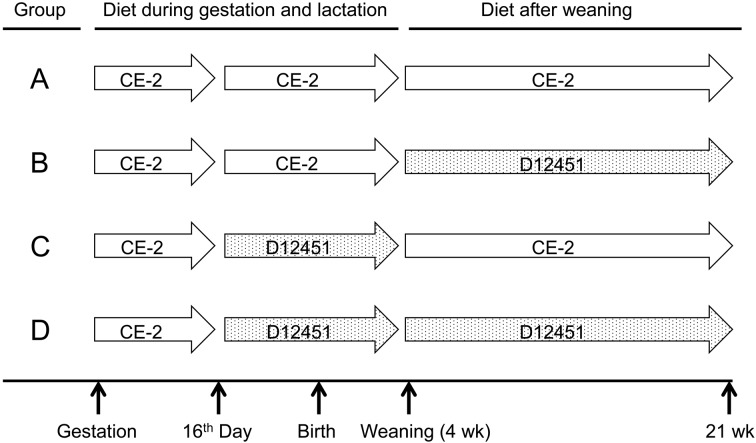
We used Wistar lean rats that were the lean littermates (+/+ or +/−) of Wistar fatty rats (−/−) [5]. The pregnant Wistar lean rats were made pregnant by mating between heterozygotes (+/−). The pregnant rats were fed either a laboratory chow diet (CE-2, 344.9 kcal/100 g: Clea Japan Inc., Tokyo, Japan) or a high-fat diet (D12451, 45 kcal% fat, 473 kcal/100 g: Research Diets Inc., NJ, USA) during the latter term (after the 16th day) of the gestation period and the entire lactation period. The pups were weaned at 4 weeks of age. Male lean pups were separated into 4 groups consisting of 5 pups per group and their homozygosity or heterozygosity (+/+ or +/−) was confirmed by a genetic analysis at 13–14 weeks of age to confirm that there was no admixture of fatty rats in lean groups. The ratios between the genotypes (+/+ and +/−) were 2:3, 2:3, 2:3, and 3:2 in groups A, B, C, and D, respectively. After weaning, they were separated into 4 groups and kept on either the CE-2 diet or D12451 diet, as shown in the feeding design schematic (Fig. 1) until 21 weeks of age. They drank tap water ad libitum in a room maintained at a temperature of 23 ± 3°C and a humidity of 55% (40–80%) that was illuminated from 07:00 to 19:00 h each day. All animal experiments were carried out in compliance with the “Guide for Care and Use of Laboratory Animals” of TAKEDA RABICS, LTD (Fujisawa, Japan).
Fig. 1.
Feeding design. CE-2: a laboratory chow diet, D12451: a high-fat diet.
Feeding design
The pregnant rats were fed the CE-2 diet ad libitum until 16 days after the detection of the vaginal plug and then separated into 4 groups: Groups A and B were fed the CE-2 diet while groups C and D were fed the D12451 diet until weaning at 4 weeks of age (Fig. 1). At weaning, the average body weight of pups was matched equally between groups A and B, and between groups C and D. Then, groups A and C were fed the CE-2 diet while groups B and D were fed the D12451 diet until 21 weeks of age (Fig. 1).
Clinical tests
Body weight was measured every week until 21 weeks of age. The oral glucose tolerance test (OGTT) was performed on animals fasted overnight (19 h) by administering oral glucose (20% glucose solution, 1 g/5 mL/kg body weight). Increments from basal levels of plasma glucose in OGTT were calculated as the total area = (a + 2b + 3c + 2d) × 1/4 (mg/dL∙h), where a represents the basal levels before glucose loading and b, c, and d are the levels at 30, 60, and 120 min after glucose loading, respectively. Blood glucose was measured using an ACCU-CHEK® Aviva instrument (Roche Diagnostics K.K., Tokyo, Japan).
At 21 weeks of age, blood samples were taken from a tail vein under the fed condition and the following biochemical parameters were measured in plasma. Glycohemoglobin (GHb) was measured using a HLC-723GHbG8 automated analyzer (Tosoh Corporation, Yamaguchi, Japan), while plasma glucose, total cholesterol (TC), high-density lipoprotein (HDL)-cholesterol (HDL-C), triglyceride (TG), and non-esterified fatty acid (NEFA) were measured using an automatic analyzer 7600 (Hitachi High-Technologies Corporation, Tokyo, Japan). Non-HDL cholesterol was calculated by subtracting HDL-C from TC.
At 21 weeks of age, the rats were sacrificed under isoflurane anesthesia. Then, adipose tissues from 5 anatomical positions (mesenteric, peri-renal, peri-epididymal, subcutaneous, and brown adipose tissues) were weighed.
Statistical methods
Each figure was shown as mean ± SD. The statistical significance of differences among the 4 groups was analyzed by parametric multiple comparisons with Tukey’s test, and the significance of differences was expressed as P<0.05, P<0.01, or P<0.001.
Results
Body weight
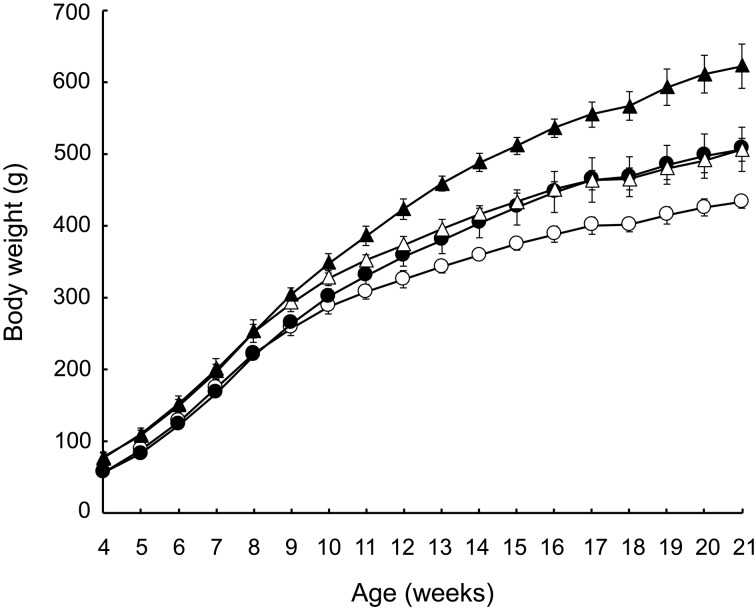
Figure 2 shows the post-weaning growth curves from 4 to 21 weeks of age in the 4 groups. At 4 weeks of age, the body weights of pups in groups C and D, in which a high-fat diet (D12451) was fed to the dams, were significantly heavier, by about 20 g, than those in groups A and B, in which the dams were fed a laboratory diet (CE-2) (Table 1). The growth rate was almost equal between groups C and D, and between groups A and B, until 9 weeks of age (Fig. 2). Thereafter, the growth rates depended on the diet in each group. The growth rate gradually slowed in group C, but remained fast in group B. At 21 weeks of age, the order of the groups by body weight was D > B = C > A (Table 1).
Fig. 2.
Post-weaning growth curves. Circle: Group A, black circle: Group B, triangle: Group C, black triangle: Group D. Mean ± SD (n=5).
Table 1. Changes in body weight in groups A, B, C, and D.
Blood and plasma analyses
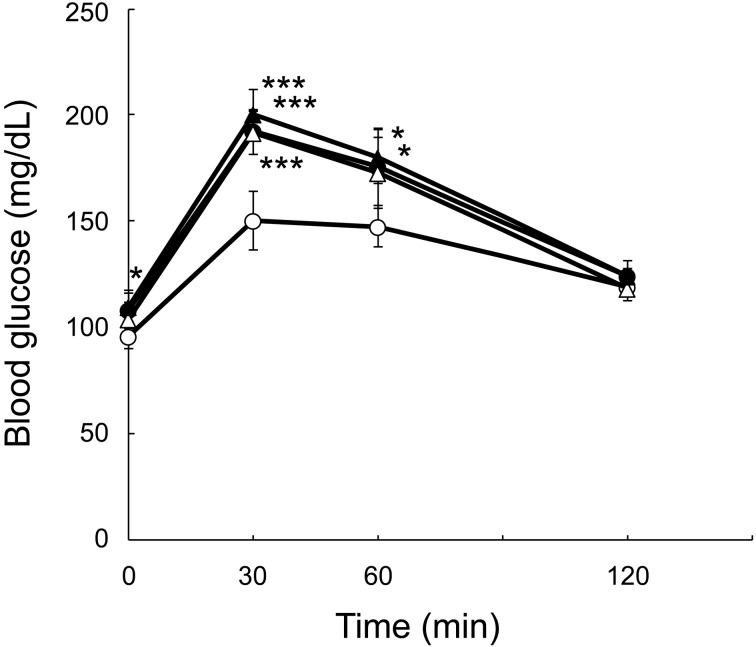
OGTT: OGTT was performed after 19 h of fasting at 16 weeks of age. The response curves for blood glucose are depicted in Fig. 3. The fasting levels of blood glucose showed a significant difference between groups D and A. The order of the groups by their 30-min levels of blood glucose was D > B > C > A and groups D, B, and C all showed a significant difference compared with group A. The 60-min levels of blood glucose showed a significant difference among groups D, B, and A. Table 2 shows the total areas under the glucose response curves. Groups D, B, and C all showed significant glucose intolerance compared with group A, but there was no significant difference in glucose tolerance among groups D, B, and C.
Fig. 3.
Response curves of blood glucose in oral glucose tolerance tests. Circle: Group A, black circle: Group B, triangle: Group C, black triangle: Group D. Mean ± SD (n=5). *P<0.05 and ***P<0.001 vs. group A.
Table 2. Total areas of glucose response curves in OGTT.
| Group | Total area (mg/dL∙120 min) |
|---|---|
| A | 16,173 ± 291 |
| B | 19,017 ± 1,069** |
| C | 18,639 ± 982* |
| D | 19,497 ± 1,126** |
Mean ± SD (n=5). *P<0.05 and **P<0.01 vs. group A.
GHb: There was no significant difference in GHb levels among groups A (3.8 ± 0.1%), B (3.8 ± 0.1%), C (3.9 ± 0.1%), and D (3.9 ± 0.1%).
Plasma glucose and lipids
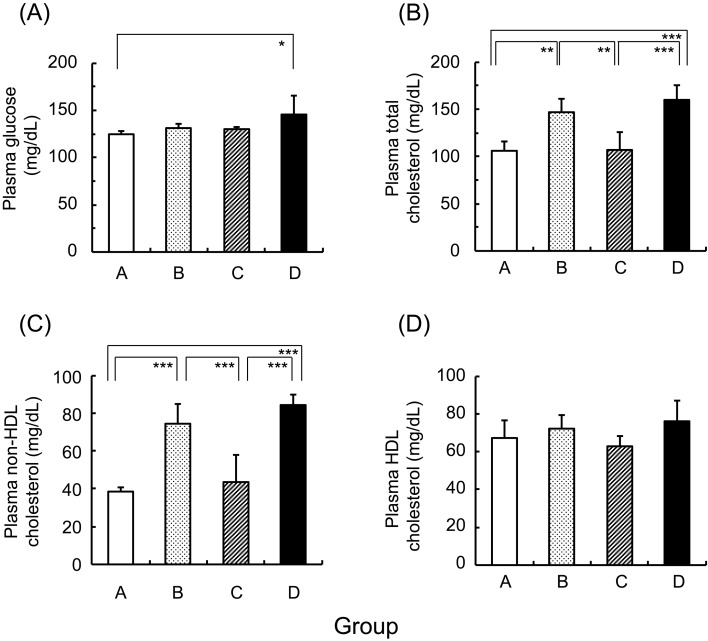
Plasma glucose and cholesterol were measured under the fed condition (Fig. 4). The plasma glucose level was significantly higher in group D than in group A. Plasma total cholesterol and non-HDL cholesterol levels were significantly higher in groups B and D than in groups A and C. Plasma HDL-C levels did not differ among the 4 groups. Plasma TG and NEFA levels were slightly higher in group D compared with the other groups, but there were no significant differences in plasma TG levels (71 ± 26, 78 ± 24, 79 ± 11, and 111 ± 27 mg/dL) and plasma NEFA levels (0.175 ± 0.100, 0.230 ± 0.100, 0.192 ± 0.089, and 0.339 ± 0.128 µEq/L) among groups A, B, C, and D, respectively.
Fig. 4.
Plasma glucose and lipid levels in groups A, B, C, and D. Mean ± SD (n=5). *P<0.05, **P<0.01, and ***P<0.001.
Adipose tissue weight
At 21 weeks of age, adipose tissues from 5 anatomical positions (mesenteric, peri-renal, peri-epididymal, subcutaneous, and brown adipose tissues) were weighed under the fed condition (Table 3 ). The adipose tissue weights from the 5 different body parts were heavier in group D as compared with the other groups. The adipose weights from the peri-renal and subcutaneous positions in group D were prominently and significantly heavier than those in groups B, C, and A. The mesenteric and peri-epididymal adipose tissues in group D were also significantly heavier than those in groups A and C. In group B, the mesenteric, peri-renal, peri-epididymal, and subcutaneous adipose tissues were significantly heavier than those in group A. In group C, the peri-renal adipose tissues were heavier than those in group A. However, there was no significant difference in the brown adipose tissue weight among the 4 groups.
Table 3. Adipose tissue weights in groups A, B, C, and D.
Discussion
The genotypes of Wistar lean rats used in this experiment were wild (+/+) or heterozygous (+/−). Body weight, biochemical parameters in blood or plasma, and adipose tissue weights were previously reported to not differ between these genotypes [5].
One of the two aims of this study was to establish a new DIO model by feeding a high-fat diet to dams during the latter term of gestation and the lactation period. Therefore, we changed the diet on the 17th day of pregnancy, because the presence of babies was confirmed by palpation of the abdomen, and their visceral organs such as the gut, liver, and pancreas had started to form. A high-fat diet (45 kcal% fat, 473 kcal/100 g: D12451) was fed to dams during the latter term of gestation and the entire lactation period. At weaning (4 weeks of age), the pups of dams fed the D12452 diet were significantly heavier, by about 20 g, compared with those of dams fed the CE-2 diet (344.9 kcal/100 g). After weaning, the pups in group D were fed the D12451 continuously, but those in group C were changed to the CE-2 diet until 21 weeks of age. By contrast, group A was kept on CE-2 continuously and group B was fed the D12451 diet after weaning until 21 weeks of age. Group D showed the fastest growth rate and their body weights became heaviest at 21 weeks of age among the other 3 groups. The adipose tissue weights from the 5 different body parts were also heaviest in group D compared with the other groups. The differences in body weight between groups D and A were about 100 g at 12 weeks of age (422.9 ± 14.1 g vs. 324.6 ± 11.5 g) and about 200 g at 21 weeks (618.5 ± 39.4 g vs. 427.8 ± 5.5 g). Group B showed a prominent post-weaning growth curve after 9 weeks of age. At 17 weeks of age, the body weights of groups B and C became equal. Their mean body weights were approximately 80 g heavier than that of group A. The adipose tissue weights were also almost equal in groups B and C. The difference in body weight between group D and group B or C was about 115 g at 21 weeks of age. Therefore, group D represents a severe DIO model, while groups B and C represent mild DIO models. This conclusion was also supported by their adipose tissue weights.
OGTT revealed glucose intolerance in groups D, B, and C, and the degree of glucose intolerance did not differ among those 3 groups. However, plasma glucose levels were slightly but significantly higher in group D as compared with those of the other groups. It was important to confirm whether insulin resistance was present in this DIO model. Unfortunately, owing to the accidental loss of the stored plasma samples, we were unable to test the insulin levels during the OGTT directly. However, we inferred that insulin resistance was present in groups D, B, and C, since they showed glucose intolerance. The degree of insulin resistance seemed to be stronger in group D compared with those of the other groups, based on the high level of plasma TG and NEFA in addition to the significantly high level of the fasting glucose level. Plasma total cholesterol and non-HDL cholesterol levels were significantly higher in groups D and B, which were kept on the D12451 diet, than those of groups C and A, which were fed the CE-2 diet after weaning. Plasma TG and NEFA levels were slightly, but not significantly, higher in group D. Therefore, groups D and B are considered to be diet-induced models for human adulthood obesity accompanied by mild dysfunctions of glucose and lipid metabolism.
Although DIO models of rats and mice have previously been reported, it is important to consider that different rodent strains show different responses in their growth rate, adipose tissue weights, and glucose and lipid metabolism to a calorie-rich diet [2]. C57BL/6J and AKR mice both showed a high obesogenic response, but SWR/J and A/J mice were resistant to such a diet. In Sprague-Dawley rats, it is known that different strains are either prone or resistant to developing obesity in response to a high-fat diet [6]. The present study demonstrates that the Wistar lean rat is prone to developing obesity in response to a high-fat diet.
To estimate the usefulness of DIO rats as a model of obesity, it is important to determine their similarities to human adulthood obesity, such as whether they develop glucose intolerance, hyperlipidemia, and increased visceral adipose tissue weight in addition to an increased body weight. Group D exhibited all of those changes. The feeding schedule used for group D results in the development of DIO as early as 12 weeks of age. As a result, the method used for inducing obesity in group D offers lower economic costs for the development of a DIO model than that used for group B, which were fed a high-fat diet after weaning. Rats in group C, which were nursed by dams that were fed a high-fat diet until weaning, showed interesting features such as increased post-weaning growth, glucose intolerance, and increased visceral adipose tissue weights. These observations strongly suggest the influence of maternal effects on the fetus during gestation.
Thompson et al. [11] reported the generation of an interesting DIO model using Wistar rats. In their DIO model, pups born from dams that were restricted to 70% of ad libitum food intake during gestation were cross-fostered onto dams that were fed ad libitum throughout pregnancy and were given a high-fat diet after weaning. Their DIO models were characterized by fasting insulin hypersecretion and increased adiposity, but showed no difference in insulin sensitivity as compared with the control DIO model in which the pups were nursed by standard dams that were fed ad libitum throughout gestation and were kept on the high-fat diet after weaning. In Our DIO model, the offspring were delivered and nursed by dams that were fed a high-fat diet from the 17th day of pregnancy and were given the high-fat diet after weaning. Madsen et al. [7] reported diet-induced obesity susceptible and resistant outbred models originating from Sprague-Dawley rats. In their design, the offspring were kept on a high-fat diet after weaning. Our DIO model is slightly superior to the above two DIO models in terms of the rapidity of development and degree of the obesity phenotype.
Sun et al. [10] reported that when pups born from dams fed a high-fat diet (60% fat) during gestation were nursed by dams fed a laboratory chow diet after birth, the body weights of those pups did not differ from the weights of pups fed a laboratory chow diet both during gestation and continuously after weaning. Furthermore, they detected concentrations of leptin as much as 5–6 times higher in milk from dams fed a high-fat diet compared with that from dams fed a laboratory chow diet, and they suggested that leptin resistance in the hypothalamus would be important for DIO induced by a high-fat diet. Yura et al. [12] demonstrated that neonatal mice became severely obese after receiving leptin injections between 6–11 days after birth and being fed a high-fat diet after 11 weeks of age, compared with non-leptin treated mice. Although we could not measure milk leptin levels in our experiment because of the technical difficulty of milking rats, these facts suggest that leptin resistance could be related to the development of DIO in groups C and D in addition to over-nutrition.
Conclusions
This study showed that feeding a high-fat diet to Wistar lean rats during the maternal and/or post-weaning periods produced useful diet-induced models of human adulthood obesity that presented obesity phenotypes at a young age.
Acknowledgments
The authors would like to thank Dr.Yasutaka Nagisa and Mr. Kenichi Nagatome for their suggestions during the preparation of this manuscript.
References
- 1.Cerf M.E., Chapman C.S., Muller C.J., Louw J.2009. Gestational high-fat programming impairs insulin release and reduces Pdx-1 and glucokinase immunoreactivity in neonatal Wistar rats. Metabolism 58: 1787–1792. doi: 10.1016/j.metabol.2009.06.007 [DOI] [PubMed] [Google Scholar]
- 2.Collins S., Martin T.L., Surwit R.S., Robidoux J.2004. Genetic vulnerability to diet-induced obesity in the C57BL/6J mouse: physiological and molecular characteristics. Physiol. Behav. 81: 243–248. doi: 10.1016/j.physbeh.2004.02.006 [DOI] [PubMed] [Google Scholar]
- 3.Gardner D.S.L., Hosking J., Metcalf B.S., Jeffery A.N., Voss L.D., Wilkin T.J.2009. Contribution of early weight gain to childhood overweight and metabolic health: a longitudinal study (EarlyBird 36). Pediatrics 123: e67–e73. doi: 10.1542/peds.2008-1292 [DOI] [PubMed] [Google Scholar]
- 4.Hofbauer K.G.2002. Molecular pathways to obesity. Int. J. Obes. Relat. Metab. Disord. 26:(Suppl 2): S18–S27. doi: 10.1038/sj.ijo.0802124 [DOI] [PubMed] [Google Scholar]
- 5.Ikeda H., Shino A., Matsuo T., Iwatsuka H., Suzuoki Z.1981. A new genetically obese-hyperglycemic rat (Wistar fatty). Diabetes 30: 1045–1050. doi: 10.2337/diab.30.12.1045 [DOI] [PubMed] [Google Scholar]
- 6.Levin B.E., Dunn-Meynell A.A., Balkan B., Keesey R.E.1997. Selective breeding for diet-induced obesity and resistance in Sprague-Dawley rats. Am. J. Physiol. 273: R725–R730. [DOI] [PubMed] [Google Scholar]
- 7.Madsen A.N., Hansen G., Paulsen S.J., Lykkegaard K., Tang-Christensen M., Hansen H.S., Levin B.E., Larsen P.J., Knudsen L.B., Fosgerau K., Vrang N.2010. Long-term characterization of the diet-induced obese and diet-resistant rat model: a polygenetic rat model mimicking the human obesity syndrome. J. Endocrinol. 206: 287–296. doi: 10.1677/JOE-10-0004 [DOI] [PubMed] [Google Scholar]
- 8.Mokdad A.H., Ford E.S., Bowman B.A., Dietz W.H., Vinicor F., Bales V.S., Marks J.S.2003. Prevalence of obesity, diabetes, and obesity-related health risk factors, 2001. JAMA 289: 76–79. doi: 10.1001/jama.289.1.76 [DOI] [PubMed] [Google Scholar]
- 9.Sebert S., Sharkey D., Budge H., Symonds M.E.2011. The early programming of metabolic health: is epigenetic setting the missing link? Am. J. Clin. Nutr. 94:(Suppl): 1953S–1958S. doi: 10.3945/ajcn.110.001040 [DOI] [PubMed] [Google Scholar]
- 10.Sun B., Purcell R.H., Terrillion C.E., Yan J., Moran T.H., Tamashiro K.L.K.2012. Maternal high-fat diet during gestation or suckling differentially affects offspring leptin sensitivity and obesity. Diabetes 61: 2833–2841. doi: 10.2337/db11-0957 [DOI] [PMC free article] [PubMed] [Google Scholar]
- 11.Thompson N.M., Norman A.M., Donkin S.S., Shankar R.R., Vickers M.H., Miles J.L., Breier B.H.2007. Prenatal and postnatal pathways to obesity: different underlying mechanisms, different metabolic outcomes. Endocrinology 148: 2345–2354. doi: 10.1210/en.2006-1641 [DOI] [PubMed] [Google Scholar]
- 12.Yura S., Itoh H., Sagawa N., Yamamoto H., Masuzaki H., Nakao K., Kawamura M., Mogami H., Ogawa Y., Fujii S.2008. Neonatal exposure to leptin augments diet-induced obesity in leptin-deficient Ob/Ob mice. Obesity (Silver Spring) 16: 1289–1295. doi: 10.1038/oby.2008.57 [DOI] [PubMed] [Google Scholar]
- 13.Zhang Y., Proenca R., Maffei M., Barone M., Leopold L., Friedman J.M.1994. Positional cloning of the mouse obese gene and its human homologue. Nature 372: 425–432. doi: 10.1038/372425a0 [DOI] [PubMed] [Google Scholar]


