Abstract
Aims
The present study aims to investigate the role of Akt in the regulation of urinary bladder organ hypertrophy caused by partial bladder outlet obstruction (pBOO).
Main Methods
Male rats were surgically induced for pBOO. Real-time PCR and western blot were used to examine the levels of mRNA and protein. A phosphoinositide 3-kinase (PI3K) inhibitor LY294002 was used to inhibit the activity of endogenous Akt.
Key Findings
The urinary bladder developed hypertrophy at 2 weeks of pBOO. The protein but not mRNA levels of type I collagen and α-smooth muscle actin (αSMA) were increased in pBOO bladder when compared to sham control. The phosphorylation (activation) levels of Akt1 (p-Ser473), mammalian target of rapamycin (mTOR), p70S6 kinase (p70S6K), and 4E-BP1 were also increased in pBOO bladder. LY294002 treatment reduced the phosphorylation levels of Akt1 and 4E-BP1, and the protein levels of type I collagen and αSMA in pBOO bladder. The mRNA and protein levels of proliferating cell nuclear antigen (PCNA) was increased in pBOO bladder, and PCNA up-regulation occurred in urothelial not muscular layer. LY294002 treatment had no effect on the mRNA and protein levels of PCNA in pBOO bladder. LY294002 treatment partially reduced the bladder weight caused by pBOO.
Significance
pBOO-induced urinary bladder hypertrophy is attributable to fibrosis, smooth muscle cellular hypertrophy, and urothelium cell hyper-proliferation. Akt1-mediated protein synthesis in pBOO bladder contributes to type I collagen and αSMA but not PCNA up-regulation. Target of Akt1 is necessary but not sufficient in treatment of urinary bladder hypertrophy following pBOO.
Keywords: urinary bladder, detrusor thickening, Akt1, protein synthesis, pBOO
Introduction
Bladder wall thickening occurs in many diseases and disorders in humans and animals suffering from bladder inflammation (Chung et al., 2010, Wong-You-Cheong et al., 2006), neurological impairment (Altuntas et al., 2012), lower urinary tract obstruction (Inui et al., 1999, Karakose et al., 2014, Kojima et al., 1997, Schroder et al., 2013), or as a natural effect of aging (Tubaro et al., 2010). In clinical studies, bladder wall thickness is considered as a non-invasive and effective test to evaluate patients with lower urinary tract obstruction, and is suggested to be useful for showing the effectiveness of drug treatment (Karakose et al., 2014). Bladder wall thickening is manifested by multiple factors including but not limit to alterations of urothelium metabolic properties, inflammatory responses, fibrosis, and detrusor muscle remodeling (Duan et al., 2015, Kanno et al., 2016, Metcalfe et al., 2010, Michishita et al., 2015, Mirone et al., 2007, Roosen et al., 2009). Understanding of the molecular changes in the thickened bladder wall can provide fundamental information in guiding the development of drugs for treatment.
Experimental pBOO in animals including rats, mice, rabbits, and guinea pigs results in increases in bladder weight and bladder wall thickening. In rats, the bladder weight is increased one week following pBOO induction (Oka et al., 2009). At 6 weeks, the protein content and gene expression of type I and type III collagen are increased in the hypertrophic urinary bladder (Duan et al., 2015, Kim et al., 2000). In guinea pigs, the bladder weight and DNA content are not changed at one week, but are increased at 2, 4, and 8 weeks after obstruction, with transient increases in the mRNA levels of c-fos and c-Myc at 2 weeks (Karim et al., 1992). In rabbit and mice, bladder obstructed for 2 weeks showed smooth muscle cellular hypertrophy (Boopathi et al., 2011, Polyak et al., 2009). To have a complete understanding of the regulation of bladder organ hypertrophy following pBOO, we aim to examine the expression levels of type I collagen, α-smooth muscle actin (αSMA) and proliferating cell nuclear antigen (PCNA) in the urinary bladder at 2 weeks following pBOO. Type I collagen is the most abundant collagen responsible for forming extracellular matrix in skin, tendon, vascular, organs, and bone, and its increase is one of the major factors contributing to fibrosis (Fleischmajer et al., 1990, Shen et al., 2015). αSMA is the predominate isoform of actin within smooth muscle and takes up a substantial portion of the volume of the cytoplasm of smooth muscle cells (Aguilar and Mitchell, 2010). The ratio of αSMA to nuclear protein implicates cellular hypertrophy (Stephenson et al., 1998). PCNA as a scaffold protein is critical for DNA replication, DNA repair, chromatin remodeling and epigenetics, and cell proliferation (Moldovan et al., 2007). Therefore, examination of changes in type I collagen, αSMA and PCNA in the urinary bladder will suggest factors that contribute to bladder wall thickening following pBOO.
Protein production in the urinary bladder relies on the transcriptional and translational activities. In control of protein synthesis, the phosphoinositide 3-kinase (PI3K)/Akt pathway is essential, which mediates the phosphorylation (activity) of mammalian target of rapamycin (mTOR), phosphorylation and activation of p70S6 kinase (p70S6K), and/or phosphorylation of translation initiation factor (eIF4E)-binding proteins (4E-BP), key components in protein translational machinery (Shen et al., 2017, Xu et al., 2011, You et al., 2015). The PI3K/Akt pathway can also regulate gene transcription by phosphorylating a number of transcription factors (Zhang et al., 2007). In our study of inflammation-induced urinary bladder hypertrophy, endogenous nerve growth factor-induced type I collagen protein production is correlated with an activation of Akt1 in the urinary bladder (Chung et al., 2010). Akt1 phosphorylation is increased in the urinary bladder of patients with bladder outlet obstruction (Lin et al., 2011a), and is also regulated by insulin in the urinary bladder of high-fat diet-fed mice (Leiria et al., 2013). It is not known whether activation of Akt1 directly participates in gene transcription and/or protein production in the hypertrophic urinary bladder following pBOO.
The present study is undertaken to characterize the role of Akt in urinary bladder hypertrophy by regulating the expression levels of type I collagen, αSMA and PCNA. The differential role of Akt in the regulation of protein synthesis and gene transcription, and the partial effectiveness of Akt inhibition in reducing bladder hypertrophy suggest a necessary but not sufficient role of Akt as a therapeutic target in treatment of bladder hypertrophy following pBOO.
Method
Animals
Adult male Sprague-Dawley rats (150-200 g) were purchased from Harlan Sprague Dawley, Inc. (Indianapolis, IN). All experimental protocols involving animal use in this study were approved by the Institutional Animal Care and Use Committee in Virginia Commonwealth University. Animal care was in accordance with the Association for Assessment and Accreditation of Laboratory Animal Care (AAALAC) and National Institutes of Health guidelines. All efforts were made to minimize the potential for animal pain, stress or distress as well as to reduce the number of animals used.
Surgery
We created pBOO by surgery. The urinary bladder was exposed via a midline abdominal incision under isoflurane (2.5%) anesthesia. A catheter (outside diameter 1 mm) was placed adjacent to the urethra just distal to the bladder neck. A 4-0 non-absorbable suture was tied around the urethra and catheter, after which the catheter was carefully removed, and the incision was closed. Animals were housed for post-surgery recovery for 2 weeks, and those who had developed bladder hypertrophy were used for this study. A control group underwent a sham operation by exposing the bladder neck but without performing the ligature.
Tissue harvesting
After the animal was weighed, the urinary bladder was freshly dissected out. Excessive liquids inside and outside the bladder were cleaned by autoclaved Kimwipes. The bladder was then weighed. For histology and immunohistochemistry, the urinary bladder was fixed in 4% paraformaldehyde, dehydrated and cryosectioned transversely at a thickness of 8 μm. For western blot, the urinary bladder was homogenized in T-per buffer (Pierce) supplemented with protease (P8340, 1:100, Sigma-Aldrich) and phosphatase inhibitor cocktail 1 (P2850, 1:100, Sigma-Aldrich). For real-time PCR, the urinary bladder was homogenized in RNA extraction buffer (Ambion, TX).
Immunohistochemistry
Cryostat sections were incubated with specific primary antibody of PCNA (1:500, Abcam) followed by secondary antibody conjugated to peroxidase enzyme used for 3,3′-Diaminobenzidine (DAB) stain. A Nikon brightfield microscope equipped with a color camera were used to obtain microscopic photographs. For analysis of PCNA immunoreactivity in the tissue, three random microscopy fields were chosen from each section with caution to avoid field overlap. We focused on the detrusor muscle and urothelium layers. The number of PCNA positive cells in each field was counted. Results were averaged. The size of the area in the microscopic field that contained cells were measured, for the purpose of normalization, with free-tool software installed with the microscopy. The PCNA expression level was expressed as number of immuno-positive cells per mm2 area.
Western blot
The urinary bladder protein extracts were centrifuged at 20,200 g for 10 min at 4 °C. The supernatants were removed to a fresh tube for further analysis. The protein concentration was determined using Bio-Rad DC protein assay kit. Proteins were separated on a 7.5-15% SDS-PAGE gel and transferred to a nitrocellulose membrane. The membrane was blocked with 5% milk in Tris-buffered saline for 1 hour and then incubated with primary antibodies against phospho-Akt Ser473 (1:1000, Cell Signaling), phospho-Akt Ser474 (1:1000, Millipore), phospho-mTOR (1:1000, Cell Signaling), phospho-p70S6K (1:500, Millipore), phospho-4E-BP1 (1:1000, Cell Signaling), total Akt (1:1000, Cell Signaling), αSMA (1:1000, Millipore), type I collagen (1:1000, Cell Signaling), PCNA (1:1000), histone H3 (1:2000, Millipore), and beta-actin (β-actin, 1:5000, Sigma). After washing, the membrane was incubated with horseradish peroxidase-conjugated secondary antibody. The bands were identified by ECL-exposed films that were then digitized and performed for densitometric quantification using the software FluorChem 8800 (Alpha Innotech, San Leabdro, CA). The levels of phospho and non-phospho protein of interest were normalized with the level of internal loading controls (i.e. total Akt, β-actin, H3). The expression level of the protein of interest in control animal from each independent experiment was considered as 1, and the relative expression level of the protein of interest in experimental animals was adjusted as a ratio to control animals.
RNA extraction and real-time PCR
Total RNA was extracted using a RNA extraction kit RNAqueous (Ambion, TX). RNA concentration was determined spectrophotometrically. cDNA was synthesized using High Capacity cDNA Reverse Transcription Kit (Applied Biosystems, ABI). Realtime PCR was performed using SYBR Green as indicator on StepOnePlus™ Systems (Applied Biosystems, ABI). PCR was carried out for 40 cycles of 95°C for 15s and 60°C for 1 min. The fluorescence was detected during the reaction, allowing a continuous monitoring of the amount of PCR product. After the PCR reaction, dissociation curve was monitored to verify the specificity of the reaction. The level of target mRNA was normalized against the expression of the internal control 18S, and was calculated with ΔCt method (ΔCt=Ct target gene – Ct internal control in the same sample). The expression level of target mRNA in control group from each independent experiment was considered as 1, and the relative expression level of target mRNA in experimental groups was adjusted as a ratio to its control in each independent experiment and expressed as fold changes (2-ΔΔCt fold) (ΔΔCt = ΔCt experimental group – ΔCt control group).
Drug treatment
LY294002 (MilliporeSigma-Calbiochem) was dissolved in DMSO as stock and diluted in saline for injection at a dose of 50 ug/kg body weight (i.p.) every fourth day for 2 weeks after induction of pBOO. DMSO as vehicle control was diluted in the same manner as LY294002 was. The diluted DMSO was injected to both sham and pBOO animals for the same amount as and in parallel to LY294002 based on the bodyweight of the animals. The dose of LY294002 was originally used in our previous studies to inhibit urinary bladder hypertrophy up to 48 hours induced by acute inflammation (Qiao et al., 2014). However, injection of LY294002 to pBOO rats once every 48 hours caused severe sickness to animals, possibly due to toxicity. We reduced the frequency of injection to once every four days for a total of 4 injections within the 2-week experimental period. We found that this treatment regime effectively reduced the phosphorylation level of endogenous Akt1 in pBOO rats. Thus we used this dose and frequency for all related experiments.
Statistical analysis
The results from each study were presented as mean ± SD. Comparison between control and experimental groups was made by using Kruskal-Wallis nonparametric one-way ANOVA, or the student's t test. Differences between means at a level of p≤0.05 were considered to be significant.
Results
Expression of type I collagen, αSMA, and PCNA in the hypertrophic urinary bladder
At 2 weeks post pBOO induction, we measured the weight of the urinary bladder and the body weight of the animals to ensure that the pBOO operation was effective to induce bladder hypertrophy. We found that 5 out 6 rats developed urinary bladder hypertrophy, with one had severe urinary bladder retention which was eliminated from further examination. We focused on the 5 hypertrophic urinary bladder. The 5 sham-operated rats had normal sized urinary bladder. The ratio of the bladder weight to body weight for the hypertrophic urinary bladder was significantly larger (Figure 1A, p<0.01) compared to sham-operated control. The ratio of the bladder weight to body weight in sham-operated control and naïve animals had no significant difference. We then measured the thickness of the detrusor wall after H&E stain (Figure 1B to 1C) and found that the detrusor wall was also significantly thicker for the hypertrophic urinary bladder when compared to control (Figure 1D, p<0.05). To determine the factors that contribute to urinary bladder wall thickening, we compared the mRNA and protein levels of type I collagen, αSMA, and PCNA in the hypertrophic and control urinary bladder.
Figure 1. Validation of urinary bladder hypertrophy after pBOO.

At 2 weeks after pBOO, there is an increase in the ratio of the bladder weight to body weight (A). H&E stain (B and C) shows an increase in the thickness of the detrusor wall (D). **, p<0.01 and *, p<0.05 vs. sham control. Bar = 200 μm.
The protein levels of type I collagen in the hypertrophic urinary bladder were 2.4-fold higher than those in control (Figure 2A, western blot; Figure 2B, protein; p<0.05). The mRNA levels of type I collagen in the hypertrophic and control urinary bladder were the same (Figure 2B, mRNA). Since the level of type I collagen is closely related to the degree of fibrosis, we performed trichrome stain of the urinary bladder, which showed an increase in the content of extracellular matrix in pBOO bladder when compared to control (Figure 2C-D: blue stain).
Figure 2. Up-regulation of type I collagen in the hypertrophic urinary bladder.
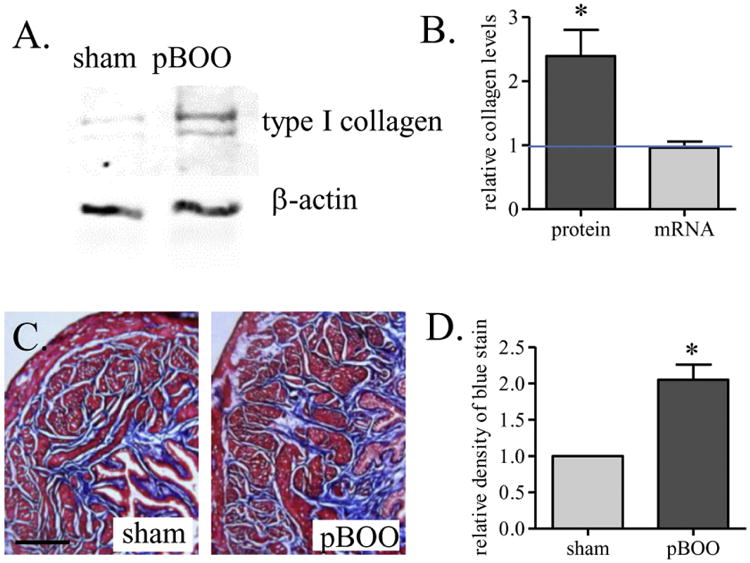
Western blot (A) analysis shows an increase in the protein expression level of type I collagen (B, protein). Real-time PCR analysis shows that the mRNA level of type I collagen is not changed by 2 weeks of pBOO (B, mRNA). Trichrome stain analysis of the blue stain shows increases in fibrosis in the hypertrophic urinary bladder (C-D). *, p<0.05 vs. sham control. Bar = 200 μm.
The protein levels of αSMA were examined in relative to the levels of nuclear protein histone 3 (H3). We found that the ratio of αSMA/H3 was significantly higher in the hypertrophic urinary bladder (Figure 3A, western blot; Figure 3B, densitometry, p<0.05). We also found that the mRNA levels of αSMA were not changed in the urinary bladder after pBOO (Figure 3C). The up-regulation of αSMA relative to H3 suggested that the content of cytoplasm proteins was greater in the hypertrophic urinary bladder, reflecting cellular hypertrophy (Stephenson et al., 1998). Histological characterization showed that there were fewer smooth muscle cells in normalized area in the hypertrophic urinary bladder compared to control (Figure 3D-F, arrows indicated nucleus), which might be due to excessive deposition of extracellular matrix between two cells or the enlargement of cell volume (cellular hypertrophy) due to excessive production of cytoplasm proteins.
Figure 3. Up-regulation of αSMA in the hypertrophic urinary bladder.
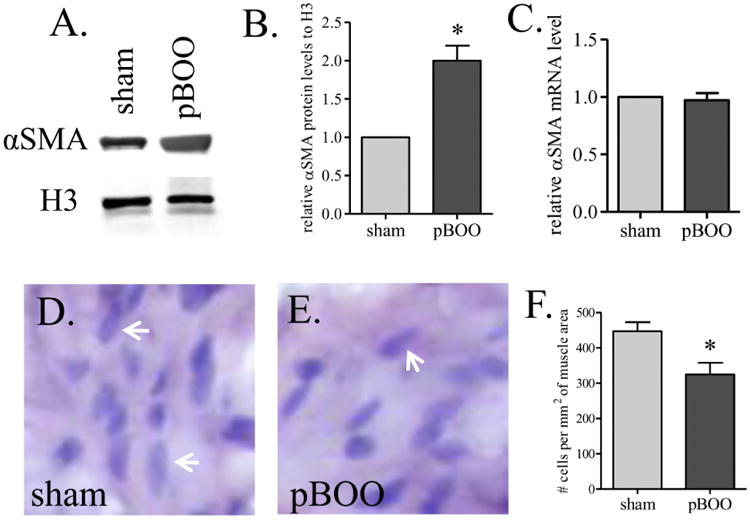
The protein level of αSMA is increased in the urinary bladder by pBOO (A-B). The mRNA level of αSMA is not changed (C). The density of smooth muscle cells in pBOO bladder is smaller than that in sham-operated control (D-F). Arrows indicate nucleuses of smooth muscle cell (D-E). *, p<0.05 vs. sham control.
To test whether there was hyperplasia and/or urothelium cell hyper-proliferation in the hypertrophic urinary bladder, we examined the mRNA and protein levels of PCNA. We found that there were increases in both the mRNA and proteins levels of PCNA in pBOO bladder when compared to sham control (Figure 4A-C, p<0.05). The up-regulation of PCNA was distributed in the urothelium layer (Figure 4D-F, p<0.05), not the smooth muscle layer (Figure 4G-I).
Figure 4. Up-regulation of PCNA in the hypertrophic urinary bladder.
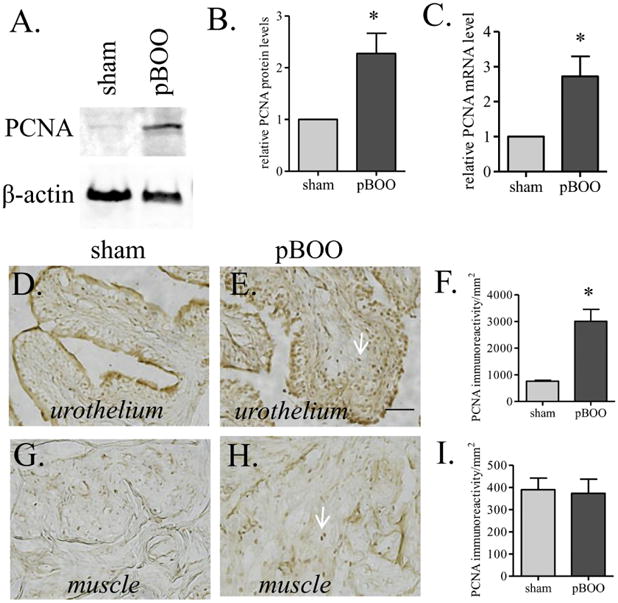
Both of the protein (A-B) and mRNA (C) levels of PCNA are increased in the hypertrophic urinary bladder when compared to sham control. The increases in PCNA are shown in the urothelium layer (D-F), but not the smooth muscle layer (G-I). Arrows indicate PCNA stain. *, p<0.05. Bar = 20 μm.
Increased phosphorylation of Akt and components of protein synthesis in the hypertrophic urinary bladder
Our data that the protein levels but not mRNA levels of type I collagen and αSMA were increased in the hypertrophic urinary bladder suggests a likelihood of an up-regulation of the protein synthesis pathway. We compared the phosphorylation levels of Akt, mTor, p70S6K, and 4E-BP1 in the hypertrophic and control urinary bladder. We found that the levels of phospho-Akt Ser473 (Akt1) but not phospho-Akt Ser474 (Akt2) was increased in the hypertrophic urinary bladder (Figure 5, p<0.05). One of the major functions of Akt1 is to activate the protein synthesis pathways by phosphorylating mTor. We found that the phosphorylation levels of mTor and its downstream molecules p70S6K and 4E-BP1 were also up-regulated in the hypertrophic urinary bladder (Figure 6, p<0.05).
Figure 5. Increases in the phosphorylation level of Akt1 but not Akt2 in the hypertrophic urinary bladder.
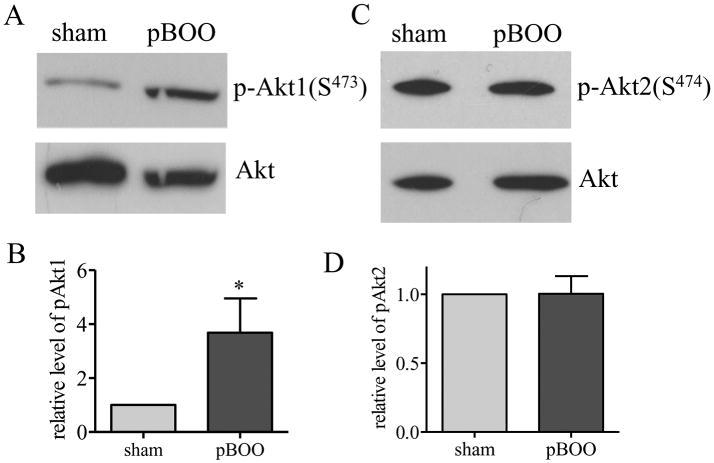
Western blot with specific phospho-protein antibodies shows an increase in the phosphorylation level of Akt1 (A-B) but not Akt2 (C-D) in the hypertrophic urinary bladder when compared to sham control. *, p<0.05.
Figure 6. Increases in the phosphorylation levels of mTOR, p70S6K, and 4E-BP1 in the hypertrophic urinary bladder.
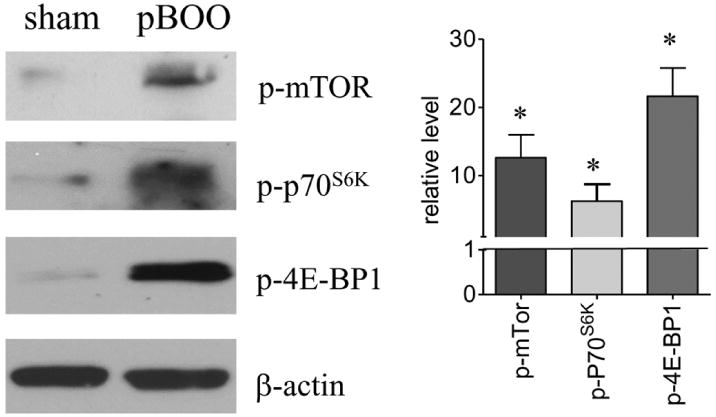
Western blot with specific phospho-protein antibodies shows that the phosphorylation levels of mTOR, p70S6K and 4E-BP1 are increased in hypertrophic urinary bladder when compared to sham control. *, p<0.05.
Suppression of endogenous Akt phosphorylation by PI3K inhibitor LY294002 reduced the phosphorylation level of 4E-BP1
To examine whether Akt1 indeed activated the protein synthesis pathway in the hypertrophic urinary bladder, we treated the pBOO animals with LY294002 or vehicle control (4 animals for each group). Vehicle (DMSO+saline) treatment did not inhibit pBOO-induced up-regulation of Akt1 and 4E-BP1 phosphorylation in the urinary bladder (p<0.05). LY294002 treatment reduced the phosphorylation level of Akt1 in pBOO bladder when compared to vehicle-treated pBOO (Figure 7A-B, p<0.05), suggesting the effectiveness of LY294002 treatment in reducing the endogenous Akt phosphorylation level. LY294002 treatment also reduced the phosphorylation level of 4E-BP1 in the hypertrophic urinary bladder (Figure 7C-D, p<0.05), suggesting the involvement of PI3K/Akt in mediating the activity of 4E-BP1 thereby protein synthesis.
Figure 7. Inhibition of Akt1 and 4E-BP1 in pBOO bladder by LY294002 treatment.
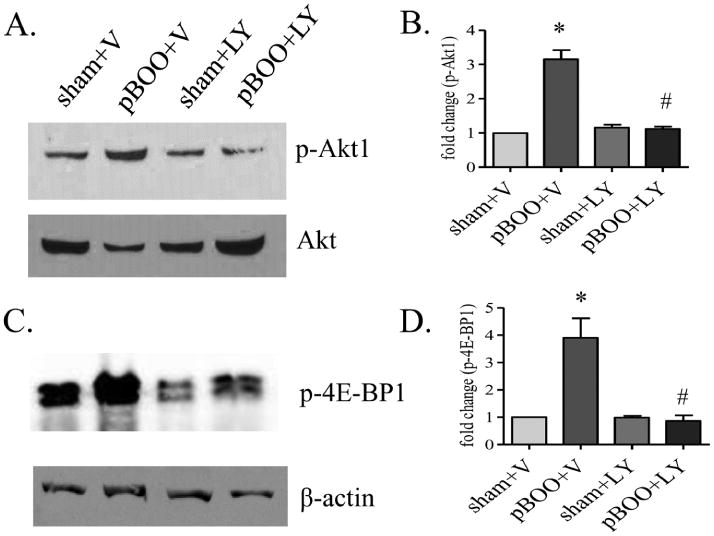
LY294002 (LY) treatment reduces the phosphorylation levels of Akt1 (A-B) and 4E-BP1 (C-D) in pBOO bladder when compared to those in vehicle-treated pBOO bladder (#, p<0.05). Vehicle treatment does not affect the up-regulation of the phosphorylation levels of Akt1 (A-B) and 4E-BP1 (C-D) caused by pBOO when compared to vehicle-treated sham control (*, p<0.05).
LY294002 treatment on the expression levels of type I collagen, αSMA, PCNA, and bladder weight
Vehicle treatment did not inhibit pBOO-induced up-regulation of type I collagen, αSMA and PCNA in the urinary bladder (p<0.05). LY294002 treatment reduced the protein levels of type I collagen (Figure 8A, B, p<0.05) and αSMA (Figure 8A, C, p<0.05) in the pBOO bladder when compared to vehicle-treated pBOO. LY294002 treatment did not reduce the protein and mRNA levels of PCNA in the pBOO bladder when compared to vehicle-treated pBOO (Figure 8A, D-E).
Figure 8. Reduction of type I collagen and αSMA but not PCNA in pBOO bladder by LY294002 treatment.
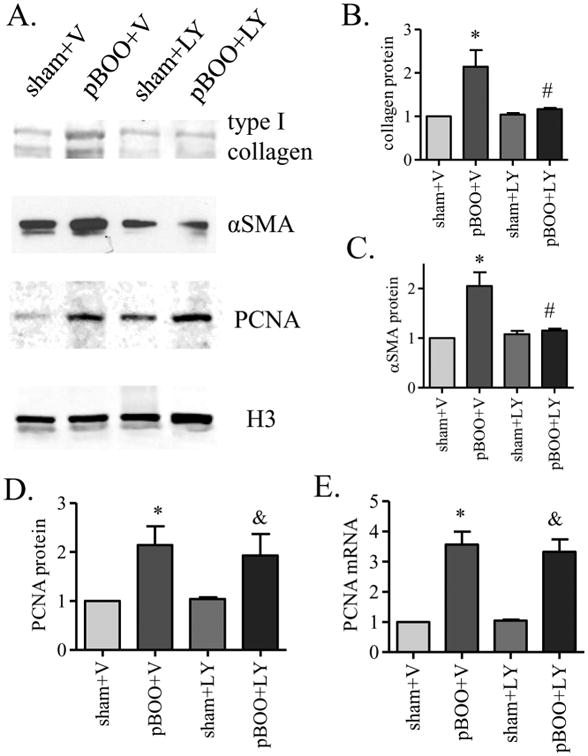
LY294002 (LY) treatment reduces the protein levels of type I collagen (A-B) and αSMA (A, C) in pBOO bladder when compared to those in vehicle-treated pBOO bladder (#, p<0.05). There are no significant difference in the levels of type I collagen (A-B) and αSMA (A, C) in LY-treated pBOO bladder when compared to LY-treated sham control. LY treatment does not reduce the protein (A, D) and mRNA (E) levels of PCNA in pBOO bladder when compared to those in vehicle-treated pBOO bladder. There is still a significant up-regulation of PCNA in LY-treated pBOO bladder when compared to LY-treated sham control (&, p<0.05). Vehicle treatment does not affect the up-regulation of type I collagen (A-B), αSMA (A, C) and PCNA (A, D-E) caused by pBOO when compared to vehicle-treated sham control (*, p<0.05).
Following vehicle (DMSO) treatment, the ratio of bladder weight to body weight of pBOO animals was about 5-fold higher than vehicle-treated sham-operated animals (Figure 9). LY294002-treated pBOO rats had significantly smaller urinary bladder than vehicle-treated pBOO rats (Figure 9, p<0.01), however, the ratio of bladder weight to body weight of pBOO animals following LY294002 treatment was still significantly higher (∼3 folds) than that in LY294002-treated sham-operated rats (Figure 9, p<0.01).
Figure 9. Induction of bladder weight in pBOO by LY294002 treatment.
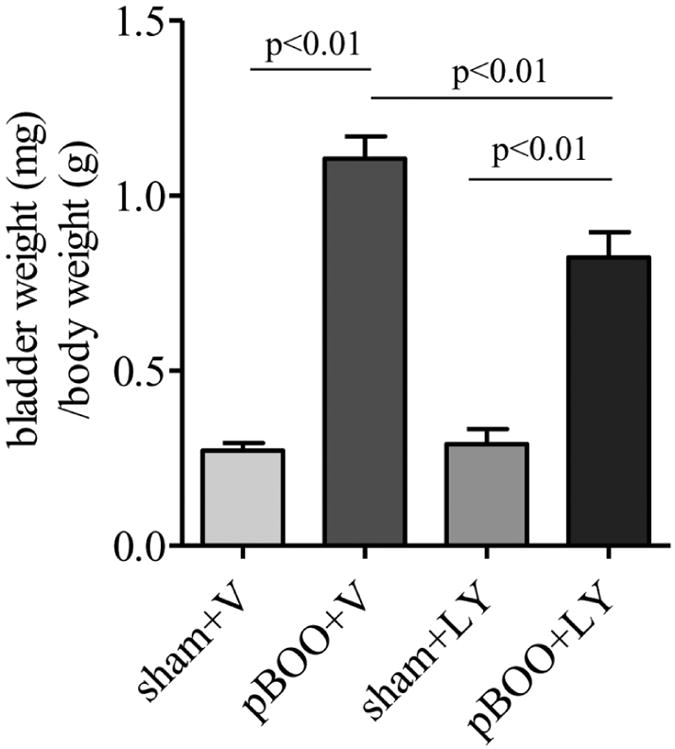
Vehicle treatment does not affect the increase in the ratio of bladder weight to body weight in pBOO rats when compared to vehicle-treated sham control. LY294002 (LY) treatment significantly reduced the bladder weight in pBOO rats when compared to vehicle-treated pBOO rats. The bladder weight in LY-treated pBOO rats is significantly higher than LY-treated sham control.
Discussion
The present study demonstrates that urinary bladder hypertrophy induced by 2 weeks of pBOO involves up-regulation of the protein levels of type I collagen, αSMA, and PCNA in the urinary bladder, indicating contributions of fibrosis, cellular hypertrophy, and cell hyper-proliferation in bladder wall thickening. Although the protein levels of type I collagen and αSMA are increased by pBOO, their mRNA levels are not changed in the hypertrophic urinary bladder when compared to sham-operated control. This infers that the activity of protein synthesis might be up-regulated in the urinary bladder at 2 weeks of pBOO. Akt1, mTor, p70S6K, and 4E-BP1 are major components that are involved in mRNA translation (Chung et al., 1992, Xu et al., 2011). At 2 weeks of pBOO, the phosphorylation levels of Akt1, mTor, p70S6K, and 4E-BP1 are increased in the urinary bladder. Suppression of PI3K, the Akt kinase, with inhibitor LY294002 reduced the phosphorylation levels of Akt1 and 4E-BP1, and the protein levels of type I collagen and αSMA. However, suppression of Akt1 with LY294002 does not inhibit PCNA expression. In the hypertrophic urinary bladder, PCNA is increased mainly in the urothelium layer but not the muscle layer. These results suggest that Akt1 prefers regulating the pathways in the detrusor muscle layer that produces type I collagen and αSMA to the pathways in the urothelium layer that produces PCNA. Inhibition of Akt by LY294002 partially reduces bladder weight caused by pBOO. Thus inhibition of Akt1-mediated protein synthesis might be necessary but not sufficient in treatment of urinary bladder hypertrophy in pBOO.
The urinary bladder is made of four layers. The innermost urothelium layer, which is made of epithelium cells, acts as a permeability barrier protecting underlying tissues against noxious urine components; the next suburothelium space contains nerves, blood vessels and connective tissues; the muscular layer is called the detrusor muscle which controls the distension and contraction of the urinary bladder, and is surrounded by the outer layer, a serous membrane. Although the causes of bladder wall thickening are not clear, studies in several disease states including pBOO show that it involves one or more of the following factors: urothelial expansion, enlargement of lamina propria spaces, detrusor smooth muscle layer thickening, serous membrane inflammation, and subserous widening (Altuntas et al., 2012, Chang et al., 2009, Kanno et al., 2016, Michishita et al., 2015, Qiao et al., 2014, Tubaro et al., 2005, Tubaro et al., 2010). In the present study, type I collagen up-regulation may result in excessive deposition of fibrotic matrix which can contribute to the enlargement of lamina propria and subserous spaces in the hypertrophic urinary bladder. Up-regulation of αSMA in relative to H3 implicates cellular hypertrophy which may contribute to the thickening the detrusor muscle layers. The up-regulation of PCNA in the urothelium may contribute to urothelial hyper-proliferation thereby expansion of the mucosal folds. Therefore, pBOO-induced urinary bladder hypertrophy involves multifaceted changes at molecular level in both urothelium and smooth muscle layers.
Studies in many experimental species including rats, mice, rabbits, and guinea pigs show that fibrosis and inflammation are common factors in urinary bladder hypertrophy (Metcalfe et al., 2010). The cues that lead to fibrosis and inflammation in the urinary bladder are not clear, but have been suggested to involve a number of processes including but not limit to up-regulation of transforming growth factor (TGF)-β1 (Jiang et al., 2015, Zhang and Qiao, 2012), imbalance between matrix metalloproteinase-1 (MMP-1) and tissue inhibitor of metalloproteinase-1 (TIMP-1) (Yang et al., 2013), mast cell accumulation (Michishita et al., 2015), ATP release from serosa (Shiina et al., 2016), oxidative stress and free radical damage (Lin et al., 2011b), and up-regulation of nerve growth factor (NGF) and other growth factors (Chung et al., 2010, Steers and Tuttle, 2006, Zhang and Qiao, 2012). Many of these cues are related to activation of the serine/threonine kinase Akt that serves as a central stage in signal transduction. In the present study, we show that inhibition of endogenous Akt activity partially reduces bladder hypertrophy caused by pBOO. We demonstrate that up-regulation of Akt leads to excessive protein production of type I collagen and αSMA in the hypertrophic urinary bladder, however, the increased PCNA levels in urothelium is not regulated by Akt. It is reported that at 6 weeks of pBOO, the up-regulation of type I and type III collagen mRNA and protein are observed in the hypertrophic urinary bladder (Duan et al., 2015, Kim et al., 2000). At 2 weeks of pBOO, we only observe an up-regulation of collagen protein but not mRNA in the urinary bladder, and in the same sample we detect an Akt-independent up-regulation of PCNA mRNA levels. These results suggest that transcription and translation are two independent biological processes in the development of bladder hypertrophy following pBOO. The Akt-mediated signaling pathway regulates the translational process regardless of the changes in the transcriptional levels.
We examined two Akt isoforms, Akt1 and Akt2, and found that only Akt1 was activated in the hypertrophic urinary bladder induced by pBOO. Akt1 is originally identified as the oncogene in the transforming retrovirus (Staal et al., 1977). The underlying mechanisms of Akt1 in regulating cell growth are attributable to its ability of preventing apoptosis (Green et al., 2013) and enhancing protein synthesis (Norrby et al., 2012). This is true that when we inhibit Akt1, we also blocks the phosphorylation level of 4E-BP1, a key molecule that regulates mRNA translation. It is documented that Akt1 is a key signaling protein that leads to skeletal muscle hypertrophy (Bodine et al., 2001). In the present study, we show that inhibition of Akt1 also blocks the protein level of αSMA in the pBOO urinary bladder. αSMA composes major protein content in the cytoplasm of smooth muscle cells. We detect an up-regulation of αSMA protein in relative to nuclear protein H3 in the pBOO urinary bladder. We also observe that the distance between two nucleuses of smooth muscle cells in the pBOO bladder is larger when compared to sham-operated control. This could be due to excessive extracellular collagen deposition or smooth muscle hypertrophy. Although hyperplasia is considered as an important factor in urinary bladder hypertrophy, we fail to detect an up-regulation of PCNA in the smooth muscle layer at 2 weeks of pBOO. This does not preclude that PCNA is not changed in the smooth muscle layer at short-term (1 week) or long-term (6 weeks) pBOO.
LY294002 is a pan inhibitor of PI3K and is widely used for mechanistic studies of the PI3K-mediated signaling pathways in vivo and vitro. The present study demonstrates that LY294002 treatment of pBOO animals reduces the elevated phosphorylation levels of Akt1 and 4E-BP1, suggesting a PI3K-dependent activation of protein synthesis in the hypertrophic urinary bladder. LY294002 treatment also nearly abrogates the protein levels of type I collagen and αSMA that is expressed by the muscle layer but barely has effects on the expression of PCNA that is expressed by the urothelial layer, suggesting that PI3K/Akt1-mediated protein synthesis are tissue/cell/molecule specific. When comparing the fold increases in the bladder weight (4-5 folds) and the thickness of the bladder muscular wall (1.6 folds) following pBOO, we conclude that the increased thickness of the bladder muscular wall that is attributed by collagen and αSMA up-regulation is, but not all factors contributing to the development of bladder organ hypertrophy. The urothelial hypertrophy governed by PCNA expression and independent of the PI3K/Akt pathway might be the major cause of the urinary bladder hypertrophy in pBOO thus LY294002 treatment only partially reduces pBOO-induced urinary bladder hypertrophy.
Bladder outlet obstruction is an urinary disorder stemming from a variety of causes such as posterior urethral valves in children (Dinneen and Duffy, 1996, Mirshemirani et al., 2013), benign prostatic hyperplasia in men (Nordling, 1994), and urethral stricture as well as other conditions (Mondet et al., 2001). Patients with obstruction are at increased risk of urinary tract infections due to incomplete bladder emptying and postvoid residues (Chapple and Roehrborn, 2006, Jain et al., 2014, Kaplan et al., 2008). Urinary bladder wall thickening after obstruction is considered as an effective test to evaluate the effectiveness of drug treatment (Karakose et al., 2014). Many small molecule inhibitors of the PI3K/Akt pathway have been developed and are under clinical evaluation (Massacesi et al., 2016). Inhibition of the Akt1-mediated protein synthesis may be effective, at least in part, in the treatment of pBOO-induced urinary bladder hypertrophy.
Acknowledgments
This work was supported, in part, by grant NIH DK077917 (LYQ) and VCU Dean's Research Funds (LYQ)
Footnotes
Conflict of Interest statement: The authors declare that there are no conflicts of interest.
Publisher's Disclaimer: This is a PDF file of an unedited manuscript that has been accepted for publication. As a service to our customers we are providing this early version of the manuscript. The manuscript will undergo copyediting, typesetting, and review of the resulting proof before it is published in its final citable form. Please note that during the production process errors may be discovered which could affect the content, and all legal disclaimers that apply to the journal pertain.
References
- Aguilar HN, Mitchell BF. Physiological pathways and molecular mechanisms regulating uterine contractility. Hum Reprod Update. 2010;16:725–44. doi: 10.1093/humupd/dmq016. [DOI] [PubMed] [Google Scholar]
- Altuntas CZ, Daneshgari F, Izgi K, Bicer F, Ozer A, Sakalar C, et al. Connective tissue and its growth factor CTGF distinguish the morphometric and molecular remodeling of the bladder in a model of neurogenic bladder. Am J Physiol Renal Physiol. 2012;303:F1363–9. doi: 10.1152/ajprenal.00273.2012. [DOI] [PMC free article] [PubMed] [Google Scholar]
- Bodine SC, Stitt TN, Gonzalez M, Kline WO, Stover GL, Bauerlein R, et al. Akt/mTOR pathway is a crucial regulator of skeletal muscle hypertrophy and can prevent muscle atrophy in vivo. Nat Cell Biol. 2001;3:1014–9. doi: 10.1038/ncb1101-1014. [DOI] [PubMed] [Google Scholar]
- Boopathi E, Gomes CM, Goldfarb R, John M, Srinivasan VG, Alanzi J, et al. Transcriptional repression of Caveolin-1 (CAV1) gene expression by GATA-6 in bladder smooth muscle hypertrophy in mice and human beings. Am J Pathol. 2011;178:2236–51. doi: 10.1016/j.ajpath.2011.01.038. [DOI] [PMC free article] [PubMed] [Google Scholar]
- Chang A, Butler S, Sliwoski J, Valentino R, Canning D, Zderic S. Social stress in mice induces voiding dysfunction and bladder wall remodeling. Am J Physiol Renal Physiol. 2009;297:F1101–8. doi: 10.1152/ajprenal.90749.2008. [DOI] [PMC free article] [PubMed] [Google Scholar]
- Chapple CR, Roehrborn CG. A shifted paradigm for the further understanding, evaluation, and treatment of lower urinary tract symptoms in men: Focus on the bladder. Eur Urol. 2006;49:651–9. doi: 10.1016/j.eururo.2006.02.018. [DOI] [PubMed] [Google Scholar]
- Chung CW, Zhang QL, Qiao LY. Endogenous Nerve Growth Factor Regulates Collagen Expression and Bladder Hypertrophy through Akt and MAPK Pathways during Cystitis. Journal of Biological Chemistry. 2010;285:4206–12. doi: 10.1074/jbc.M109.040444. [DOI] [PMC free article] [PubMed] [Google Scholar]
- Chung J, Kuo CJ, Crabtree GR, Blenis J. Rapamycin-FKBP specifically blocks growth-dependent activation of and signaling by the 70 kd S6 protein kinases. Cell. 1992;69:1227–36. doi: 10.1016/0092-8674(92)90643-q. [DOI] [PubMed] [Google Scholar]
- Dinneen MD, Duffy PG. Posterior urethral valves. British Journal of Urology. 1996;78:275–81. doi: 10.1046/j.1464-410x.1996.10324.x. [DOI] [PubMed] [Google Scholar]
- Duan LJ, Qi J, Huang T, Gu X, Xu D, Kong XJ, et al. Pirfenidone attenuates bladder fibrosis and mitigates deterioration of bladder function in a rat model of partial bladder outlet obstruction. Mol Med Rep. 2015;12:3639–47. doi: 10.3892/mmr.2015.3814. [DOI] [PubMed] [Google Scholar]
- Fleischmajer R, Perlish JS, Burgeson RE, Shaikh-Bahai F, Timpl R. Type I and type III collagen interactions during fibrillogenesis. Ann N Y Acad Sci. 1990;580:161–75. doi: 10.1111/j.1749-6632.1990.tb17927.x. [DOI] [PubMed] [Google Scholar]
- Green BD, Jabbour AM, Sandow JJ, Riffkin CD, Masouras D, Daunt CP, et al. Akt1 is the principal Akt isoform regulating apoptosis in limiting cytokine concentrations. Cell Death Differ. 2013;20:1341–9. doi: 10.1038/cdd.2013.63. [DOI] [PMC free article] [PubMed] [Google Scholar]
- Inui E, Ochiai A, Naya Y, Ukimura O, Kojima M. Comparative morphometric study of bladder detrusor between patients with benign prostatic hyperplasia and controls. J Urology. 1999;161:827–30. [PubMed] [Google Scholar]
- Jain S, Agarwal MM, Mavuduru R, Singh SK, Mandal AK. Micturitional urethral pressure profilometry for the diagnosis, grading, and localization of bladder outlet obstruction in adult men: a comparison with pressure-flow study. Urology. 2014;83:550–5. doi: 10.1016/j.urology.2013.10.012. [DOI] [PubMed] [Google Scholar]
- Jiang XX, Chen YP, Zhu HT, Wang B, Qu P, Chen RF, et al. Sodium Tanshinone IIA Sulfonate Ameliorates Bladder Fibrosis in a Rat Model of Partial Bladder Outlet Obstruction by Inhibiting the TGF-beta/Smad Pathway Activation. Plos One. 2015;10 doi: 10.1371/journal.pone.0129655. [DOI] [PMC free article] [PubMed] [Google Scholar]
- Kanno Y, Mitsui T, Kitta T, Moriya K, Tsukiyama T, Hatakeyama S, et al. The inflammatory cytokine IL-1 is involved in bladder remodeling after bladder outlet obstruction in mice. Neurourol Urodynam. 2016;35:377–81. doi: 10.1002/nau.22721. [DOI] [PubMed] [Google Scholar]
- Kaplan SA, Wein AJ, Staskin DR, Roehrborn CG, Steers WD. Urinary retention and post-void residual urine in men: separating truth from tradition. J Urol. 2008;180:47–54. doi: 10.1016/j.juro.2008.03.027. [DOI] [PubMed] [Google Scholar]
- Karakose A, Aydogdu O, Atesci YZ. The relationship between bladder wall thickness and lower urinary tract symptoms: Does bladder wall thickness change after alpha-blocker therapy with alfuzosin? Cuaj-Can Urol Assoc. 2014;8:E26–E9. doi: 10.5489/cuaj.1513. [DOI] [PMC free article] [PubMed] [Google Scholar]
- Karim OMA, Seki N, Mostwin JL. Detrusor Hyperplasia and Expression of Immediate Early Genes with Onset of Abnormal Urodynamic Parameters. Am J Physiol. 1992;263:R1284–R90. doi: 10.1152/ajpregu.1992.263.6.R1284. [DOI] [PubMed] [Google Scholar]
- Kim JC, Yoon JY, Seo SI, Hwang TK, Park YH. Effects of partial bladder outlet obstruction and its relief on types I and III collagen and detrusor contractility in the rat. Neurourol Urodynam. 2000;19:29–42. doi: 10.1002/(sici)1520-6777(2000)19:1<29::aid-nau5>3.0.co;2-#. [DOI] [PubMed] [Google Scholar]
- Kojima M, Inui E, Ochiai A, Naya Y, Kamoi K, Ukimura O, et al. Reversible change of bladder hypertrophy due to benign prostatic hyperplasia after surgical relief of obstruction. J Urology. 1997;158:89–93. doi: 10.1097/00005392-199707000-00024. [DOI] [PubMed] [Google Scholar]
- Leiria LO, Sollon C, Báu FR, Mónica FZ, D'Ancona CL, De Nucci G, Grant AD, Anhê GF, Antunes E. Insulin relaxes bladder via PI3K/AKT/eNOS pathway activation in mucosa: unfolded protein response-dependent insulin resistance as a cause of obesity-associated overactive bladder. J Physiol. 2013;591:2259–73. doi: 10.1113/jphysiol.2013.251843. [DOI] [PMC free article] [PubMed] [Google Scholar]
- Lin W, Rahman NA, Lin JA, Zhang H, Gou KM, Yu WP, et al. Molecular Mechanisms of Bladder Outlet Obstruction in Transgenic Male Mice Overexpressing Aromatase (Cyp19a1) American Journal of Pathology. 2011a;178:1233–44. doi: 10.1016/j.ajpath.2010.11.056. [DOI] [PMC free article] [PubMed] [Google Scholar]
- Lin WY, Chen CS, Wu SB, Lin YP, Levin RM, Wei YH. Oxidative stress biomarkers in urine and plasma of rabbits with partial bladder outlet obstruction. Bju Int. 2011b;107:1839–43. doi: 10.1111/j.1464-410X.2010.09597.x. [DOI] [PubMed] [Google Scholar]
- Massacesi C, Di Tomaso E, Urban P, Germa C, Quadt C, Trandafir L, et al. PI3K inhibitors as new cancer therapeutics: implications for clinical trial design. Oncotargets Ther. 2016;9:203–10. doi: 10.2147/OTT.S89967. [DOI] [PMC free article] [PubMed] [Google Scholar]
- Metcalfe PD, Wang JF, Jiao HY, Huang Y, Hori K, Moore RB, et al. Bladder outlet obstruction: progression from inflammation to fibrosis. Bju Int. 2010;106:1686–94. doi: 10.1111/j.1464-410X.2010.09445.x. [DOI] [PubMed] [Google Scholar]
- Michishita M, Tomita K, Yano K, Kasahara K. Mast Cell Accumulation and Degranulation in Rat Bladder with Partial Outlet Obstruction. Adv Ther. 2015;32:S16–S28. doi: 10.1007/s12325-015-0243-z. [DOI] [PubMed] [Google Scholar]
- Mirone V, Imbimbo C, Longo N, Fusco F. The detrusor muscle: An innocent victim of bladder outlet obstruction. Eur Urol. 2007;51:57–66. doi: 10.1016/j.eururo.2006.07.050. [DOI] [PubMed] [Google Scholar]
- Mirshemirani A, Khaleghnejad A, Rouzrokh M, Sadeghi A, Mohajerzadeh L, Sharifian M. Posterior Urethral Valves; A single Center Experience. Iran J Pediatr. 2013;23:531–5. [PMC free article] [PubMed] [Google Scholar]
- Moldovan GL, Pfander B, Jentsch S. PCNA, the maestro of the replication fork. Cell. 2007;129:665–79. doi: 10.1016/j.cell.2007.05.003. [DOI] [PubMed] [Google Scholar]
- Mondet F, Chartier-Kastler EJ, Conort P, Bitker MO, Chatelain C, Richard F. Anatomic and functional results of transperitoneal-transvesical vesicovaginal fistula repair. Urology. 2001;58:882–6. doi: 10.1016/s0090-4295(01)01395-4. [DOI] [PubMed] [Google Scholar]
- Nordling J. Definition Of Prostatic Urethral Obstruction. Urological Research. 1994;22:267–71. doi: 10.1007/BF00297193. [DOI] [PubMed] [Google Scholar]
- Norrby M, Evertsson K, Fjallstrom AK, Svensson A, Tagerud S. Akt (protein kinase B) isoform phosphorylation and signaling downstream of mTOR (mammalian target of rapamycin) in denervated atrophic and hypertrophic mouse skeletal muscle. J Mol Signal. 2012;7:7. doi: 10.1186/1750-2187-7-7. [DOI] [PMC free article] [PubMed] [Google Scholar]
- Oka M, Fukui T, Ueda M, Tagaya M, Oyama T, Tanaka M. Suppression of bladder oxidative stress and inflammation by a phytotherapeutic agent in a rat model of partial bladder outlet obstruction. J Urol. 2009;182:382–90. doi: 10.1016/j.juro.2009.02.104. [DOI] [PubMed] [Google Scholar]
- Polyak E, Boopathi E, Mohanan S, Deng M, Zderic SA, Wein AJ, et al. Alterations in caveolin expression and ultrastructure after bladder smooth muscle hypertrophy. J Urol. 2009;182:2497–503. doi: 10.1016/j.juro.2009.07.011. [DOI] [PubMed] [Google Scholar]
- Qiao Z, Xia C, Shen S, Corwin FD, Liu M, Guan R, et al. Suppression of the PI3K pathway in vivo reduces cystitis-induced bladder hypertrophy and restores bladder capacity examined by magnetic resonance imaging. PLoS One. 2014;9:e114536. doi: 10.1371/journal.pone.0114536. [DOI] [PMC free article] [PubMed] [Google Scholar]
- Roosen A, Chapple CR, Dmochowski RR, Fowler CJ, Gratzke C, Roehrborn CG, et al. A Refocus on the Bladder as the Originator of Storage Lower Urinary Tract Symptoms: A Systematic Review of the Latest Literature. Eur Urol. 2009;56:810–9. doi: 10.1016/j.eururo.2009.07.044. [DOI] [PubMed] [Google Scholar]
- Schroder A, Kirwan TP, Jiang JX, Aitken KJ, Bagli DJ. Rapamycin Attenuates Bladder Hypertrophy During Long-Term Outlet Obstruction In Vivo: Tissue, Matrix and Mechanistic Insights. J Urology. 2013;189:2377–84. doi: 10.1016/j.juro.2012.12.110. [DOI] [PubMed] [Google Scholar]
- Shen S, Al-Thumairy HW, Hashmi F, Qiao LY. Regulation of transient receptor potential cation channel subfamily V1 protein synthesis by the phosphoinositide 3-kinase/Akt pathway in colonic hypersensitivity. Exp Neurol. 2017;295:104–15. doi: 10.1016/j.expneurol.2017.06.007. [DOI] [PMC free article] [PubMed] [Google Scholar]
- Shen SW, Xia CM, Qiao LY. The urinary bladder of spontaneously hypertensive rat demonstrates bladder hypertrophy, inflammation, and fibrosis but not hyperplasia. Life Sci. 2015;121:22–7. doi: 10.1016/j.lfs.2014.10.016. [DOI] [PMC free article] [PubMed] [Google Scholar]
- Shiina K, Hayashida KI, Ishikawa K, Kawatani M. ATP release from bladder urothelium and serosa in a rat model of partial bladder outlet obstruction. Biomed Res. 2016;37:299–304. doi: 10.2220/biomedres.37.299. [DOI] [PubMed] [Google Scholar]
- Staal SP, Hartley JW, Rowe WP. Isolation of transforming murine leukemi viruses from mice with a high incidence of spontaneous lymphoma. Proc Natl Acad Sci U S A. 1977;74:3065–7. doi: 10.1073/pnas.74.7.3065. [DOI] [PMC free article] [PubMed] [Google Scholar]
- Steers WD, Tuttle JB. Mechanisms of Disease: the role of nerve growth factor in the pathophysiology of bladder disorders. Nat Clin Pract Urol. 2006;3:101–10. doi: 10.1038/ncpuro0408. [DOI] [PubMed] [Google Scholar]
- Stephenson LA, Haney LB, Hussaini IM, Karns LR, Glass WF. Regulation of smooth muscle alpha-actin expression and hypertrophy in cultured mesangial cells. Kidney Int. 1998;54:1175–87. doi: 10.1046/j.1523-1755.1998.00101.x. [DOI] [PubMed] [Google Scholar]
- Tubaro A, De Nunzio C, Trucchi A, Palleschi G, Miano L. The effect of bladder outlet obstruction treatment on ultrasound-determined bladder wall thickness. Rev Urol. 2005;7(Suppl 6):S35–42. [PMC free article] [PubMed] [Google Scholar]
- Tubaro A, Mariani S, De Nunzio C, Miano R. Bladder weight and detrusor thickness as parameters of progression of benign prostatic hyperplasia. Curr Opin Urol. 2010;20:37–42. doi: 10.1097/MOU.0b013e32833307e0. [DOI] [PubMed] [Google Scholar]
- Wong-You-Cheong JJ, Woodward PJ, Manning MA, Davis CJ. From the archives of the AFIP: Inflammatory and nonneoplastic bladder masses: radiologic-pathologic correlation. Radiographics. 2006;26:1847–68. doi: 10.1148/rg.266065126. [DOI] [PubMed] [Google Scholar]
- Xu Q, Fitzsimmons B, Steinauer J, O'Neill A, Newton AC, Hua XY, et al. Spinal phosphinositide 3-kinase-Akt-mammalian target of rapamycin signaling cascades in inflammation-induced hyperalgesia. J Neurosci. 2011;31:2113–24. doi: 10.1523/JNEUROSCI.2139-10.2011. [DOI] [PMC free article] [PubMed] [Google Scholar]
- Yang L, Liu RM, Wang XY, He DL. Imbalance between matrix metalloproteinase-1 (MMP-1) and tissue inhibitor of metalloproteinase-1 (TIMP-1) contributes to bladder compliance changes in rabbits with partial bladder outlet obstruction (PBOO) Bju Int. 2013;112:E391–E7. doi: 10.1111/j.1464-410X.2012.11740.x. [DOI] [PubMed] [Google Scholar]
- You JS, Anderson GB, Dooley MS, Hornberger TA. The role of mTOR signaling in the regulation of protein synthesis and muscle mass during immobilization in mice. Dis Model Mech. 2015;8:1059–69. doi: 10.1242/dmm.019414. [DOI] [PMC free article] [PubMed] [Google Scholar]
- Zhang QL, Qiao LY. Regulation of IGF-1 but not TGF-beta1 by NGF in the smooth muscle of the inflamed urinary bladder. Regul Pept. 2012;177:73–8. doi: 10.1016/j.regpep.2012.05.088. [DOI] [PMC free article] [PubMed] [Google Scholar]
- Zhang XH, Jin BQ, Huang CS. The PI3K/Akt pathway and its downstream transcriptional factors as targets for chemoprevention. Curr Cancer Drug Tar. 2007;7:305–16. doi: 10.2174/156800907780809741. [DOI] [PubMed] [Google Scholar]


