Abstract
To enhance our understanding of molecular mechanisms and mine novel biomarkers of non-alcoholic fatty liver disease (NAFLD), RNA sequencing was performed to gain hepatic expression profiles of mRNAs and miRNAs in NAFLD and normal rats. Using DESeq with thresholds of a two-fold change and a false discovery rate (FDR) less than 0.05, 336 mRNAs and 21 miRNAs were identified as differentially expressed. Among those, 17 miRNAs (e.g., miR-144-3p, miR-99a-3p, miR-200b-3p, miR-200b-5p, miR-200c-3p, etc.) might serve as novel biomarkers of NAFLD. MiRNA target genes (13565) were predicted by the miRWalk database. Using DAVID 6.8, the intersection (195 genes) of differentially expressed mRNAs and miRNA-predicted target genes were enriched in 47 gene ontology (GO) terms and 28 Kyoto Encyclopedia of Genes and Genomes (KEGG) pathways. Using Cytoscape, pathway interaction and protein-protein interaction (PPI) networks were constructed, and hub genes (e.g., Abcg8, Cyp1a1, Cyp51, Hmgcr, etc.) associated with NAFLD were obtained. Moreover, 673 miRNA-mRNA negative regulatory pairs were obtained, and networks were constructed. Finally, several representative miRNAs and mRNAs were validated by real-time qPCR. In conclusion, potential molecular mechanisms of NAFLD could be inferred from integrated analysis of mRNA and miRNA profiles, which may indicate novel biomarkers of NAFLD.
Introduction
Nonalcoholic fatty liver disease (NAFLD) is the most common hepatic disease worldwide and is defined as evidence of hepatic steatosis, either by imaging or histology, with no cause for secondary hepatic fat accumulation such as significant alcohol consumption, use of steatogenic medication, or hereditary disorder1. The prevalence of NAFLD is 20–30% in Western countries, creating considerable concern with its progression from steatosis to steatohepatitis, cirrhosis, and even hepatocellular carcinoma2. Regarding the pathogenesis, the “multiple hits” hypothesis considers multiple insults in genetically predisposed subjects to induce NAFLD and provides a more accurate explanation of NAFLD pathogenesis than do other hypotheses. Such hits include insulin resistance, hormones secreted from adipose tissue, nutritional factors, gut microbiota and genetic and epigenetic factors, among others3. However, the molecular mechanisms in the pathogenesis of NAFLD are complex and still require further clarification.
Over the past decades, mRNA expression profiling has been used as a powerful tool to uncover molecular mechanisms and explore diagnostic and predictive biomarkers, particularly in complicated diseases such as cancer4, diabetes5, cardiovascular disease6 and NAFLD. One study reported that the expression of certain metabolism-related genes was induced and specific metabolic and repair pathways were activated in NAFLD7. Others reported that uptake transporter genes were coordinately targeted for down-regulation at the global level during the pathological development of NAFLD8. A recent study used high-throughput RNA sequencing to explore mRNA expression profiling by Western-diet-induced NAFLD and found that numerous lipid metabolism and cholesterol biosynthesis genes were altered9. Although numerous genes have been identified in NAFLD, the establishment of gene regulatory networks is limited.
MiRNAs are endogenous, single-stranded RNAs and have been widely known to regulate gene expression primarily through post-transcriptional mechanisms10. MiRNAs have multiple targets and regulate the expression of hundreds of genes that have important cellular functions such as cell differentiation, development, and proliferation and disease progression11. Alterations in miRNA expression profiles have been described in the pathophysiology of complex diseases12–14, and specific miRNA expression profiles have been shown to be associated with NAFLD. Several miRNAs, such as miR-122, miR-451, miR-200b and miR-27, have been found to be deregulated in different diet-induced NAFLD rat models15. Researchers have observed altered expression of miR-33a/miR-33b* and miR-122 in liver samples, which have been designated possible contributors to hepatic lipid metabolism in patients with NAFLD16. However, studies on the identification of NAFLD-relevant miRNAs by high-throughput RNA sequencing are rare. By contrast, integrated analysis of mRNAs and miRNAs expression profiles in exploring miRNA-mRNA regulatory networks provides a powerful tool and facilitates clarification of the molecular mechanisms and identification of novel biomarkers of NAFLD.
In our previous study, we constructed NAFLD and normal rat models and observed different phenotypic characteristics17. To enhance our understanding of the mechanisms associated with the pathogenesis of NAFLD and mine potential biomarkers, here, we detected expression profiles of mRNAs and miRNAs in liver tissues and constructed pathway interaction, PPI and miRNA-mRNA regulatory networks through integrated analysis of the crucial mRNAs and miRNAs obtained. Our present study may pave a new way for understanding molecular mechanisms of NAFLD and uncover novel biomarkers.
Results
Quality control of RNA sequence experiment
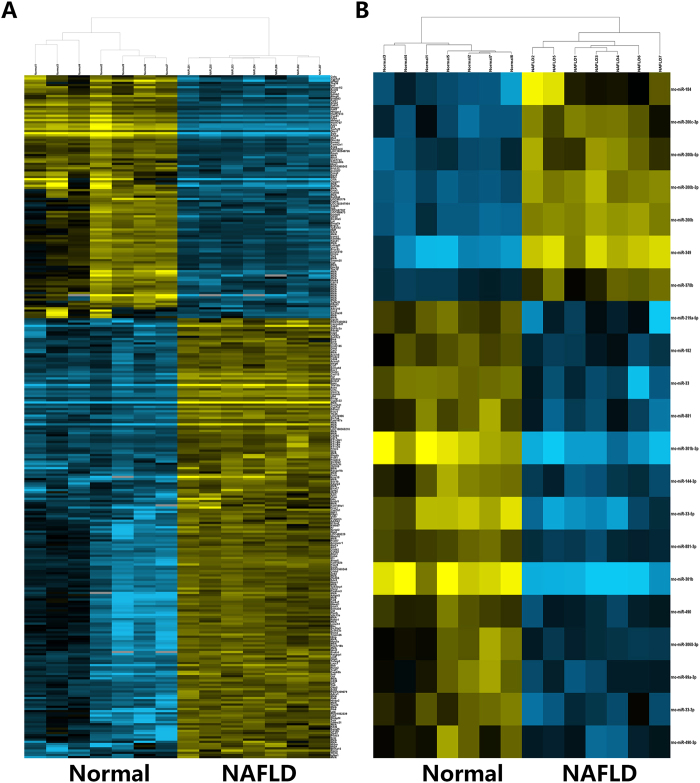
RNA samples with optimal RIN (RNA Integrity Number) values (≥8) were considered to construct libraries for sequencing. Library quality was also assessed (supplementary Table S1). The libraries with sufficient concentration and a peak length within the ranges 350–500 bp and 138–150 bp were sequenced on an Illumina HiSeq platform to generate mRNA and miRNA sequences, respectively. In the present study, the mRNA sequencing generated an average of 48348613 raw reads for each sample. After quality filtering (removing adapter and low-quality reads), an average of 48309324 (99.9%) high-quality, clean reads were obtained for each sample. A large portion of clean reads (92.5%) were mapped to the rat genome. Among those reads, we observed 21174764 spliced reads and 20772406 non-spliced reads. Moreover, the miRNA sequencing yielded an average of 10088010 raw reads for each sample, and 8629406 (85.5%) clean reads were filtered out. A large number of clean reads (97.9%) were mapped to the genome. The high percentage of mapped reads is consistent with what would be expected for high-quality datasets18. The quality characteristics of sequence reads for each sample are listed in supplementary Table S2. Additionally, the RNA expression levels were determined by reads per kilobase per million mapped reads and are provided in supplementary Table S3. Hierarchical clustering of representative mRNA and miRNA expressions revealed samples in the same group clustered closely, which indicated high reproducibility in biological replicates (Fig. 1).
Figure 1.
Hierarchical cluster of representative mRNA and miRNA expression across biological replicate samples. (A) Heatmap of representative mRNAs. (B) Heatmap of representative miRNAs. RNA expression level is represented by colors, with bright blue indicating high values and bright yellow indicating low values.
Differentially expressed mRNAs and miRNAs
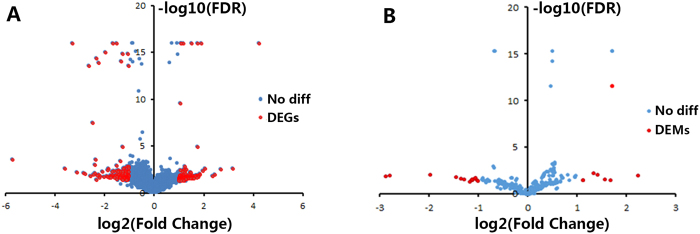
Using cutoffs of a two-fold change and an FDR less than 0.05, we identified 336 differentially expressed mRNAs (DEGs); 105 were down-regulated, and 201 were up-regulated in NAFLD rats. Among these DEGs, Abcg8, Cyp1a1, Cyp51, Hmgcr, etc. were decreased, whereas Apln, Cd36, Cyp7b1, Vcan, etc. were increased. We also identified 21differentially expressed miRNAs (DEMs). Compared with the miRNAs in the normal group, 14 were down-regulated and 7 were up-regulated in the NAFLD group. Among these DEMs, miR-33, miR-33-5p, miR-33-3p, miR-144-3p and miR-99a-3p were down-regulated in NAFLD, whereas miR-200b, miR-200b-3p, miR-200b-5p, miR-200c-3p and miR-349 were up-regulated. Volcano plots (Fig. 2) present DEGs or DEMs as red blots and other detected mRNAs and miRNAs as blue blots. Detailed information pertaining to the top 20 DEGs and total 21 DEMs is listed in Tables 1 and 2, respectively. Supplementary Table S4 lists 336 DEGs.
Figure 2.
Volcano plots of mRNAs and miRNAs. The plots were constructed by plotting −log10 (FDR) on the y-axis and log2 (fold change) on the x-axis. DEGs, differentially expressed mRNAs; DEMs, differentially expressed miRNAs. (A) Volcano plots of mRNAs; red blots represent differentially expressed mRNAs, and blue blots represent mRNAs with no significant difference. (B) Volcano plots of miRNAs; red blots represent differentially expressed miRNAs, and blue blots represent miRNAs with no significant difference.
Table 1.
The top 20 differentially expressed genes.
| Gene_Symbol | FDR | Fold_Change |
|---|---|---|
| Tex13b | 0.003 | 8.984 |
| Cpb1 | 0.012 | 5.479 |
| Kcnj15 | 0.016 | 5.124 |
| Sbspon | 0.003 | 4.145 |
| Cxcl13 | 0.004 | 3.898 |
| Ubd | 0.000 | 3.744 |
| Asns | 0.012 | 3.580 |
| Clec7a | 0.011 | 3.559 |
| Hdc | 0.014 | 3.482 |
| Neb | 0.022 | 3.464 |
| Nfe2 | 0.008 | 0.189 |
| Tlcd2 | 0.011 | 0.185 |
| Pcsk9 | 0.000 | 0.179 |
| Tm7sf2 | 0.000 | 0.160 |
| Sdr16c6 | 0.010 | 0.145 |
| Rnf186 | 0.008 | 0.139 |
| Igfn1 | 0.006 | 0.114 |
| Sqle | 0.000 | 0.102 |
| Cish | 0.003 | 0.082 |
| Pnpla5 | 0.000 | 0.019 |
Table 2.
The identified differentially expressed miRNAs.
| miRBase | FDR | Fold_Change |
|---|---|---|
| rno-miR-301b-3p | 0.013 | 0.136 |
| rno-miR-301b | 0.010 | 0.143 |
| rno-miR-33-5p | 0.008 | 0.255 |
| rno-miR-33 | 0.016 | 0.367 |
| rno-miR-144-3p | 0.022 | 0.391 |
| rno-miR-881 | 0.027 | 0.411 |
| rno-miR-881-3p | 0.046 | 0.446 |
| rno-miR-219a-5p | 0.031 | 0.453 |
| rno-miR-3068-3p | 0.031 | 0.459 |
| rno-miR-99a-3p | 0.026 | 0.460 |
| rno-miR-33-3p | 0.030 | 0.461 |
| rno-miR-182 | 0.022 | 0.481 |
| rno-miR-490 | 0.031 | 0.492 |
| rno-miR-490-3p | 0.043 | 0.498 |
| rno-miR-378b | 0.034 | 2.181 |
| rno-miR-200c-3p | 0.006 | 2.523 |
| rno-miR-200b-5p | 0.008 | 2.666 |
| rno-miR-184 | 0.026 | 2.976 |
| rno-miR-200b-3p | 0.000 | 3.270 |
| rno-miR-200b | 0.000 | 3.296 |
| rno-miR-349 | 0.011 | 4.750 |
Annotation, target gene identification and functional enrichment
A literature search revealed that altered expression of miR-33-5p, miR-33, miR-182 and miR-200b has been reported in NAFLD, whereas the remaining 17 DEMs (e.g., miR-144-3p, miR-99a-3p, miR-200b-3p, miR-200b-5p, miR-200c-3p, miR-33-3p, miR-349, miR-184, etc.) have not been reported in NAFLD. Target genes of the 21 DEMs were predicted by the online tool of the miRWalk database. We obtained 13760 target genes for the 21 DEMs. A Venn diagram (Fig. 3A) showed that 195 overlapped genes were obtained between 13760 target genes and 336 DEGs, which were selected for further analysis. Detailed information pertaining to the 195 overlapped genes is provided in supplementary Table S5.
Figure 3.
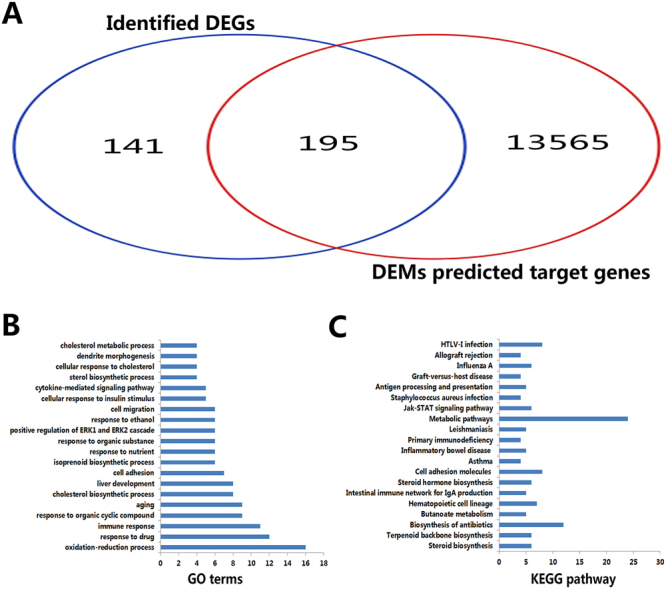
GO and KEGG pathway analysis of the 195 overlapped genes. (A) Venn diagram of DEM predicted target genes (13760) and identified DEGs (336) obtained from 195 overlapped genes. (B) The top 20 enriched GO terms; the x-axis represents gene counts, and the y-axis represents GO terms. (C) The top 20 enriched KEGG pathways; the x-axis represents gene counts, and the y-axis represents KEGG pathway names.
To further establish the main biological function and key pathways of the 195 overlapped genes, functional enrichment was performed by DAVID. GO analysis revealed that the overlapped genes were enriched in 47 terms such as cholesterol biosynthetic process, immune response and oxidation-reduction process (Fig. 3B). KEGG pathway enrichment showed that 20 pathways were enriched such as steroid biosynthesis, NF-κB signaling pathway and adipocytokine signaling pathway (Fig. 3C).
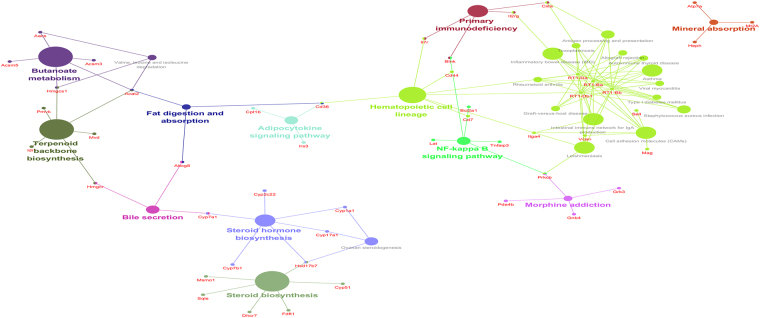
Furthermore, pathway interaction networks were constructed and are presented in Fig. 4. Pathways might interact with each other through a specific gene or hub gene. For instance, steroid hormone biosynthesis and bile secretion might interact with each other via gene Cyp7a1, while bile secretion might interact with fat digestion and absorption through gene Abcg8. RT1-Da, RT1-Ba, RT1-Bb and RT1-Db1 were hub genes of several different pathways that might interact with each other. Detailed information pertaining to genes enriched in different GO terms and KEGG pathways is provided in supplementary Table S6.
Figure 4.
Enriched KEGG pathway interaction networks. Each node is a KEGG pathway item. The node size reflects pathway significance (FDR): the smaller the FDR is, the larger the node size is. Edge between nodes reflects common genes: the wider the edge is, the larger the overlap is. Different node colors represent different functional groups. The most significant pathway of each group features a highlighted label.
PPI (Protein-protein interaction) network analysis
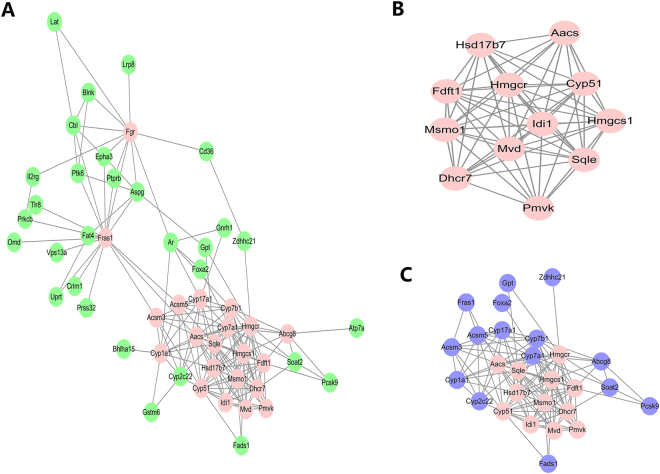
To explore interactions among the 195 overlapped genes, PPI was applied, and the most important modules were then screened. A PPI network with 51 nodes was obtained, and the average number of neighbors was 6.9. The hub nodes with the greatest number of neighbors (≥8), such as Abcg8, Cyp1a1, and Cyp7a1, were identified (Fig. 5A). By Molecular Complex Detection (MCODE), one significant module with the highest score (11.5) was obtained, including 12 nodes such as Cyp7b1, Cyp51, and Hmgcr (Fig. 5B). A sub-network with the first neighbors was constructed (Fig. 5C).
Figure 5.
PPI networks. (A) PPI network with 51 nodes. Pink nodes represent the hub nodes with a large number of neighbors (≥8). (B) A significant module with 12 nodes identified by MCODE. (C) Sub-network of the most significant module with 12 nodes and their first neighbors. Blue nodes represent the first neighbors.
Regulatory networks of differentially expressed miRNAs and mRNAs
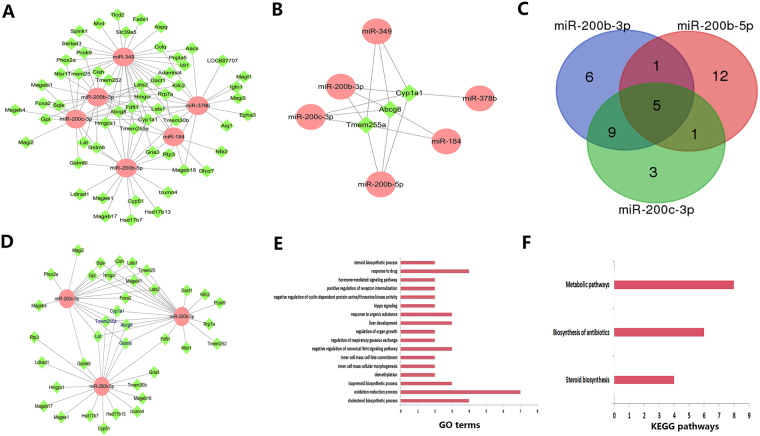
It is well known that miRNAs play pivotal roles in regulating mRNA expression. To explore miRNA and mRNA regulatory networks in NAFLD, the expression profiles of miRNA and mRNA were combined for further analysis. Integrated analysis of 21 DEMs and 195 DEGs identified 673 negative interaction pairs. The regulatory networks were constructed and visualized by Cytoscape; 114 pairs were up-regulated miRNAs vs. down-regulated mRNAs (Fig. 6A), e.g., up-regulated miR-184 interacted with 9 down-regulated genes (Abcg8, Dhcr7, Hmgcr, Tmem255a, etc.). Notably, a single miRNA might interact with different genes, while the same gene might be a target of different miRNAs. We observed that the intersection genes Abcg8, Cyp1a1 and Tmem255a were the targets of miR-349, miR-378b, miR-200b-3p, miR-200c-3p, miR-200b-5p and miR-184 (Fig. 6B). Additionally, we observed that miR-200b-3p, miR-200b-5p and miR-200c-3p all interacted with Abcg8, Cyp1a1, Tmem255a, Gstm6 and Lat (Fig. 6C,D). GO and KEGG pathway analyses revealed that the target genes of the three miRNAs were enriched in cholesterol biosynthetic process, metabolic pathways, etc. (Fig. 6E,F).
Figure 6.
Up-regulated miRNA vs. down-regulated mRNA pairs. (A) 114 up-regulated miRNA vs. down-regulated mRNA pair regulatory networks with 6 miRNAs and their targets. Ellipse nodes represent miRNAs, and diamond nodes represent mRNAs; up-regulated and down-regulated miRNAs are shown in red and green, respectively. (B) A sub-network of Abcg8, Cyp1a1 and Tmem255a, each connected to 5 different miRNAs. (C) Venn diagram of miR-200b-3p, miR-200b-5p and miR-200c-3p. (D) A sub-network of miR-200b-3p, miR-200b-5p and miR-200c-3p and their target genes. The blue label represents the intersection target genes of the three miRNAs. (E) GO analysis of miR-200b-3p, miR-200b-5p and miR-200c-3p target genes; the x-axis represents gene counts, and the y-axis represents GO terms. (F) KEGG pathway analysis of miR-200b-3p, miR-200b-5p and miR-200c-3p target genes; the x-axis represents gene counts, and the y-axis represents KEGG pathway names.
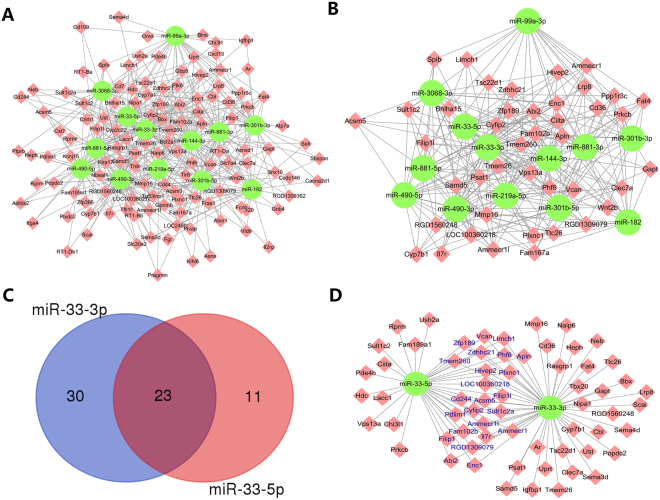
In addition, 459 pairs were down-regulated miRNAs vs. up-regulated mRNAs (Fig. 7A), e.g., down-regulated miR-33-5p interacted with 34 up-regulated genes (Abi2, Ciita, Sult1c2, Vcan, etc.). In this network, we identified a batch of genes such as Apln, Cd36, and Cyp7b1 that were connected to more than 5 miRNAs (Fig. 7B). In addition, we observed that miR-33-3p interacted with 53 mRNAs, while miR-33-5p targeted 32 genes. Furthermore, miR-33-3p and miR-33-5p targeted 23 common genes such as Abi2, Apln, and Vcan (Figs 7C,D). The miRNAs-mRNAs pairs are listed in supplementary Table S7.
Figure 7.
Down-regulated miRNA vs. up-regulated mRNAs pairs. (A) 459 miRNA-mRNA pair regulatory networks including 13 miRNAs and their targets. (B) A sub-network of 41 genes connected to more than 5 different miRNAs. (C) Venn diagram of miR-33-3p and miR-33-5p. (D) A sub-network of miR-33-3p and miR-33-5p and their target genes. The blue label represents the intersection target genes of the two miRNAs.
Validation by real-time PCR
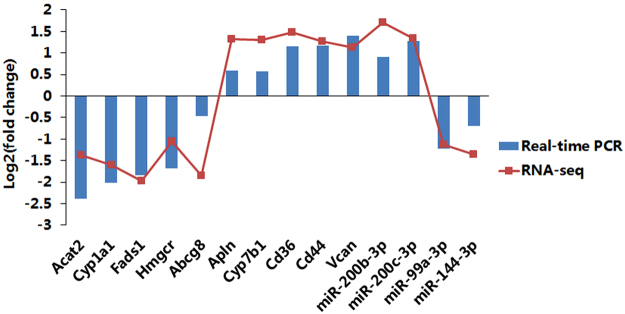
To validate our findings based on RNA sequence data, we selected 10 mRNAs and 4 miRNAs (half were up-regulated, and half were down-regulated) to perform real-time PCR experiments. Log2 (fold change) values were transformed based on the ratios between NAFLD and normal group average expression values. As shown in Fig. 8, the RNA expression patterns in real-time PCR data were consistent with RNA sequence data, which might partially validate the reliability of our sequence data and our findings in the present study.
Figure 8.
Real-time PCR validation of several representative expressed mRNAs and miRNAs. The x-axis represents RNA names, and the y-axis represents log2 (fold change) based on the ratios between the NAFLD and normal groups’ average expression values. Blue bars represent data yielded by real-time qPCR, and red points represent data obtained by RNA sequencing.
Discussion
In the present study, we combined the analysis of mRNA and miRNA profiles and constructed PPI, pathway interaction and miRNA-mRNA regulatory networks to enhance our understanding of molecular mechanisms of NAFLD and mine potential biomarkers.
By integrated analysis, we observed 14 decreased miRNAs (such as miR-33, miR-33-5p, miR-33-3p, miR-144-3p, and miR-99a-3p) and constructed 459 miRNA and mRNA regulatory pairs in NAFLD rats. MiR-33 is a key regulator of lipid metabolism and transport that targets ATP-binding cassette A1 (ABCA1) and thus suppresses HDL synthesis by attenuation of cholesterol efflux to apolipoprotein A1 and nascent HDL19. Studies have reported that genetic ablation and antagonism of miR-33 attenuates the progression of atherosclerosis in mice20,21. However, there are conflicting reports regarding NAFLD. A study reported that persistent inhibition of miR-33 in high-fat-diet-fed mice might cause deleterious effects such as moderate hepatic steatosis and hypertriglyceridemia22. Researchers observed that high-fat-diet feeding reduced miR-33 expression along with an increase in body weight, fasting blood glucose, triglyceride, cholesterol, AST and ALT in NAFLD mice23. Altered expression of miR-33-5p was also reported in Western-diet-induced NAFLD rats and high-fructose-diet-induced chronic metabolic disorders mice24,25. However, little is known about miR-33-3p in NAFLD. Intriguingly, we observed that the expression levels of miR-33, miR-33-5p and miR-33-3p were significantly decreased in high-fat-diet-induced NAFLD. All data suggested that miR-33, its guide strand miR-33-5p and passenger strand miR-33-3p might play pivotal roles in NAFLD. Moreover, the miRNA-mRNA regulatory networks revealed that 23 genes interacted with both miR-33-5p and miR-33-3p. Among those genes, Apln and Vcan have been reported to be associated with NAFLD.One study reported that the serum concentration of apelin-36 (Apln gene encoded protein) was significantly higher in NAFLD patients than in controls26. Another study revealed that Vcan encoded versican might serve as a novel modulator of hepatic fibrosis. Hepatic expression of versican increased in cirrhotic livers and a mouse model of fibrosis, while transient knockdown of versican inhibited expression of fibrogenic genes27. In the present study, we observed that Apln and Vcan were up-regulated in NAFLD, consistent with the results reported by other researchers. Collectively, there is strong evidence indicating the potential roles of miR-33-3p and its target genes in NAFLD.
Researchers reported that the serum level of miR-99a was significantly decreased in NAFLD patients compared with that in healthy controls28. Decreased miR-144 could enhance TNF-α and IFN-γ production, which might contribute to the progression of NAFLD in rats29. In addition, miR-144 might contribute to the pathogenesis of NASH in morbidly obese subjects30. In the present study, although we did not observe altered expression of miR-99a or miR-144, we found that miR-99a-3p and miR-144-3p were significantly down-regulated in NAFLD rats and constructed a series of miRNAs- mRNAs regulatory pairs. We also observed that NAFLD-related genes Apln, Vcan, Cd36 and Cyp7a1 were targets of miR-99a-3p and miR-144-3p26,27,31,32. Further investigation of the identified DEMs and their target genes may help explain the molecular mechanisms and identify novel biomarkers of NAFLD.
In addition to the down-regulated miRNAs, we obtained 7 up-regulated miRNAs (miR-200b, miR-200b-3p, miR-200b-5p, miR-200c-3p, miR-378b, miR-184, and miR-349) and 114 correlated miRNA and mRNA regulatory pairs. MiR-200b belongs to the miR-200 family, which is organized into two groups based on a single nucleotide difference in their seed sequence (group A: miR-141 and -200a; group B: miR-200b, -200c and −429)33. Researchers observed that expression of miR-200b and miR-200c increased in high-fat-diet-induced NAFLD rat livers and free-fatty-acid-treated HepG2 cells and human hepatocytes34. Another study reported that up-regulation of miR-200b in the livers of mice fed a choline- and folate-deficient diet was strongly correlated with the severity of NAFLD35. However, there are no reports about the correlation of miR-200b-3p, miR-200b-5p and miR-200c-3p with NAFLD. In the present study, we observed up-regulation of miR-200b in NAFLD rats, consistent with previous studies. Interestingly, we also observed that the expression levels of miR-200b-3p, miR-200b-5p and miR-200c-3p were remarkably increased in NAFLD rat livers. GO and KEGG pathway analysis revealed that their target genes were enriched in cholesterol biosynthetic process, metabolic pathways, etc., implying the crucial roles of the three miRNAs in NAFLD. Additionally, miRNA-mRNA regulatory network analysis indicated that five down-regulated genes (Abcg8, Cyp1a1, Tmem255a, Gstm6 and Lat) in NAFLD rats were common targets of miR-200b-3p, miR-200b-5p and miR-200c-3p. Notably, the absence of ABCG5/ABCG8 (ATP binding cassetteG5/G8) reduces biliary cholesterol secretion and results in hepatic cholesterol accumulation, acceleration of obesity, and exacerbation of NAFLD in mice36. It was also reported that CYP1A1 (cytochrome P450 1 A 1) protein expression was decreased in methionine-choline- deficient-diet-induced NAFLD mice and that 3,3′-diindolylmethane significantly up-regulated the protein expression of CYP1A1, which could be used as a potential therapeutic candidate for NAFLD37. The data presented in other studies are consistent with our findings, suggesting that miR-200b-3p, miR-200b-5p, miR-200c-3p and their target genes might be crucial regulators in the pathogenesis of NAFLD. Further investigation of the three miRNAs and their target genes may yield promising therapeutic targets of NAFLD. Additionally, miR-349 was reported to be up-regulated in hepatitis C virus-induced liver fibrosis38. Interestingly, we observed that miR-349 was increased in NAFLD rats, which interacted with 29 target genes, e.g., Abcg8, Cyp1a1, Fads1, Lats2, etc. In addition to Abcg8 and Cyp1a, Fads1 has also been reported to be correlated with NAFLD39. Therefore, miR-349 may serve as a new biomarker of NAFLD, which is worthy of in-depth investigation.
Furthermore, the functional enrichment of the miRNA target genes revealed that numerous genes were enriched in NAFLD-related processes and pathways such as cholesterol biosynthetic process, immune response, steroid biosynthesis, NF-κB signaling pathway, fat digestion and absorption and bile secretion40–43. The constructed pathway interaction networks indicated that different pathways could interact with each other through specific genes or hub genes, such as Abcg8, Acat2, Cyp7a1, Cyp1a1, Cd36, Cd44, and RT1-Ba. PPI network and MCODE module analysis also identified a batch of hub genes, including Abcg8, Cyp1a1, Cyp7b1, Cyp51, and Hmgcr. In addition to the previously mentioned Abcg8, Cd36 and Cyp1a1, genes such as Cyp7b1, Cyp51 and Hmgcr have also been reported to be correlated with NAFLD. It was reported that mRNA and protein expression levels of CYP7B1 were increased in human NAFLD44. Down-regulation of Cyp51 was observed by transcriptome analysis45. The hepatic expression of Hmgcr was reduced in morbidly obese individuals with liver steatosis and fibrosis46. In-depth investigation of these specific genes or hub genes may provide insight into the molecular mechanisms of NAFLD and identified novel biomarkers.
Several weak points in our present study should be noted. First, our results are based on rat models; few findings have been replicated across human studies47. Discrepancies in the findings are likely due to differences in study design, phenotypic endpoint, genetic alterations, etc. In-depth investigation should be performed to generalize our findings to humans. Second, we performed a bioinformatics analysis based on high-throughput RNA sequencing data and conducted several RNA expression validations by real-time qPCR; thorough validation and further functional experiments should be performed in the future. Third, we focused on exploring the negative miRNA-mRNA regulatory pair, considering the down-regulation role for miRNA revealed by available studies. However, recent evidence suggests that some miRNAs could activate gene expression in specific cell types and conditions with distinct transcripts and proteins. Given this complexity, further exploration should be performed to uncover the puzzling and interesting aspects of gene regulation by miRNAs.
In conclusion, our present integrated analysis may open a new avenue toward understanding the molecular mechanisms associated with the pathogenesis of NAFLD and provide potential novel biomarkers or candidate targets of NAFLD. Thorough and comprehensive investigation of the identified DEMs and their target genes should be performed in the future, which may ascertain novel biomarkers of NAFLD.
Methods
Animals sample collection
As previously described17, five-week-old male Wistar rats (130 g ± 10 g) were obtained from Shanghai SLAC Laboratory Animal CO. LTD, China, and maintained in a temperature- and humidity-controlled room. Fourteen rats were randomly divided into two groups: a normal group (n = 7), fed with a chow diet; and an NAFLD group (n = 7), fed with a high-fat diet (88% chow diet, 10% lard and 2% cholesterol)
Animals were weighed and sacrificed after 4 weeks of feeding. Liver tissues were quickly removed and stored at −80 °C after being snap frozen in liquid nitrogen. All animal procedures were approved by the Animal Experiment Ethics Committee of Shanghai University of Traditional Chinese Medicine, and all methods were performed in accordance with the relevant guidelines and regulations.
RNA extraction and sequencing
To obtain mRNA and miRNA expression profiles, total RNA of the liver (100 mg) was extracted using TRIzol reagent (Invitrogen, USA). RNA quality was verified using an Agilent 2100 Bio-analyzer (Agilent Technologies, Santa Clara, CA). Libraries for mRNA and miRNA sequencing were respectively generated using the NEBNext Ultra RNA Library Prep Kit for Illumina (NEB,USA) and the NEBNext Multiplex Small RNA Library Prep Kit for Illumina (NEB,USA) according to the manufacturer’s instructions. Then, the final purified libraries were evaluated using a BioAnalyzer 2100 and quantified. Using the Illumina HiSeq platform, libraries for mRNA were sequenced, and 150 bp paired-end reads were generated; moreover, libraries for miRNA were sequenced, and 50 bp single-end reads were generated according to the manufacturer’s instructions. Seven biological replicate samples of each group were used, and a total of 28 libraries were sequenced.
RNA sequencing data processing
We performed quality control on raw sequence data using the FastQC tool. To obtain high-quality, clean data for analysis, adaptor sequence trimming and removal of low-quality reads were performed48. Clean reads were aligned with the rat genome using TopHat v2.1.1. Based on the ultra-high throughput short-read aligner Bowtie, TopHat aligned RNA-Seq reads to reference genomes and analyzed the mapping reads to determine possible splice junctions between exons. RNA expression levels were determined by reads per kilobase per million mapped reads. Hierarchical clustering of representative mRNAs and miRNAs expressions was performed to reveal reproducibility in biological replicates.
The DESeq package was used to detect DEGs and DEMs between the normal and NAFLD groups, with thresholds of a two-fold change (the ratio between seven NAFLD rats’ and seven normal rats’ averaged signal values) and an FDR less than 0.05. The DEGs and DEMs were visualized on a volcano plot, which was constructed by plotting − log10 (FDR) on the y-axis and log2 (fold change) on the x-axis.
Target genes prediction, functional enrichment
The target genes of DEMs were predicted by the online tool of miRWalk (http://zmf.umm.uni-heidelberg.de/apps/zmf/mirwalk2/index.html). The intersection of DEMs predicted target genes, DEGs were identified by a Venn diagram and the overlapped genes were used for further analysis.
Using DAVID 6.8 (https://david.ncifcrf.gov/), based on the default rat whole genome background, GO analysis was performed to help elucidate the concrete biological functions of specific genes, and KEGG pathways enrichment was employed to identify the critical signal pathways of the differential expressed genes. Any GO terms and KEGG pathways with p values less than 0.05 were considered significantly enriched.
PPI, pathway interaction, miRNA-mRNA regulatory network construction
The overlapped genes were mapped to the STRING database (https://string-db.org/) to screen PPI, and networks were visualized by Cytoscape. Important hub proteins were screened by counting the degree of connectivity of each node in the network. In the network, nodes represented proteins and lines represented the interactions. The most significant modules were identified with the plug-in MCODE of Cytoscape with a cutoff MCODE score of >5. The enriched pathway interaction networks were constructed using the Cytoscape plug-ins ClueGO and CluePedia. Negatively correlated, differentially expressed miRNA-mRNA pairs were selected for screening, and the regulatory networks were constructed and visualized by Cytoscape software. Sub-networks were also constructed with mRNAs connected to a large number of different miRNAs (≥5).
Real-time quantitative PCR assay
Total RNA was extracted from liver tissues using TRIzol (Invitrogen, China) according to the manufacturer’s protocol. For miRNA detection, total RNA was polyadenylated and then submitted to reverse transcription with primers and reverse transcriptase (Promega, USA) according to the manufacturer’s instructions. For mRNA detection, RNA was reverse transcribed into cDNA and then subjected to a real-time quantitative PCR (qPCR) assay. The qPCR assay was performed in triplicate with the SYBE Green PCR Kit on an ABI StepOnePlus Real-time PCR system (Applied Biosystems, USA). Cycle threshold (CT) values were calculated using the automated settings of the system. U6 and GAPDH were used as the internal controls for miRNAs and mRNAs, respectively. The primer sequences are listed in Tables 3 and 4.
Table 3.
Primer information for PCR verification in miRNAs.
| miRNAs | Primers sequence (5′-3′) |
|---|---|
| U6 Forward | ctcgcttcggcagcaca |
| U6 Reverse | aacgcttcacgaatttgcgt |
| miR-144-3p | ggttttttttggggtacagtatagatga |
| miR-99a-3p | tgggtttcaagctcgtttctatg |
| miR-200c-3p | gtgggtaatactgccgggta |
| miR-200b-3p | ttggtttttgtaatactgcctggtaat |
Table 4.
Primer information for PCR verification in mRNAs.
| mRNAs | Primers |
|---|---|
| Cyp7b1 | Forward tcagatgcaaagacggtcag |
| Reverse cgcaggacttccatagcttc | |
| Cd36 | Forward ccagaacccagacaaccact |
| Reverse cacaggctttccttctttgc | |
| Apln | Forward gtgaagcccagaacttcgag |
| Reverse atgggtcccttatgggagag | |
| Cd44 | Forward gtgtgggcagaagaagaagc |
| Reverse tgttggttccttgttcacca | |
| Vcan | Forward caccacctctgagtgggttt |
| Reverse tgtgtgggctgcatttgtat | |
| Hmgcr | Forward agaatatagcgcgtgggatg |
| Reverse gacatacagccaaagcagca | |
| Acat2 | Forward caaagtggctccagaagagg |
| Reverse acccatggctatggactgag | |
| Cyp1a1 | Forward ggagctgggtttgacacaat |
| Reverse gatagggcagctgaggtctg | |
| Abcg8 | Forward ctacgtggacttgacgagca |
| Reverse ggtgtcctgtgtgagggtct | |
| Fads1 | Forward aagcacatgccatacaacca |
| Reverse cagcggcatgtaagtgaaga | |
| GAPDH | Forward tgccactcagaagactgtgg |
| Reverse ttcagctctgggatgacctt |
Statistical analysis
Data were expressed as means ± SD and were analyzed by one-way analysis of variance (ANOVA) using SPSS v18.0 software. P values less than 0.05 were considered significantly different.
Data availability statement
All data generated during this study are included in this published article (and its Supplementary Information files).
Electronic supplementary material
Acknowledgements
This work was supported by the National Natural Science Foundation of China (No. 81620108030) and the Breeding Plan of Longhua Hospital (No. LYTD32). The funders played no role in study design, data collection or analysis, decision to publish, or preparation of the manuscript.
Author Contributions
G.J. and L.Z. conceived, designed and supervised the study. M.Z., Q.W., W.Z., L.Y., T.L. and P.Z. collected samples and performed the experiments. M.Z., W.Z. and Q.W. analyzed the data. M.Z., L.Z. and G.J. wrote the paper. All authors reviewed and approved the final manuscript.
Competing Interests
The authors declare no competing interests.
Footnotes
Mingzhe Zhu, Qianlei Wang and Wenjun Zhou contributed equally to this work.
Electronic supplementary material
Supplementary information accompanies this paper at 10.1038/s41598-018-25743-8.
Publisher's note: Springer Nature remains neutral with regard to jurisdictional claims in published maps and institutional affiliations.
Contributor Information
Li Zhang, Email: zhangli.hl@163.com.
Guang Ji, Email: jiliver@vip.sina.com.
References
- 1.Chalasani N, et al. The diagnosis and management of non-alcoholic fatty liver disease: practice Guideline by the American Association for the Study of Liver Diseases, American College of Gastroenterology, and the American Gastroenterological Association. Hepatology. 2012;55:2005–2023. doi: 10.1002/hep.25762. [DOI] [PubMed] [Google Scholar]
- 2.Mao Y, Yu F, Wang J, Guo C, Fan X. Autophagy: a new target for nonalcoholic fatty liver disease therapy. Hepat Med. 2016;8:27–37. doi: 10.2147/HMER.S98120. [DOI] [PMC free article] [PubMed] [Google Scholar]
- 3.Buzzetti E, Pinzani M, Tsochatzis EA. The multiple-hit pathogenesis of non-alcoholic fatty liver disease (NAFLD) Metabolism: clinical and experimental. 2016;65:1038–1048. doi: 10.1016/j.metabol.2015.12.012. [DOI] [PubMed] [Google Scholar]
- 4.Shi L, et al. Gene expression profiling and functional analysis reveals that p53 pathway-related gene expression is highly activated in cancer cells treated by cold atmospheric plasma-activated medium. PeerJ. 2017;5:e3751. doi: 10.7717/peerj.3751. [DOI] [PMC free article] [PubMed] [Google Scholar]
- 5.Corbi SCT, et al. Expression Profile of Genes Potentially Associated with Adequate Glycemic Control in Patients with Type 2 Diabetes Mellitus. J Diabetes Res. 2017;2017:2180819. doi: 10.1155/2017/2180819. [DOI] [PMC free article] [PubMed] [Google Scholar]
- 6.Derrett-Smith EC, et al. Limited cutaneous systemic sclerosis skin demonstrates distinct molecular subsets separated by a cardiovascular development gene expression signature. Arthritis Res Ther. 2017;19:156. doi: 10.1186/s13075-017-1360-7. [DOI] [PMC free article] [PubMed] [Google Scholar]
- 7.Moylan CA, et al. Hepatic gene expression profiles differentiate presymptomatic patients with mild versus severe nonalcoholic fatty liver disease. Hepatology. 2014;59:471–482. doi: 10.1002/hep.26661. [DOI] [PMC free article] [PubMed] [Google Scholar]
- 8.Lake AD, et al. Analysis of global and absorption, distribution, metabolism, and elimination gene expression in the progressive stages of human nonalcoholic fatty liver disease. Drug metabolism and disposition: the biological fate of chemicals. 2011;39:1954–1960. doi: 10.1124/dmd.111.040592. [DOI] [PMC free article] [PubMed] [Google Scholar]
- 9.Roberts MD, et al. Western diet-induced hepatic steatosis and alterations in the liver transcriptome in adult Brown-Norway rats. BMC gastroenterology. 2015;15:151. doi: 10.1186/s12876-015-0382-3. [DOI] [PMC free article] [PubMed] [Google Scholar]
- 10.Bartel DP. MicroRNAs: target recognition and regulatory functions. Cell. 2009;136:215–233. doi: 10.1016/j.cell.2009.01.002. [DOI] [PMC free article] [PubMed] [Google Scholar]
- 11.Felekkis K, Touvana E, Stefanou C, Deltas C. microRNAs: a newly described class of encoded molecules that play a role in health and disease. Hippokratia. 2010;14:236–240. [PMC free article] [PubMed] [Google Scholar]
- 12.Abu-Halima M, et al. Differential expression of microRNAs following cardiopulmonary bypass in children with congenital heart diseases. Journal of translational medicine. 2017;15:117. doi: 10.1186/s12967-017-1213-9. [DOI] [PMC free article] [PubMed] [Google Scholar]
- 13.Wallaert A, et al. Comprehensive miRNA expression profiling in human T-cell acute lymphoblastic leukemia by small RNA-sequencing. Scientific reports. 2017;7:7901. doi: 10.1038/s41598-017-08148-x. [DOI] [PMC free article] [PubMed] [Google Scholar]
- 14.Zhou B, et al. Integration of microRNA and mRNA expression profiles in the skin of systemic sclerosis patients. Scientific reports. 2017;7:42899. doi: 10.1038/srep42899. [DOI] [PMC free article] [PubMed] [Google Scholar]
- 15.Alisi A, et al. Mirnome analysis reveals novel molecular determinants in the pathogenesis of diet-induced nonalcoholic fatty liver disease. Laboratory investigation; a journal of technical methods and pathology. 2011;91:283–293. doi: 10.1038/labinvest.2010.166. [DOI] [PubMed] [Google Scholar]
- 16.Auguet, T. et al. miR33a/miR33b* and miR122 as Possible Contributors to Hepatic Lipid Metabolism in Obese Women with Nonalcoholic Fatty Liver Disease. Int J Mol Sci17, 10.3390/ijms17101620 (2016). [DOI] [PMC free article] [PubMed]
- 17.Liu T, et al. Chinese medicine formula lingguizhugan decoction improves Beta-oxidation and metabolism of Fatty Acid in high-fat-diet-induced rat model of Fatty liver disease. Evidence-based complementary and alternative medicine: eCAM. 2013;2013:429738. doi: 10.1155/2013/429738. [DOI] [PMC free article] [PubMed] [Google Scholar]
- 18.Mortazavi A, Williams BA, McCue K, Schaeffer L, Wold B. Mapping and quantifying mammalian transcriptomes by RNA-Seq. Nature methods. 2008;5:621–628. doi: 10.1038/nmeth.1226. [DOI] [PubMed] [Google Scholar]
- 19.Willeit P, Skroblin P, Kiechl S, Fernandez-Hernando C, Mayr M. Liver microRNAs: potential mediators and biomarkers for metabolic and cardiovascular disease? European heart journal. 2016;37:3260–3266. doi: 10.1093/eurheartj/ehw146. [DOI] [PMC free article] [PubMed] [Google Scholar]
- 20.Rayner KJ, et al. Antagonism of miR-33 in mice promotes reverse cholesterol transport and regression of atherosclerosis. The Journal of clinical investigation. 2011;121:2921–2931. doi: 10.1172/JCI57275. [DOI] [PMC free article] [PubMed] [Google Scholar]
- 21.Rotllan N, Ramirez CM, Aryal B, Esau CC, Fernandez-Hernando C. Therapeutic silencing of microRNA-33 inhibits the progression of atherosclerosis in Ldlr−/− mice–brief report. Arteriosclerosis, thrombosis, and vascular biology. 2013;33:1973–1977. doi: 10.1161/ATVBAHA.113.301732. [DOI] [PMC free article] [PubMed] [Google Scholar]
- 22.Goedeke L, et al. Long-term therapeutic silencing of miR-33 increases circulating triglyceride levels and hepatic lipid accumulation in mice. EMBO molecular medicine. 2014;6:1133–1141. doi: 10.15252/emmm.201404046. [DOI] [PMC free article] [PubMed] [Google Scholar]
- 23.Ghareghani, P. et al. Aerobic endurance training improves nonalcoholic fatty liver disease (NAFLD) features via miR-33 dependent autophagy induction in high fat diet fed mice. Obesity research & clinical practice, 10.1016/j.orcp.2017.01.004 (2017). [DOI] [PubMed]
- 24.Sud N, et al. Aberrant expression of microRNA induced by high-fructose diet: implications in the pathogenesis of hyperlipidemia and hepatic insulin resistance. The Journal of nutritional biochemistry. 2017;43:125–131. doi: 10.1016/j.jnutbio.2017.02.003. [DOI] [PMC free article] [PubMed] [Google Scholar]
- 25.Wang H, et al. Fish Oil Feeding Modulates the Expression of Hepatic MicroRNAs in a Western-Style Diet-Induced Nonalcoholic Fatty Liver Disease Rat Model. BioMed research international. 2017;2017:2503847. doi: 10.1155/2017/2503847. [DOI] [PMC free article] [PubMed] [Google Scholar]
- 26.Aktas B, et al. Serum levels of vaspin, obestatin, and apelin-36 in patients with nonalcoholic fatty liver disease. Metabolism: clinical and experimental. 2011;60:544–549. doi: 10.1016/j.metabol.2010.05.008. [DOI] [PubMed] [Google Scholar]
- 27.Bukong TN, Maurice SB, Chahal B, Schaeffer DF, Winwood PJ. Versican: a novel modulator of hepatic fibrosis. Laboratory investigation; a journal of technical methods and pathology. 2016;96:361–374. doi: 10.1038/labinvest.2015.152. [DOI] [PubMed] [Google Scholar]
- 28.Celikbilek M, et al. Circulating microRNAs in patients with non-alcoholic fatty liver disease. World journal of hepatology. 2014;6:613–620. doi: 10.4254/wjh.v6.i8.613. [DOI] [PMC free article] [PubMed] [Google Scholar]
- 29.Li D, et al. Down-regulation of miR-144 elicits proinflammatory cytokine production by targeting toll-like receptor 2 in nonalcoholic steatohepatitis of high-fat-diet-induced metabolic syndrome E3 rats. Molecular and cellular endocrinology. 2015;402:1–12. doi: 10.1016/j.mce.2014.12.007. [DOI] [PubMed] [Google Scholar]
- 30.Vega-Badillo J, et al. Hepatic miR-33a/miR-144 and their target gene ABCA1 are associated with steatohepatitis in morbidly obese subjects. Liver international: official journal of the International Association for the Study of the Liver. 2016;36:1383–1391. doi: 10.1111/liv.13109. [DOI] [PubMed] [Google Scholar]
- 31.Cheng, J. et al. Ablation of systemic SIRT1 activity promotes nonalcoholic fatty liver disease by affecting liver-mesenteric adipose tissue fatty acid mobilization. Biochimica et biophysica acta, 10.1016/j.bbadis.2017.08.004 (2017). [DOI] [PubMed]
- 32.Wruck W, Adjaye J. Meta-analysis reveals up-regulation of cholesterol processes in non-alcoholic and down-regulation in alcoholic fatty liver disease. World journal of hepatology. 2017;9:443–454. doi: 10.4254/wjh.v9.i8.443. [DOI] [PMC free article] [PubMed] [Google Scholar]
- 33.Sinha M, Ghatak S, Roy S, Sen CK. microRNA-200b as a Switch for Inducible Adult Angiogenesis. Antioxidants & redox signaling. 2015;22:1257–1272. doi: 10.1089/ars.2014.6065. [DOI] [PMC free article] [PubMed] [Google Scholar]
- 34.Feng YY, et al. Aberrant hepatic microRNA expression in nonalcoholic fatty liver disease. Cellular physiology and biochemistry: international journal of experimental cellular physiology, biochemistry, and pharmacology. 2014;34:1983–1997. doi: 10.1159/000366394. [DOI] [PubMed] [Google Scholar]
- 35.Tryndyak VP, et al. Plasma microRNAs are sensitive indicators of inter-strain differences in the severity of liver injury induced in mice by a choline- and folate-deficient diet. Toxicology and applied pharmacology. 2012;262:52–59. doi: 10.1016/j.taap.2012.04.018. [DOI] [PMC free article] [PubMed] [Google Scholar]
- 36.Su K, et al. The ABCG5 ABCG8 sterol transporter opposes the development of fatty liver disease and loss of glycemic control independently of phytosterol accumulation. The Journal of biological chemistry. 2012;287:28564–28575. doi: 10.1074/jbc.M112.360081. [DOI] [PMC free article] [PubMed] [Google Scholar]
- 37.Liu Y, et al. 3,3′-Diindolylmethane alleviates steatosis and the progression of NASH partly through shifting the imbalance of Treg/Th17 cells to Treg dominance. International immunopharmacology. 2014;23:489–498. doi: 10.1016/j.intimp.2014.09.024. [DOI] [PubMed] [Google Scholar]
- 38.El-Ahwany E, et al. Circulating miRNAs as Predictor Markers for Activation of Hepatic Stellate Cells and Progression of HCV-Induced Liver Fibrosis. Electronic physician. 2016;8:1804–1810. doi: 10.19082/1804. [DOI] [PMC free article] [PubMed] [Google Scholar]
- 39.Osman RH, et al. Fads1 and 2 are promoted to meet instant need for long-chain polyunsaturated fatty acids in goose fatty liver. Molecular and cellular biochemistry. 2016;418:103–117. doi: 10.1007/s11010-016-2737-7. [DOI] [PubMed] [Google Scholar]
- 40.Tu LN, et al. Metabolomic characteristics of cholesterol-induced non-obese nonalcoholic fatty liver disease in mice. Scientific reports. 2017;7:6120. doi: 10.1038/s41598-017-05040-6. [DOI] [PMC free article] [PubMed] [Google Scholar]
- 41.Kang HH, et al. Chronic intermittent hypoxia induces liver fibrosis in mice with diet-induced obesity via TLR4/MyD88/MAPK/NF-kB signaling pathways. Biochemical and biophysical research communications. 2017;490:349–355. doi: 10.1016/j.bbrc.2017.06.047. [DOI] [PubMed] [Google Scholar]
- 42.Gabbia, D. et al. The Phytocomplex from Fucus vesiculosus and Ascophyllum nodosum Controls Postprandial Plasma Glucose Levels: An In Vitro and In Vivo Study in a Mouse Model of NASH. Marine drugs15, 10.3390/md15020041 (2017). [DOI] [PMC free article] [PubMed]
- 43.Pathak P, et al. Farnesoid X receptor induces Takeda G-protein receptor 5 cross-talk to regulate bile acid synthesis and hepatic metabolism. The Journal of biological chemistry. 2017;292:11055–11069. doi: 10.1074/jbc.M117.784322. [DOI] [PMC free article] [PubMed] [Google Scholar]
- 44.Lake AD, et al. Decreased hepatotoxic bile acid composition and altered synthesis in progressive human nonalcoholic fatty liver disease. Toxicology and applied pharmacology. 2013;268:132–140. doi: 10.1016/j.taap.2013.01.022. [DOI] [PMC free article] [PubMed] [Google Scholar]
- 45.Wang C, Tao Q, Wang X, Wang X, Zhang X. Impact of high-fat diet on liver genes expression profiles in mice model of nonalcoholic fatty liver disease. Environmental toxicology and pharmacology. 2016;45:52–62. doi: 10.1016/j.etap.2016.05.014. [DOI] [PubMed] [Google Scholar]
- 46.Pardina E, et al. Diabetic and dyslipidaemic morbidly obese exhibit more liver alterations compared with healthy morbidly obese. BBA clinical. 2016;5:54–65. doi: 10.1016/j.bbacli.2015.12.002. [DOI] [PMC free article] [PubMed] [Google Scholar]
- 47.Leti F, et al. High-throughput sequencing reveals altered expression of hepatic microRNAs in nonalcoholic fatty liver disease-related fibrosis. Translational research: the journal of laboratory and clinical medicine. 2015;166:304–314. doi: 10.1016/j.trsl.2015.04.014. [DOI] [PMC free article] [PubMed] [Google Scholar]
- 48.Chen C, Khaleel SS, Huang H, Wu CH. Software for pre-processing Illumina next-generation sequencing short read sequences. Source code for biology and medicine. 2014;9:8. doi: 10.1186/1751-0473-9-8. [DOI] [PMC free article] [PubMed] [Google Scholar]
Associated Data
This section collects any data citations, data availability statements, or supplementary materials included in this article.
Supplementary Materials
Data Availability Statement
All data generated during this study are included in this published article (and its Supplementary Information files).


