Abstract
Development of platforms for a reliable, rapid, sensitive and selective detection of chikungunya virus (CHIGV) is the need of the hour in developing countries. To the best of our knowledge, there are no reports available for the electrochemical detection of CHIGVDNA. Therefore, we aim at developing a biosensor based on molybdenum disulphide nanosheets (MoS2 NSs) for the point-of-care diagnosis of CHIGV. Briefly, MoS2 NSs were synthesized by chemical route and characterized using scanning electron microscopy, transmission electron microscopy, UV-Vis spectroscopy, Raman spectroscopy and X-Ray Diffraction. MoS2 NSs were then subjected to physical adsorption onto the screen printed gold electrodes (SPGEs) and then employed for the detection of CHIGV DNA using electrochemical voltammetric techniques. Herein, the role of MoS2 NSs is to provide biocompatibility to the biological recognition element on the surface of the screen printed electrodes. The detection strategy employed herein is the ability of methylene blue to interact differentially with the guanine bases of the single and double-stranded DNA which leads to change in the magnitude of the voltammetric signal. The proposed genosensor exhibited a wide linear range of 0.1 nM to 100 µM towards the chikungunya virus DNA.
Introduction
Chikungunya (CHIG) is a disease caused by chikungunya virus (CHIGV); which is a RNA virus belonging to Alphavirus genus and Togaviridae family1. CHIG was discovered in Tanzania (1952) and since then four types of its genotypes have been identified so far2. These include East-Central South African (ECSA), West African, Asian, and the Indian Ocean Lineage (IOL)3,4. This disease transmits to the humans by infected mosquitoes, namely; Aedes agypti and Aedes albopictis5. CHIG has been characterized by onset of sudden fever followed by skin rashes, rigorous joint pain and relentless rheumatic symptoms1,6. The acute infection of CHIG is self-limiting and the symptoms mostly resolve within weeks to years7. Though rarely fatal; CHIG has emerged as a major public health concern recently; due to its enormous outbreaks all over the world8. According to World Health Organization, there were 6,93,489 suspected and 37,480 confirmed cases of chikungunya as reported by Pan American Health Organization (PAHO) regional office1. The massive outbreak in India in 2016 has left long lasting effects on the population9. Looking at the rate at which CHIG is spreading, its rapid and early diagnosis is the most significant challenge for government aided health care agencies and developing countries.
Detection of CHIG RNA through RT-PCR from serum samples or determination of serum antibodies (IgM) are the diagnostic measures followed conventionally9. These methods are time consuming and the procedure is cumbersome. Thus, rapid and early monitoring point-of-care (POC) diagnostic tool has become the need of hour. Advancements in electrochemical biosensors have motivated various designs of real time POC diagnosis tools10. The advantages such as rapid response time, low cost and suitability for mass production associated with detection of DNA hybridization have triggered the development of DNA-based electrochemical biosensors5,11,12. These advantages motivated the present work wherein we have developed an electrochemical DNA biosensor for the detection of CHIGV DNA. A practical advantage of electrochemical detection could have future implications in translating to cheap assays using single-use screen-printed electrodes (SPEs), which is an ideal tool due to their low cost, disposability and design flexibility as compared to traditional electrode materials13–15. Hence, SPEs serve as a transition away from the traditional cumbersome beaker-type electrochemical cells and bulky electrodes16.
Previously several DNA biosensors have been reported involving labeling of PCR products with enzymes17, redox active components18 or nanoparticles19,20 to enhance the electrochemical signal. Nanomaterials have been used as carrier beacons for indirect; however, vigorous and precise means for detecting target molecules. Two-dimensional (2D) molybdenum disulphide (MoS2) nanomaterials belonging to transition-metal dichalcogenides have been gaining much attention these days21. This is because MoS2 has emerged as a material with exceptional biocompatibility, good electrochemical catalysts activity, easy modification22, high specific surface area and large junction area of the electrode/electrolyte23 and sensitive surface states (high surface-to-volume ratio)24. Each Mo is coordinated to six S atoms; by stacking covalently bound S–Mo–S via weak van der Waals interactions25, thereby enhancing the planar electric transportation properties26,27. MoS2 nanosheets (MoS2 NSs) are capable enough to adsorb single-stranded DNA by the van der Waals force between nucleobases and the basal plane of MoS2NSs24,25. These advantages along with the existence of suitable bandgap in comparison to graphene and graphene oxides which have small or no band gaps makes MoS2NSs highly suitable for sensors that can detect DNA, proteins, metal ions, and other compounds.
In the present report, an electrochemical DNA biosensor has been prepared for the detection of DNA of chikungunya virus electrochemically. Screen printed disposable gold electrodes coated with molybdenum disulphide nanosheets have been used as the platform for immobilization of the probe DNA and employed for the detection of the target DNA.
Results and Discussion
Assay design and principle
A schematic representation showing the main steps in our assay for detection of target CHIG DNA and the principle behind the detection is represented in Fig. 1. Figure 1(a) shows the various components of SPGE. The working electrode (WE) and counter electrode (CE) were made of gold and the reference electrode (RE) was made of silver. The main steps involved in the fabrication of SPGEs were presented in Fig. 1(b). The gold on the WE of SPGE shows strong affinity for the sulfur group in MoS2 (Fig. 1(c)). This confirms a strong immobilization of MoS2 over SPGE. Probe DNA of CHIGV was immobilized over MoS2 coated SPGE (Fig. 1(b)). The MoS2 are capable enough to adsorb single-stranded DNA by the van der Waals force between nucleobases24,25 and the basal plane of MoS2NSs (Fig. 1(d)). Thereby ensuring efficient immobilization. Further, the target DNA was added (Fig. 1(b)) along with MB and the hybridization was allowed to occur for 60 sec. The role of MB has been presented schematically in Fig. 1(e). The interaction of MB with the free guanine bases of the single-stranded DNA leads to enhanced electrochemical response. This is due to its ability to attract to guanine via Vander Waals interaction. Upon hybridization, the MB gets intercalated between the bulky double helix of the double-stranded DNA. Thus, a decreased response was observed as shown in Fig. 1(e).
Figure 1.
(a) Screen printed gold electrode (SPGE). (b) Stepwise representation of the fabrication of SPGE with MoS2 nanosheets, probe DNA and target DNA. (c) Interaction of working electrode (Au) of SPGE and MoS2 shows strong affinity between Au (SPGE) and S (MoS2). (d) MoS2 interacts with probe DNA via Vander Waals forces. (e) Principle for the detection of hybridization of target DNA via redox hybridization indicator, i.e., methylene blue.
Characterization of the synthesized MoS2 nanosheets (MoS2 NSs)
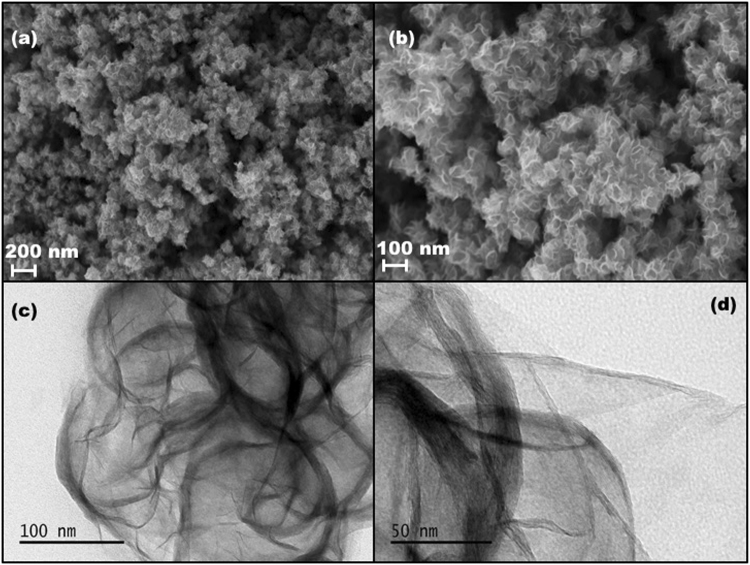
SEM images clearly showed that highly dense, laminar nanosheets with curved edges. The nanosheets are folded at the edges giving them a petal like shape (Fig. 2(a,b)). Transmission electron microscopy is an excellent tool to characterize two dimensional transition metal dichalcogenides (TMDs). The MoS2 monolayer is composed of three atom layers: Mo layer sandwiched between two sulphur layers. The three layers are stacked via weak vander Waal interaction. TEM micrographs (Fig. 2(c,d)) clearly showed that thin layer structures of MoS2 nanosheets. The interplanar spacing is found to be 0.64 nm which is in agreement with the earlier reports28.
Figure 2.
(a) Scanning electron micrograph of MoS2 nanosheets at 200 nm. (b) Scanning electron micrograph of MoS2 nanosheets at 100 nm. (c) Transmission electron micrograph of MoS2 nanosheets at 100 nm. (d) Transmission electron micrograph of MoS2 nanosheets at 50 nm.
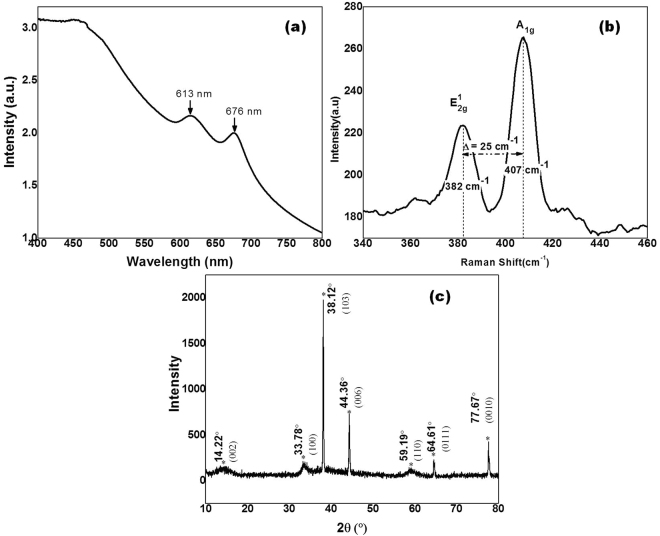
Figure 3(a) shows the UV-Vis absorption spectra of MoS2 nanosheets. Two characteristic absorption peaks (A and B) were observed at 676 nm (1.83 eV) and 66 613 nm (2.02 eV). These exciton peaks correspond to A and B direct electronic transition of MoS2 nanosheets, originated from the energy split of valence band and spin orbit coupling29.
Figure 3.
(a) UV-Vis spectroscopy of MoS2 NSs. (b) Raman spectra of MoS2 NSs. (c) X-Ray Diffraction spectra of MoS2 NSs.
Figure 3(b) shows the Raman spectrum of as synthesized MoS2 nanosheets. A typical two pronounced peaks were observed at 382 cm−1 and 407 cm−1. The Raman peak at 382 cm−1 (E12g) is associated with the in-plane MoS2 phonon mode and 407 cm−1 (A1g) is due to the out of plane MoS2 phonon mode. The difference between these characteristic peaks is 25 cm−1 implying that nanosheets consist of 5 or more MoS2 layers is stacked together. These two characteristic peaks indicate that synthesized MoS2 nanosheets possess 2H-MoS2 structure30. The crystal structure of the MoS2 nanosheets was investigated through X-ray diffraction as shown in the Fig. 3(c). All the diffraction peaks can be indexed reported MoS2 phase (JCPDS card No. 37–1492). The peaks at 14.22°, 33.78°, 38.12°, 44.36°, 59.19°, 64.61° and 77.67° can be ascribed to (002), (100), (103), (006), (110), (0111) and (0010) planes of MoS2, respectively.
Optimization of the concentration of the MoS2 nanosheets and PDNA concentration
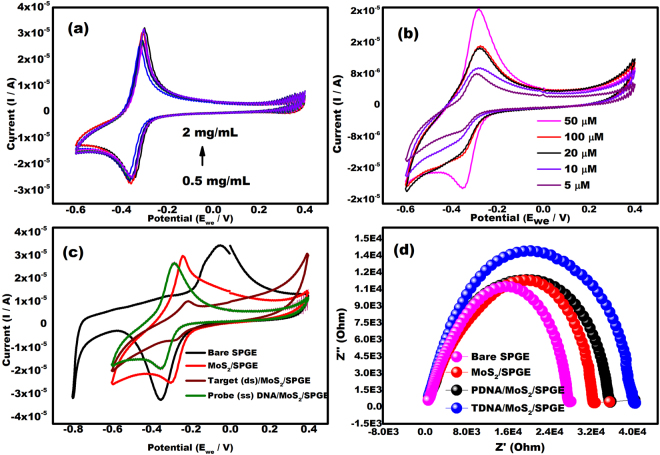
Optimization of the concentration of MoS2 nanosheets and probe DNA is an important parameter to ensure sufficient hybridization. The cyclic voltammograms of various concentrations of MoS2 and PDNA were shown in Fig. 4(a,b) respectively. The concentration of MoS2 was varied from 0.5 mg/mL to 2 mg/mL and the electrochemical response was observed. The highest response occurred at 1 mg/mL (Fig. 4(a)). Above 1 mg/mL, the response was stable so this was chosen as the concentration of MoS2 for the future experiments.
Figure 4.
(a) Electrochemical ability of different concentrations of MoS2 nanosheets deposited on SPGEs from a concentration of 0.5 to 2 mg/mL in 0.1 M PBS containing 1 µM MB at the scan rate of 100 mVs−1 in the potential range from −0.6 to +0.4 V. (b) Cyclic voltammograms of PDNA/MoS2NSs/SPGEs in 0.1 M PBS containing 1 µM MB at various concentrations of probe DNA ranging from 5 µM to 100 µM at the scan rate of 100 mVs−1 in the potential range from −0.6 to +0.4 V. (c) Cyclic voltammograms at various stages of screen printed gold electrode (SPGE) including bare SPGE, MoS2 coated SPGE, probe DNA coated SPGE and target DNA coated SPGE in 0.1 M phosphate buffer saline (pH 7.8), 1 µM MB in the potential range from −0.6 to +0.4 V. (d) Nyquist plot at various stages of screen printed gold electrode (SPGE) including bare SPGE, MoS2 coated SPGE, probe DNA coated SPGE and target DNA coated SPGE in 0.1 M phosphate buffer saline (pH 7.8) and 1 µM MB (frequency range of 100 Hz–103 kHz).
Figure 4(b) shows that the highest peak current was observed when PDNA concentration was 50 µM. At 100 µM PDNA, the signal drastically reduced. This was due to the increased thickness of the organic layer at the surface of SPGE which decreased the electron transfer rates. Consequently, 50 µM was chosen as the most favorable concentration of PDNA.
Electrochemical analysis at various stages of the SPGEs
The electrochemical behaviors of various stages of SPGEs obtained after modification with MoS2NSs, PDNA or TDNA were analyzed using CV in 0.1 M phosphate buffer saline (pH 7.8) and 1 µM MB in the potential range from −0.6 to +0.4 V at a scan rate of 100 mVs−1 (Fig. 4(c)). All modified SPGEs exhibited a pair of well-defined redox peaks due to the oxidation and reduction of methylene blue at SPGE. As can be seen in Fig. 4(c), bare SPGE shows the maximum electrochemical response of 3.2 × 10⁻⁵ A (Ia) and −3.5 × 10⁻⁵ A (Ic) due to the presence of gold which shows good metallic conductivity. MoS2 NSs shows decreased current response of 2.9 × 10⁻⁵ A (Ia) and −2.8 × 10⁻⁵ A (Ic) due to the semi-conducting nature of MoS2 in comparison to the conducting gold (bare SPGE). In spite of the decreased electrochemical response, the MoS2 nanosheets are preferred; due to their ability to adsorb ssDNA by the van der Waals force between nucleobases and the basal plane of MoS2NSs24,25. The immobilized probe DNA shows further decrease in the current response to 2.5 × 10⁻⁵ A (Ia) and −2.2 × 10⁻⁵ A (Ic). This is due to the insulating nature of the DNA. As stated above, hybridization of the target DNA with the probe DNA further decreases the electrochemical response to 6 × 10⁻⁶ A (Ia) and −8 × 10⁻⁶ A (Ic).
The voltage for the peaks of methylene blue were −0.22 V (Ea) −0.29 V (Ec) at MoS2NSs modified SPEs and shifted to more negative values (Ea = −0.31 V, Ec = −0.38 V) when analyzed with the probe DNA modified SPE, reverting to more positive potentials (Ea = −0.19 V, Ec = −0.28 V) upon hybridization of the chikungunya DNA.
The explanation for this behavior is explained by Raveendran et al.31. As per their report, the shift in the potential over the surface of SPGEs lies on the negatively charged nature of DNA and the transfer of electrons during the hybridization event. MoS2NSs transfer the electrons from the MB and vice versa during cyclic voltammetry to produce the characteristic voltammogram at the specified voltage. Modification of MoS2NSs by the probe DNA modifies this transfer of electrons reducing the potential at which this is occurring, making it easier for MB to reduce. During the hybridization of the CHIGV target DNA with the complementary strand of the probe DNA immobilized on the surface there is a restructuration of the molecules and a higher demand for electrons, which leads to reduction of MB with less available electrons for the molecule, hence increasing the reduction potential.
The similar response was observed in Fig. 4(d) which shows Nyquist plot at various stages of SPGE. The resistance charge transfer (Rct) value of bare SPGE was lowest and that of target DNA was highest. The probe DNA show increased Rct value in comparison to MoS2 NSs. Since, the resistance is inversely proportional to the current; therefore, the Nyquist plot and CV results were in line with one another.
Electrochemical response of PDNA/MoS2NSs/SPGEs at various scan rates
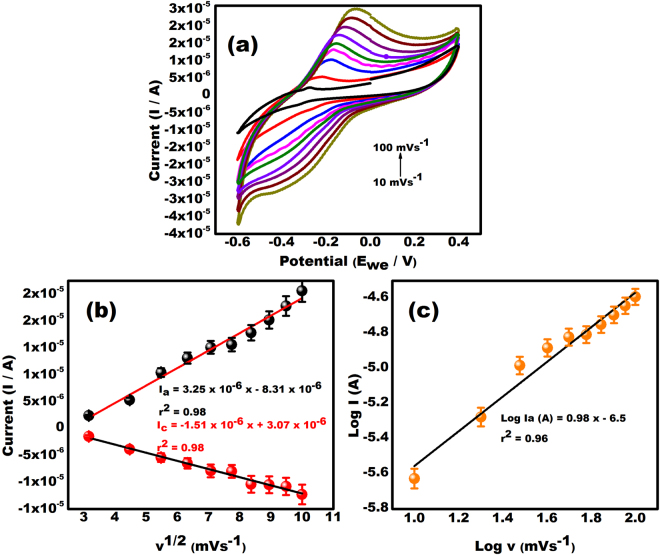
The effect of scan rates ranging from 10 to 100 mVs−1 on the PDNA/MoS2NSs/SPGEs is shown in Fig. 5(a). It shows that the anodic and cathodic peak current of MB on the PDNA biosensor increased constantly from 10 to 100 mVs−1, confirming that the electrochemical reaction process of the biosensor is mainly diffusion controlled. However, to assure the stability of the biosensor response, 100 mVs−1 was chosen as the scan rate for subsequent studies.
Figure 5.
(a) Cyclic Voltammograms obtained at PDNA/MoS2 NSs/SPGE for scan rates ranging from 10–100 mVs−1 in 0.1 M phosphate buffer saline (pH 7.8) and 1 µM MB in the potential range from −0.6 to +0.4 V. (b) The dependency of peak currents on the square root of potential sweep rates in a wide range of 10–100 mVs−1 (c) Dependence of log of peak current on log v (mVs−1).
The oxidation (Ia) and reduction peak current (Ip) both were proportional to square root of scan rate (v1/2) in Fig. 5(b) which is expressed as Ia = 3.25 × 10⁻⁶ × −8.31 × 10⁻⁶, r2 = 0.98, Ic = −1.51 × 10⁻⁶ × +3.07 × 10⁻⁶, r2 = 0.98. This makes it clear that the process of catalysis is diffusion controlled rather than surface controlled under the condition of sufficient potential32,33. The diffusion controlled behavior of the reaction is confirmed by a plot between Log Ia and Log v as; Log Ia = 0.98 log v (mVs−1) − 6.5, r2 = 0.96 as shown in Fig. 5(c).
Analytical performance of the biosensor
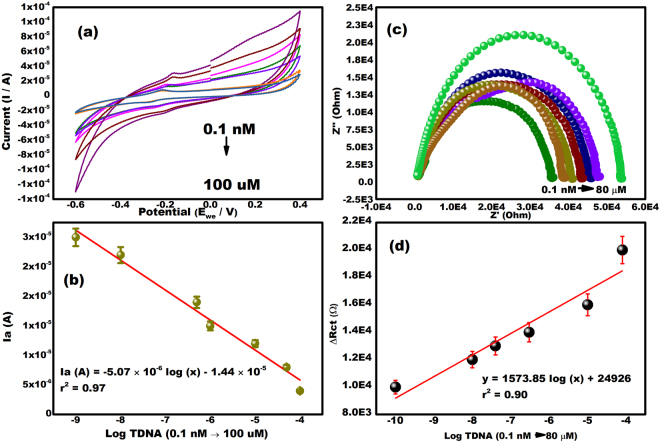
A close perusal of cyclic voltammograms shows that the response signal of MB decreases with the increase of TDNA concentration in the range 0.1 nM to 100 µM (Fig. 6(a)). The peak current has decreased due to the formation of bulky hybrid complexes which hinder the interaction of MB molecules with the pure PDNA on the electrode. MB behaves as an anionic indicator with the ability to bind with the unpaired guanine bases in the DNA strands. Therefore, higher number of unpaired guanine residues results in higher interaction of MB molecules with the DNA strand and thus gives higher current response. The hybridization of the probe and target DNA lead to the reduction in the availability of the unpaired guanine because of its hydrogen bonding with cytosine in the complimentary target DNA. This results in lesser interaction of MB and thus, lower current response. Therefore, the current response decreases after hybridization of the TDNA because of lesser interaction of MB with unpaired guanine. The similar analyses have been reported earlier as well34,35. Figure 6(c) shows a linear variation in peak currents with the concentrations of target nucleotide. The linear fitted relation is given below:
Figure 6.
(a) Cyclic Voltammograms verifying hybridization of the different conc. of the complementary target DNA at PDNA/MoS2NSs/SPGE (0.1 nM to 100 µM) in 0.1 M phosphate buffer saline (pH 7.8) and 1 µM MB in the potential range from −0.6 to +0.4 V. (b) Nyquist Plot verifying hybridization of the different conc. of the complementary target DNA at PDNA/MoS2NSs/SPGE (0.1 nM to 80 µM) in 0.1 M phosphate buffer saline (pH 7.8) and 1 µM MB (frequency range of 100 Hz–103 kHz). (c) The calibration plot of the TDNA/PDNA/MoS2NSs/SPGE electrode as a function of the logarithmic concentration of the Target DNA and anodic peak current. (d) The calibration plot of the TDNA/PDNA/MoS2NSs/SPGE electrode as a function of the logarithmic concentration of the Target DNA and change in resistance charge transfer.
The limit of detection (LOD) was calculated to be 3.4 nM in a 3 σ rule and limit of quantification (LOQ) was calculated to be 104.81 nM in a 10 σ rule. Our proposed sensor offers a wide linear range (0.1 nM to 100 µM) and sufficiently low detection limit for CHIGV detection.
Electrochemical Impedance Spectroscopy (EIS) was also done in order to confirm the hybridization of the probe DNA with the various concentrations of target DNA (0.1 nM to 80 µM). Figure 6(b) shows the nyquist plot indicating the hybridization of the target DNA to the PDNA. Upon increasing the concentration of the target DNA from 0.1 nM to 80 µM, the Rct value increased. This is because the results of EIS and CV are always contrary from one another. Thus, verifying hybridization. Figure 6(d) shows a linear variation in change in Rct with the log of the concentrations of target nucleotide. The linear fitted relation is given below:
Effect of pH, temperature and hybridization time on the PDNA biosensor
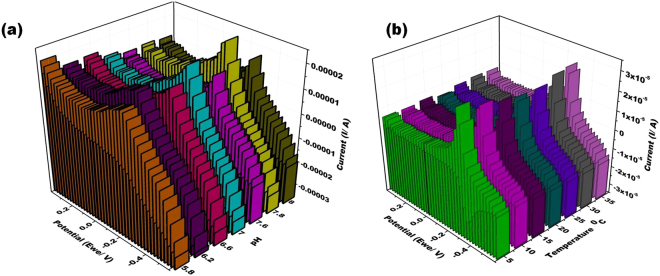
Figure 7(a) depicts the 3D representation of the cyclic voltammograms for the pH response of the biosensor. Since MoS2 is generally considered to be biocompatible with DNA, the pH response of the MB solution at PDNA/MoS2NSs/SPGE was studied. The alkaline conditions are beneficial for MB because MB (C16H18N3SCl) is a heterocyclic aromatic chemical compound and under alkaline conditions, it tends to form cations, whereas OH− is adsorbed to the surface of PDNA modified to form negatively charged adsorption centers, thus promoting the adsorption of MB ions36. The highest current response was observed at pH 7.8 after which the response became stable. Thus, pH 7.8 was chosen for the rest of the experiments.
Figure 7.
(a) 3D representation of the cyclic voltammogram at PDNA/MoS2NSs/SPGE for pH of 0.1 M phosphate buffer saline ranging from 5.8 to 8.0 each is having 1 µM MB in the potential range from −0.6 to +0.4 V at the scan rate of 100 mVs−1. (b) 3D representation of the cyclic voltammogram at PDNA/MoS2NSs/SPGE for temperatures ranging from 5 to 35 °C in 0.1 M phosphate buffer saline ranging having 1 µM MB in the potential range from −0.6 to +0.4 V at the scan rate of 100 mVs−1.
The effect of temperature on the PDNA/MoS2NSs/SPGE was studied and the results are presented in Fig. 7(b)). As evident from the figure, the electrochemical response of the sensor enhanced upon increasing the temperature (though not much difference); because high temperatures are more favorable for hybridization (obvious from PCR). But in order to keep the simplicity of employment of the biosensor for general use, 35 °C was chosen as the temperature at which appropriate hybridization could take place.
The hybridization time is an important parameter in a DNA biosensor. Therefore, the hybridization time was optimized. For this, different electrodes with PDNA immobilized were prepared and TDNA was added with MB. Cyclic voltammetric measurements were recorded at various time intervals. After the analysis, 35 sec was kept as the optimum hybridization time for this biosensor.
Real samples and selectivity analysis of the biosensor
The target DNA was spiked in purchased serum sample and dropped on the surface of the PDNA/MoS2NSs/SPGE. The hybridization of probe DNA with target DNA in serum sample occurred and the current response observed was similar to the current response obtained when TDNA was directly added over the PDNA/MoS2NSs/SPGE (Fig. 8). Thus, confirming the analysis in real samples.
Figure 8.
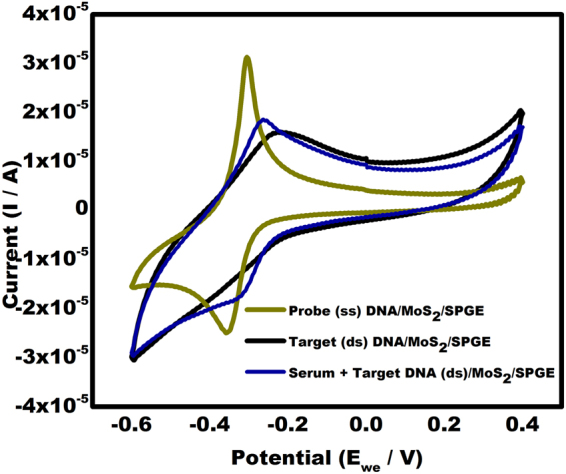
Cyclic voltammogram hybridization of chikungunya TDNA spiked in real sample (serum) in comparison with PDNA and TDNA in the potential range from −0.6 V to +0.4 V at a scan rate of 100 mVs−1.
In order to investigate the selectivity of this biosensor, the current response obtained from PDNA/MoS2NSs/SPGE and hybridized TDNA/MoS2NSs/SPGE was compared to the non-complimentary DNA (n DNA). A significantly different current response was observed in case of nDNA when compared with the TDNA. The non-complimentary DNA showed response nearly equal to the PDNA (Fig. 9). Thus, no hybridization occurred with the nDNA and MB is free to interact with the guanine bases available in the ssDNA.
Figure 9.
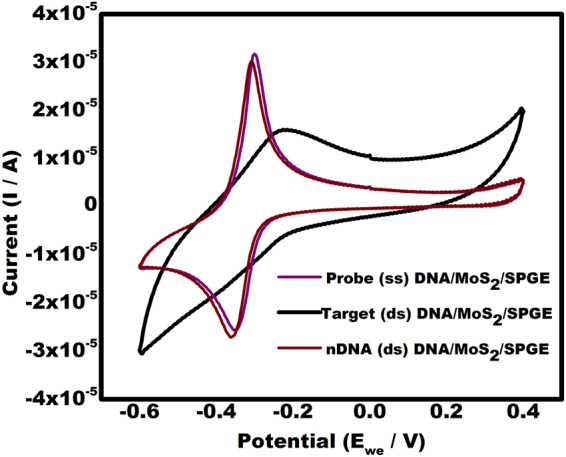
Cyclic voltammograms showing response of non-complementary DNA (nDNA) by the present sensor in comparison with PDNA and TDNA.
Comparison study
The sensing interface ability of present genosensor was compared with earlier reported MoS2 based biosensors37–52. High sensitivity, specificity and repeatability of the sensor make it best among other biosensors (Supplementary Table 1).
Methods
Reagents and apparatus
Monosodium phosphate, Disodium phosphate was purchased from SRL, India. Methylene blue was purchased from Thermo Fischer Scientific, India. All the chemicals were of analytical reagent grade and used without further purification. Double-distilled water was used throughout this experiment. Tris-EDTA (TE buffer) buffer of pH 8.0 was used to prepare the 100 µM stock solutions of probe DNA and target DNA. Phosphate buffer saline (PBS, 0.1 M) was prepared by mixing the stock solutions of 1 M NaH2PO4 and Na2HPO4 and NaCl. 1 µM methylene blue (MB) prepared in PBS was used as buffer solution in all the electrochemical measurements. DRP-220 AT (screen printed with high temperature curing ink) screen printed gold electrodes (SPGEs) with 3.4 × 1.0 × 0.05 cm dimensions were purchased from DropSens (India). The SPGEs had working electrode (diameter of 1.4 mm) and counter electrodes made of gold whereas the reference electrode and the electrical contacts were made of silver. Human serum (minus IgA/IgM/IgG) was obtained as a lyophilized powder from Sigma Aldrich (India). Electrochemical measurements like cyclic voltammetry (CV) were measured on Autolab PGSTAT 204. Morphology of the MoS2 nanosheets was characterized by transmission electron microscope (TEM, FEI Tecnai G2, 300 KV) and scanning electron microscopy (JEOL JSM-6010LA). TEM sample preparation was done by placing a drop of MoS2 nanosheets on carbon coated copper grid followed by drying in air and transferred to the microscope operated at an accelerating voltage of 300 KV. The structure of MoS2 nanosheets were studied by X-Ray Diffraction. Sample was scanned in the range of 10 ° to 80 ° at a glancing angle of 1 °. The Raman spectrum was taken by using a Horiba micro-Raman confocal microscopic system (LabRAM), at room temperature in an ambient air. A spectrophotometer (Agilent Technologies, model no: Cary 100 series) was used to obtain the UV-Vis absorption spectra of the MoS2 nanosheets, which were recorded in the wavelength range of 300–800 nm at room temperature.
Preparation of CHIG probe and target DNA
All the oligonucleotides were synthesized by Integrated DNA Technology (IDT) as lyophilized translucent films. The sequences were listed as follows:
Probe DNA: 5′-NH2- TGC TCC GCG TCC TTT ACC AA-3′
Target DNA: 5′-TTG GTA AAG GAC GCGGAG CA-3′
Non-complimentary (NC) DNA: 5′-CTA TGC TTA CAC GTA GAC TGT GC-3′.
Synthesis of Molybdenum disulphide nanosheets (MoS2 NSs)
MoS2 NSs were synthesized by dissolving 3 mM of sodium molybdate dihydrate and 9 mM of thioacetamide in 50 mL of distilled water. Further 2.8 mM silicon tungstic acid was added into the reaction solution under violent stirring. The resultant solution was transferred into a 100 mL Teflon-lined stainless autoclave and was kept at 220 °C for 24 h. Then the autoclave was allowed to cool and the resulting products were filtered off, washed with 1 M NaOH, ethanol and distilled water for several times, and dried in vacuum at 50 °C for 8 h.
Bioelectrode fabrication, immobilization of PDNA and hybridization of TDNA
The bare SPGEs were cleaned by washing them subsequently with gold cleaning solution and 0.1 M phosphate buffer saline. The synthesized MoS2 NSs (2.5 µL) were deposited physically on the surface of the working electrode (WE) of SPGEs. The drop-casted electrodes were left for drying at room temperature for 1.5 h. Since gold has a high affinity for sulfur, modification of SPGEs was made easy.
The MoS2 NSs/SPGEs were further interacted with the CHIG probe DNA. After drying, 3 µL of the probe DNA was deposited over the MoS2 NSs. The probe DNA immobilized MoS2 NSs/SPGEs were left for 3 h to allow complete immobilization. The probe DNA immobilized SPGE was further used for hybridization of the target DNA. The target DNA was added along with the hybridization indicator (MB) and after appropriate time (optimized); the electrochemical analysis was done to confirm hybridization.
Optimization of pH, temperature and hybridization time
The probe DNA immobilized SPGE was optimized for hybridization at various pH (5.8 to 8) and temperature (20 to 40 °C). The pH, temperature showing best electrochemical response was finally used for hybridization with the target DNA. The hybridization time is also an important factor in a DNA biosensor and thus, the hybridization time between PDNA and TDNA was also optimized. Six electrodes having fixed concentration of probe DNA (50 µM) over MoS2 NSs were prepared and were incubated with complimentary target DNA (80 µM) for different intervals of time (10 to 60 s).
Analysis of the stability, specificity and performance of the biosensor with real sample
The real sample analysis was done by adding known concentration of the target oligonucleotides in the purchased serum. This mixture along with PBS containing MB was dropped over probe DNA modified SPGE and sensing was done further. The stability analysis was performed by storing the probe DNA modified SPGE at 4 °C and periodically measuring the signal strength corresponding to it by CV and DPV upon addition of the target DNA. For selectivity analysis of the proposed DNA biosensor, the probe DNA modified SPGE was exposed to complementary and non-complementary target samples. The concentration of the non-complementary nucleotide sample was kept 3 orders higher than that of the complementary sample for determining the sensor selectivity. The probe modified electrodes was exposed to complementary and non-complementary target samples subsequently.
Conclusions
A reliable electrochemical CHIGV DNA detection system has been developed in the present work. MoS2 nanosheets deposited screen printed gold electrodes proved efficient for probe DNA binding. The sensor shows good linear range from 0.1 nM to 100 µM with 3.4 nM as the limit of detection. Point of care technologies (POCTs) are the need of the hour. The features like less response time, high linearity and economic feasibility makes the present sensor beneficial to be miniaturized as POCTs.
Electronic supplementary material
Acknowledgements
The present work was supported to one of the authors (Dr. Mannika Khanuja) by Science and Engineering Research Board (SERB). THE grant number is ECR/2017/001222. Thanks to all the authors who helped in this manuscript.
Author Contributions
Chaitali Singhal was involved in performing the experiments and evaluating the results and writing the manuscript. Manika Khanuja and Nahid Chaudhary synthesized and characterized the MoS2 nanosheets. Jagriti Narang formulated the idea and working of the present work. This work was done under the guidance of Jagriti Narang and C.S. Pundir.
Competing Interests
The authors declare no competing interests.
Footnotes
Electronic supplementary material
Supplementary information accompanies this paper at 10.1038/s41598-018-25824-8.
Publisher's note: Springer Nature remains neutral with regard to jurisdictional claims in published maps and institutional affiliations.
Contributor Information
Manika Khanuja, Email: manikakhanuja@gmail.com.
C. S. Pundir, Email: pundircs@rediffmail.com
Jagriti Narang, Email: jags_biotech@yahoo.co.in.
References
- 1.World Health Organization, Chikungunya. (2017). Available from: http://www. who.int/mediacentre/factsheets/fs327/en/ (accessed 16.04.17).
- 2.Mayer SV, Tesh RB, Vasilakis N. The emergence of arthropod-borne viral diseases: a global prospective on dengue, chikungunya and zika fevers. Acta Trop. 2017;166:155–163. doi: 10.1016/j.actatropica.2016.11.020. [DOI] [PMC free article] [PubMed] [Google Scholar]
- 3.Powers AM, et al. Re-emergence of Chikungunya and O’nyongnyong viruses: evidence for distinct geographical lineages and distant evolutionary relationships. J Gen Virol. 2000;81(2):471–479. doi: 10.1099/0022-1317-81-2-471. [DOI] [PubMed] [Google Scholar]
- 4.Volk SM, et al. Genome-scale phylogenetic analyses of chikungunya virus reveal independent emergences of recent epidemics and various evolutionary rates. J Virol. 2010;84(13):6497–6504. doi: 10.1128/JVI.01603-09. [DOI] [PMC free article] [PubMed] [Google Scholar]
- 5.Singhal C, Pundir CS, Narang J. A genosensor for detection of consensus DNA sequence of Dengue virus using ZnO/Pt-Pd nanocomposites. Biosens Bioelectron. 2017;97:75–82. doi: 10.1016/j.bios.2017.05.047. [DOI] [PubMed] [Google Scholar]
- 6.Beltrán-Silva, S. L., Chacón-Hernández, S. S., Moreno-Palacios, E. & Pereyra –Molina, J. A. Clinical and differential diagnosis: Dengue, chikungunya and Zika. Rev Med Hosp Gen (Méx), 10.1016/j.hgmx.2016.09.011 (2016).
- 7.Mccarthy MK, Morrison TE. Chronic Chikungunya virus musculoskeletal disease: what are the underlying mechanisms? Future Microbiol. 2016;11:331–334. doi: 10.2217/fmb.15.147. [DOI] [PMC free article] [PubMed] [Google Scholar]
- 8.Abdelnabi R, Neyts J, Delang L. Chikungunya virus infections: time to act, time to treat. Curr Opin Virol. 2017;24:25–30. doi: 10.1016/j.coviro.2017.03.016. [DOI] [PubMed] [Google Scholar]
- 9.Kaur, N. et al. Chikungunya outbreak in Delhi, India, 2016: A Report on the co-infection status and co-morbid conditions in patients. New Microbes New Infect, 10.1016/j.nmni.2017.07.007 (2017). [DOI] [PMC free article] [PubMed]
- 10.Lucarelli F, Marrazza G, Turner APF, Mascini M. Carbon and gold electrodes as electrochemical transducers for DNA hybridization sensors. Biosens Bioelectron. 2004;19:515–530. doi: 10.1016/S0956-5663(03)00256-2. [DOI] [PubMed] [Google Scholar]
- 11.Ricci F, Plaxco KW. E-DNA sensors for convenient, label free electrochemical detection of hybridization. Microchim Acta. 2008;163:149–155. doi: 10.1007/s00604-008-0015-4. [DOI] [Google Scholar]
- 12.Palchetti I, Mascini M. Electrochemical nanomaterial-based nucleic acid aptasensors. Anal Bioanal Chem. 2012;402:3103–3114. doi: 10.1007/s00216-012-5769-1. [DOI] [PubMed] [Google Scholar]
- 13.Tomassetti M, et al. A new surface plasmon resonance immunosensor for triazine pesticide determination in bovine milk: a comparison with conventional amperometric and screen-printed immunodevices. Sensors (Basel) 2015;15:10255–10270. doi: 10.3390/s150510255. [DOI] [PMC free article] [PubMed] [Google Scholar]
- 14.Shiddiky MJ, Park H, Shim YB. Direct analysis of trace phenolics with a microchip: in-channel sample preconcentration, separation, and electrochemical detection. Anal Chem. 2006;78:6809–6817. doi: 10.1021/ac0606002. [DOI] [PubMed] [Google Scholar]
- 15.Singhal C, et al. Impedimetric genosensor for detection of hepatitis C virus (HCV1) DNA using viral probe on methylene blue doped silica nanoparticles. Int J Biol Macmol. 2017;98:84–93. doi: 10.1016/j.ijbiomac.2017.01.093. [DOI] [PubMed] [Google Scholar]
- 16.Yamanaka K, Vestergaard MC, Tamiya E. Printable Electrochemical Biosensors: A Focus on Screen-Printed Electrodes and Their Application. Sensors (Basel) 2016;16:1761. doi: 10.3390/s16101761. [DOI] [PMC free article] [PubMed] [Google Scholar]
- 17.Lin CS, et al. An electrochemical biosensor for the sensitive detection of specific DNA based on a dual-enzyme assisted amplification. Electrochim Acta. 2014;147:785–790. doi: 10.1016/j.electacta.2014.10.092. [DOI] [Google Scholar]
- 18.Yola ML, Eren T, Atar N. A novel and sensitive electrochemical DNA biosensor based on Fe@Au nanoparticles decorated graphene oxide. Electrochim Acta. 2014;125:38–47. doi: 10.1016/j.electacta.2014.01.074. [DOI] [Google Scholar]
- 19.Wang Z, et al. Electrocatalytic oxidation of phytohormone salicylic acid at copper nanoparticles-modified gold electrode and its detection in oilseed rape infected with fungal pathogen Sclerotinia sclerotiorum. Talanta. 2010;80:1277–1281. doi: 10.1016/j.talanta.2009.09.023. [DOI] [PubMed] [Google Scholar]
- 20.Narang J, et al. Impedimetric genosensor for ultratrace detection of hepatitis B virus DNA in patient samples assisted by zeolites and MWCNT nano- composites. Biosens Bioelectron. 2016;86:566–574. doi: 10.1016/j.bios.2016.07.013. [DOI] [PubMed] [Google Scholar]
- 21.Gan X, Zhao H, Quan X. Two-dimensional MoS2: A promising building block for biosensors. Biosens Bioelectron. 2017;89:56–71. doi: 10.1016/j.bios.2016.03.042. [DOI] [PubMed] [Google Scholar]
- 22.Huang J, et al. A novel glucose sensor based on MoS2 nanosheet functionalized with Ni nanoparticles. Electrochim Acta. 2014;136:41–46. doi: 10.1016/j.electacta.2014.05.070. [DOI] [Google Scholar]
- 23.Zhou M, Lou XW, Xie Y. Two-dimensional nanosheets for photoelectrochemical water splitting: Possibilities and opportunities. Nano Today. 2013;8:598–618. doi: 10.1016/j.nantod.2013.12.002. [DOI] [Google Scholar]
- 24.Yan L, Shi H, Sui X, Deng Z, Gao L. MoS2-DNA and MoS2 based sensors. RSC Adv. 2017;7:23573. doi: 10.1039/C7RA02649H. [DOI] [Google Scholar]
- 25.Zhu CF, et al. Single-Layer MoS2-Based Nanoprobes for Homogeneous Detection of Biomolecules. J Am Chem Soc. 2013;135:5998. doi: 10.1021/ja4019572. [DOI] [PubMed] [Google Scholar]
- 26.Huang KJ, Liu YJ, Wang HB, Wang YY, Liu YM. Sub-femtomolar DNA detection based on layered molybdenum disulfide/multi-walled carbon nanotube composites, Au nanoparticle and enzyme multiple signal amplification. Biosens Bioelectron. 2014;55:195. doi: 10.1016/j.bios.2013.11.061. [DOI] [PubMed] [Google Scholar]
- 27.Erdem A, Kerman K, Meric B, Akarca US, Ozsoz M. Novel hybridization indicator methylene blue for the electrochemical detection of short DNA sequences related to the hepatitis B virus. Anal Chim Acta. 2000;422:139–149. doi: 10.1016/S0003-2670(00)01058-8. [DOI] [Google Scholar]
- 28.Han S, et al. Superior Adsorption and Regenerable Dye Adsorbent Based on Flower- Like Molybdenum Disulfide Nanostructure. Sci Rep. 2017;7:43599. doi: 10.1038/srep43599. [DOI] [PMC free article] [PubMed] [Google Scholar]
- 29.Mak KF, Lee C, Hone J, Shan J, Heinz TF. Atomically Thin MoS2: A New Direct-Gap Semiconductor. Phy Rev Lett. 2010;105:136805. doi: 10.1103/PhysRevLett.105.136805. [DOI] [PubMed] [Google Scholar]
- 30.Lee C, et al. Anomalous lattice vibrations of single-and few-layer MoS2. ACS nano. 2010;4:2695–2700. doi: 10.1021/nn1003937. [DOI] [PubMed] [Google Scholar]
- 31.Raveendran M, Andrade AFB, Gonzalez-Rodriguez J. Selective and Sensitive Electrochemical DNA Biosensor for the Detection of Bacillus anthracis. Int J Electrochem Sci. 2016;11:763–776. [Google Scholar]
- 32.Bard, A. J. & Faulkner, L. R. Electrochemical methods, 2nd ed, Wiley, New York (2001).
- 33.Wedler, G., Lehrbuch der Physikalischen Chemie, 2nd edn. Verlag Chemie, Weinheim (1985).
- 34.Chen D, Zeng Z, Zeng Y, Zhang F, Wang M. Removal of methylene blue and mechanism on magnetic γ-Fe2O3/SiO2 nanocomposite from aqueous solution. Water Resources and Industry. 2016;15:1–13. doi: 10.1016/j.wri.2016.05.003. [DOI] [Google Scholar]
- 35.Tak M, Gupta V, Tomar M. Flower-like ZnO nanostructure based electrochemical DNA biosensor for bacterial meningitis detection. Biosens Bioelectron. 2014;59:200–207. doi: 10.1016/j.bios.2014.03.036. [DOI] [PubMed] [Google Scholar]
- 36.Tyagi M, Tomar M, Gupta V. NiO nanoparticle-based urea biosensor. Biosens Bioelectron. 2013;41:110. doi: 10.1016/j.bios.2012.07.062. [DOI] [PubMed] [Google Scholar]
- 37.Shi GF, et al. An electrochemiluminescence aptasensor based on flowerlike CdS–MoS2 composites and DNAzyme for detection of immunoglobulin E. Sens Actuators B Chem. 2015;220:340. doi: 10.1016/j.snb.2015.05.079. [DOI] [Google Scholar]
- 38.Wang XX, et al. A label-free ultrasensitive electrochemical DNA sensor based on thin-layer MoS2 nanosheets with high electrochemical activity. Biosens Bioelectron. 2015;64:386. doi: 10.1016/j.bios.2014.09.030. [DOI] [PubMed] [Google Scholar]
- 39.Wang TY, et al. Direct Detection of DNA below ppb Level Based on Thionin-Functionalized Layered MoS2 Electrochemical Sensors. Anal Chem. 2014;86:12064. doi: 10.1021/ac5027786. [DOI] [PubMed] [Google Scholar]
- 40.Huang KJ, Liu YJ, Wang HB, Wang YY, Liu YM. Sub-femtomolar DNA detection based on layered molybdenum disulfide/multi-walled carbon nanotube composites, Au nanoparticle and enzyme multiple signal amplification. Biosens Bioelectron. 2014;55:195. doi: 10.1016/j.bios.2013.11.061. [DOI] [PubMed] [Google Scholar]
- 41.Liu YM, et al. An electrochemiluminescence aptasensor based on CdSe/ZnS functionalized MoS2 and enzymatic biocatalytic precipitation for sensitive detection of immunoglobulin E. Sens Actuators B Chem. 2016;232:538. doi: 10.1016/j.snb.2016.03.165. [DOI] [Google Scholar]
- 42.Su S, et al. Dual-Target Electrochemical Biosensing Based on DNA Structural Switching on Gold Nanoparticle-Decorated MoS2 Nanosheets. ACS Appl Mater Interfaces. 2016;8:6826. doi: 10.1021/acsami.5b12833. [DOI] [PubMed] [Google Scholar]
- 43.Loo AH, Bonanni A, Ambrosi A, Pumera M. Molybdenum disulfide (MoS2) nanoflakes as inherently electroactive labels for DNA hybridization detection. Nanoscale. 2014;6:11971. doi: 10.1039/C4NR03795B. [DOI] [PubMed] [Google Scholar]
- 44.Chu YL, et al. Highly sensitive electrochemical detection of circulating tumor DNA based on thin-layer MoS2/graphene composites. RSC Adv. 2016;6:22673. doi: 10.1039/C5RA27625J. [DOI] [Google Scholar]
- 45.Zhou GH, et al. Ultrasensitive Mercury Ion Detection Using DNA-Functionalized Molybdenum Disulfide Nanosheet/Gold Nanoparticle Hybrid Field-Effect Transistor Device. ACS Sens. 2016;1:295. doi: 10.1021/acssensors.5b00241. [DOI] [Google Scholar]
- 46.Rahman MS, et al. Modeling of a highly sensitive MoS2-Graphene hybrid based fiber optic SPR biosensor for sensing DNA hybridization. Optik. 2017;140:989–997. doi: 10.1016/j.ijleo.2017.05.001. [DOI] [Google Scholar]
- 47.Smolyanitsky A, Yakobson BI, Wassenaar TA, Paulechka E, Kroenlein K. A MoS2-Based Capacitive Displacement Sensor for DNA Sequencing. ACS Nano. 2016;10(9):9009–9016. doi: 10.1021/acsnano.6b05274. [DOI] [PubMed] [Google Scholar]
- 48.Yang D, Tayebi M, Huang Y, Yang HY, Ai Y. A Microfluidic DNA Sensor Based on Three-Dimensional (3D) Hierarchical MoS2/Carbon Nanotube Nanocomposites. Sensors (Basel) 2016;16:1911. doi: 10.3390/s16111911. [DOI] [PMC free article] [PubMed] [Google Scholar]
- 49.Jin K, Xie L, Tian Y, Liu D. Au-Modified Monolayer MoS2 Sensor for DNA Detection. J Phys Chem C. 2016;120(20):11204–11209. doi: 10.1021/acs.jpcc.6b01193. [DOI] [Google Scholar]
- 50.Park HY, et al. M-DNA/Transition Metal Dichalcogenide Hybrid Structure-based Bio-FET sensor with Ultra-high Sensitivity. Sci Rep. 2016;6:35733. doi: 10.1038/srep35733. [DOI] [PMC free article] [PubMed] [Google Scholar]
- 51.Geldert A, et al. Enhancing the Sensing Specificity of a MoS2 Nanosheet-Based FRET Aptasensor Using a Surface Blocking Strategy. Analyst. 2017;142(14):2570–2577. doi: 10.1039/C7AN00640C. [DOI] [PubMed] [Google Scholar]
- 52.Sun X, et al. WS2 and MoS2 biosensing platforms using peptides as probe biomolecules. Sci Rep. 2017;7:10290. doi: 10.1038/s41598-017-10221-4. [DOI] [PMC free article] [PubMed] [Google Scholar]
Associated Data
This section collects any data citations, data availability statements, or supplementary materials included in this article.


