

Abstract
The rapid and wide-reaching expansion of internet access and digital technologies offers epidemiologists numerous opportunities to study health behaviors. One particularly promising new data collection strategy is the use of Facebook’s advertising platform in conjunction with Web-based surveys. Our research team at the Center for Technology and Behavioral Health has used this quick and cost-efficient method to recruit large samples and address unique scientific questions related to cannabis use. In conducting this research, we have gleaned several insights for using this sampling method effectively and have begun to document the characteristics of the resulting data. We believe this information could be useful to other researchers attempting to study cannabis use or, potentially, other health behaviors. The first aim of this paper is to describe case examples of procedures for using Facebook as a survey sampling method for studying cannabis use. We then present several distinctive features of the data produced using this method. Finally, we discuss the utility of this sampling method for addressing specific types of epidemiological research questions. Overall, we believe that sampling with Facebook advertisements and Web surveys is best conceptualized as a targeted, nonprobability-based method for oversampling cannabis users across the United States.
Keywords: epidemiology, cross-sectional studies, sampling studies, social media, data collection, cannabis, surveys
Introduction
Surveys have been a methodological cornerstone of epidemiology since the inception of the field. However, the manner in which epidemiologists conduct surveys has undergone several paradigm shifts in tandem with advances in mass communication and information dissemination [1]. Initially, data collection was limited to local in-person site visits [1,2]. Over time, new modes of communication, such as mailed questionnaires and random digital dialing [3], expanded epidemiologists’ methodological toolkit [1]. Once the internet began to function as a principal means of communication, it too was recognized for its potential utility as a data collection method [1,4,5]—particularly for substance use data [6]. Historically, collecting data on hidden and stigmatized populations such as substance users had been exceptionally difficult. Early pioneering work demonstrated that it was possible to use the internet to study these populations [7,8].
Today, approximately 3.5 billion people around the world have internet access [9], and 2.3 billion people own a smartphone [10], allowing them to access the internet at any time of day in almost any location. Approximately 2.5 billion people [11] now use social media and networking sites such as Facebook and Twitter, primarily on their smartphones [12,13], for an average of 1 to 2 hours per day [14,15]. In parallel with this increase in internet and social media use, researchers have devoted considerable attention to conducting Web-based studies of health behaviors. In doing so, they have developed various Web survey- and social media-based data collection methods [16-24]. Of the social media platforms now commonly used for health research purposes, Facebook, in particular, has emerged as a useful and low-cost means of recruiting participants [25] from hard-to-reach populations [16]. At present, researchers have used Facebook to disseminate Web surveys to study a range of diseases and health behaviors such as HIV [26]; vaccine uptake [27,28]; mammographies [29]; contraception [30]; several mental health disorders [31-33]; prescription medication misuse [34]; and use of alcohol [35], tobacco [36], e-cigarettes [37], and cannabis [38-42]. Such studies are part of a growing subdiscipline of epidemiology—often termed Infodemiology [43], Digital Epidemiology [44], or E-Epidemiology [45]—that is characterized by the overlap between traditional epidemiological research goals and the utilization of new digital infrastructures.
Facebook-based Web surveys are well suited for addressing questions that arise from sociocultural changes because they allow for the rapid study of behaviors on a population-level scale. One example of such a sociocultural change is the shifting legal landscape of cannabis in the United States. More recreational and medical legal cannabis laws (LCL) have been enacted since 2010 than were enacted from 1996 to 2009 (LCL is used here to differentiate such laws from those focused on criminalizing and prohibiting cannabis) [46], and several new concerns—including the expansion of cannabis product diversity [47-50]—have emerged as a result. Many of the questions brought about by cannabis legalization represent excellent scientific targets for Facebook-based sampling methods.
At the Center for Technology and Behavioral Health at Dartmouth College, we have been leveraging the Facebook Business advertising platform to conduct a series of Web surveys to study questions concerning patterns of use of new methods of cannabis administration (eg, vaping and edibles) and relationships between cannabis use and psychological constructs such as anxiety, pain, and readiness to reduce or stop cannabis use. In the process of conducting these surveys, we have learned several lessons about advertising procedures that minimize costs and maximize survey participation. In addition, given the need to determine strengths and limitations of social media-based data collection [51], we have aggregated and examined the data from several of our surveys to identify the unique characteristics of our sampling method.
This paper provides an overview of our procedures and lessons learned using Facebook advertisements and Web surveys as a method to study cannabis use, our findings regarding the unique characteristics of the cannabis use data produced by this method, and how the characteristics of the resulting data clarify the types of research questions best suited for study with this sampling method.
Using the Facebook Advertising Platform
Targeting Parameters
The Facebook advertising platform provides researchers with access to a large sample pool and a wide range of demographic, behavioral, and psychographic targeting parameters. These parameters can be tailored to send customized advertisements (eg, recruitment messages for a Web survey) to the phone and computer screens of specific populations of interest [31,52,53]. This sampling capability is possible because of the vast amount of information Facebook collects about each user’s Web-based behavior.
General targeting parameter categories include any age range above 13 years, gender, education (eg, type of educational degree), relationship status (eg, marital status), financial status (eg, income level), geographic location, multicultural affinity (eg, African American, Hispanic, Asian), generation (eg, baby boomers), employment (eg, job title), household composition (eg, new parents), and Web-based purchase behaviors (eg, pain relief medications, alcoholic beverages).
Our research group has been interested in studying cannabis use. However, Facebook does not provide targeting parameter categories such as cannabis user. Thus, in our advertising strategy, we use targeting parameters that we believe are correlated with our behavior of interest (cannabis use), such as notable individuals associated with cannabis use (eg, Bob Marley, Ed Rosenthal), cannabis-related magazines (eg, Cannabis Culture, High Times), organizations (eg, Americans for Safe Access, NORML, Weedmaps), and behaviors or topics (eg, “smoking weed”,“legalize marijuana”).
Algorithm Learning and Optimization
Facebook’s machine learning–based algorithms are designed to present users with content (including advertisements) relevant to their personality or lifestyle [54-56]. However, the algorithms used to distribute advertisements appear to require a sufficient amount of time to complete a learning phase before they become effective. During this learning phase, enough data must be accumulated to determine which members of the target population have the highest probability of engaging with the advertisement [54-56]. Although we cannot verify that such learning processes are taking place or how they are programmed, our experiences using the Facebook advertisement system to date have been congruent with this literature. Currently, when we use Facebook advertisements to reach cannabis users, we begin advertising with a low spending limit of US $10 per day for 48 to 72 hours, which we believe facilitates algorithm learning. After this 48- to 72-hour time frame, we have consistently seen a notable increase in the rate of clicks. At that point, we have increased the amount of money spent to anywhere between US $30 and US $60 per day. Figure 1 displays the Facebook advertisement click results from our most recently published survey [57]. In this study, we preprogrammed advertisements to be displayed for 6 days (September 3-8, 2016). As is evident from Figure 1, we received few advertisement clicks during the first 24 hours of advertising (September 3). However, after 72 hours, the advertisement was receiving over 500 clicks per day. Of note, Facebook paces advertisement spending to remain within-budget over the course of the entire advertising time frame [58]. We believe this is why the number of clicks per day begins to decline toward the end of the advertising time frame (ie, September 8 in Figure 1).
Figure 1.
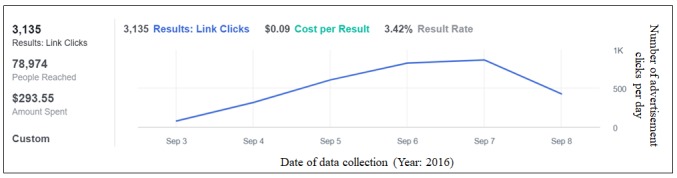
Click and cost results from a recent cannabis-targeted Facebook advertising campaign.
It is important to note that this specific 48- to 72-hour time frame may not apply to other social media advertising platforms or even to Facebook in the future. However, we believe that the principle for effectively using machine learning–based advertising demonstrated here will still hold.
Advertisement Imagery and Data Collection
To sample cannabis users in these studies, we direct Facebook recruitment advertisements (Figure 2) to individuals who live in the United States and are affiliated with cannabis-related targeting parameters discussed previously. In the advertisements, we use images and wording that are salient to the population we want to study. This means our advertisements frequently display cannabis leaves and use the words cannabis or marijuana in the text. The advertisements contain the URL link to our anonymous Qualtrics-hosted survey. Individuals who click the advertisement are redirected to the consent page of the survey. Individuals are excluded if they (1) do not provide consent, (2) do not meet study-specific age requirements (eg, aged above 18 years), or (3) self-report never having used cannabis. We use internal data checks to confirm the veracity of the data. For example, individuals who report their age of initiation of cannabis as being older than their current age are excluded from analyses. We disable internet protocol (IP) address collection to maintain participant anonymity and describe this procedure and its implications clearly on the consent page. We enable Qualtrics data quality features that use cookies to prevent individuals from responding multiple times. We also use the captcha verification feature to prevent responses from internet bots. We have not used any survey completion compensation or incentives in these studies.
Figure 2.
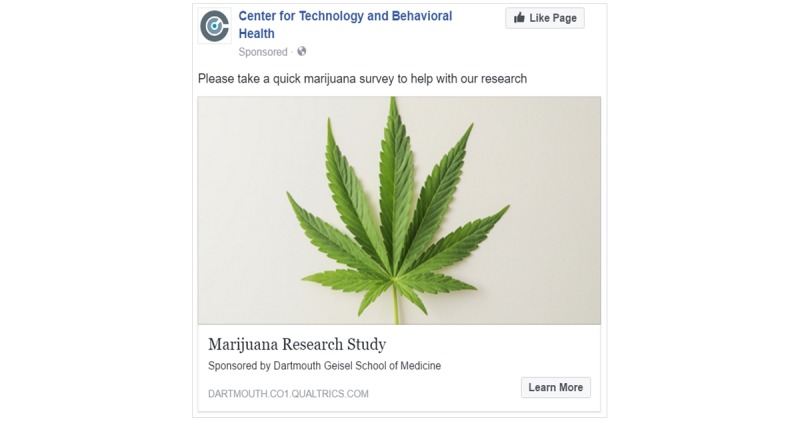
Sample advertisement distributed via Facebook advertising.
Iterative Questionnaire Modifications
In addition to using the sampling strategies discussed previously, we have also iteratively modified the structure of our questionnaires in several ways. Note that our team has not attempted to evaluate the isolated impact of each of these modifications systematically, and thus we cannot comment on causal relationships. However, based on our experiences to date, we believe that the following questionnaire modifications have helped increase the likelihood of participation and completion: (1) using language at the top of the consent page that highlights the changing landscape of US cannabis legalization and the need for public contribution to better understand cannabis; (2) using the term cannabis rather than marijuana; (3) using patently objective language about cannabis on the consent page (ie, explaining that our research team’s primary aim is to collect accurate data—not promote or demonize cannabis); (4) conveying to participants, at the top of the consent page, that the questionnaire will only take 10 to 15 min to complete; (5) conveying to participants that their IP addresses will not be tracked; (6) shortening the overall length of the questionnaire; (7) using images of cannabis and methods of cannabis administration throughout the questionnaire; (8) ensuring that the first few questions that participants see immediately after providing consent are interesting to them (ie, “Have you ever used cannabis?”); (9) distributing uninteresting questions (eg, demographic questions) throughout the questionnaire; and (10) providing an open-ended, free-response item that asks participants for their thoughts about both positive and negative experiences with cannabis.
We believe that our surveys have become increasingly well received by the Facebook community as we have made these changes over time. For example, in our second survey—conducted over 28 days for US $809—our advertisements received 107 likes (ie, a positive reaction to the advertisement), 32 comments, and 27 shares (ie, an individual sending the advertisement to one of their friends via Facebook). In our fourth survey—conducted over 6 days for US $293—we received 354 likes, 41 comments, and 139 shares. Content analysis of the reactions and comments to the various surveys over time is beyond the scope of this paper, but we believe that the patterns observed generally show increased acceptance and willingness to engage and participate in these types of survey studies.
Cannabis-Related Findings From Facebook Advertising–Generated Survey Data
We have conducted a series of Web surveys using these methods, which have provided insights into patterns of cannabis use across the United States. Below we present data from 6 of those surveys, 3 of which have been published [57,59,60]. Table 1 provides an overview of the recruitment results for each of the surveys.
Table 1.
Recruitment results from 6 cannabis use Web surveys disseminated using Facebook advertisements (ads).
| Surveya | Ad delivery time frame | Total ad cost ($ USD) | No. of people who saw ads | No. of ad clicks | Sample sizeb | Ad images | Demographics and cannabis use patterns of recruited sample | |||
|
|
|
|
|
|
|
|
Age, mean (SD) | Male, n (%) |
White, n (%) |
Current usec, n (%) |
| Survey 1d | 43 days | 800 | 168,894 | 3708 | 2838 | Cannabis leaf; College logo | 32 (16) | 2391 (84.24) | 2048 (72.16) | 2333 (82.20) |
| Survey 2 | 28 days | 809 | 231,400 | 3932 | 933 | Multiplee | 44 (18) | 758 (81.2) | 794 (85.1) | 724 (77.6) |
| Survey 3 | 20 days | 350 | 126,945 | 5480 | 2630 | Cannabis leaf | 16 (1) | 1201 (45.67) | 2067 (78.60) | 2185 (83.08) |
| Survey 4 | 6 days | 293 | 78,974 | 3135 | 1813 | Cannabis leaf | 48 (13) | 1386 (76.48) | 1608 (88.70) | 1540 (85.94) |
| Survey 5d | 9 days | 402 | 68,525 | 2599 | 1212 | Cannabis leaf | 28 (11) | 784 (64.69) | 1029 (84.90) | 1132 (93.40) |
| Survey 6d | 7 days | 377 | 96,096 | 5612 | 2972 | Cannabis leaf; Cannabis plant | 35 (10) | 1815 (61.07) | 2653 (89.27) | 2549 (85.77) |
aEligibility criteria for all surveys: (1) lifetime cannabis user, (2) age 18 years or older, (3) provided consent/assent, and (4) currently living in the United States. Exception for survey 3 in which the age eligibility criteria was 14 to 18 years.
bRespondents who (1) met eligibility criteria, (2) passed data-quality checks, and (3) completed the survey.
c“Current use” indicates individuals who used cannabis at least once in the past 30 days.
dParticipants permitted to skip questions. Reported sample sizes may vary depending on the variable analyzed.
eAdvertisement images included cannabis leaf, cannabis plant material, Dartmouth College logo, methods of use (eg, joints), depictions of smoking behavior, and smoke clouds.
In our initial study, we used Facebook advertising to recruit adults (N=2910) for a survey on cannabis vaping and edible use. We found that over half (61.27%, 1783/2910) of the users had tried vaping, but only 12.44% (362/2910) of the sample preferred vaping over other methods [61], and the likelihood of vaping and edible use was positively associated with the number of within-state cannabis dispensaries per capita [59]. A second study replicated these findings with cannabis users (N=933). Again, the majority (55.2%, 515/933) had tried vaping, and of those, 27.2% (140/515) had vaped while driving, 34.2% (176/515) had vaped in public, and 14.2% (73/515) had vaped at work (A J Budney, unpublished data, July 2016). In a third study, we collected cannabis use survey data from younger cannabis users (aged 14-18 years; N=2630) and replicated our previous adult findings. We observed the same relationship between dispensaries and vaping and edible use. We also found that home cultivation provisions of legal cannabis laws were uniquely related to a greater likelihood of having used edibles [60]. In a follow-up survey of adults, we collected responses (N=1813) to explore the relationship between provisions of legal cannabis laws (home cultivation and dispensaries) and cannabis edible procurement behaviors. We determined that those who live in states that permit home cultivation tend to make their own cannabis edibles, whereas those who live in states with cannabis dispensaries primarily purchase their edibles [57]. In another study, cannabis users (N=1212) participated in a survey assessing the frequency of cannabis use and thoughts about decreasing their use. A sizeable portion (19.39%, 235/1212) reported having “been concerned about their cannabis use,” and, among these individuals, 75.32% (177/235) had recently thought about reducing their use (A J Budney, unpublished data, February 2017). In another study, cannabis users (n=3561) participated in a survey on frequency of cannabis use and selected psychological processes. Indirect effects of anxiety sensitivity on past 30-day heavy cannabis use were mediated by coping-related motives for cannabis use (A A Knapp, unpublished data, November 2016).
This Facebook-based Web survey approach can be particularly useful for expeditiously conducting studies that help clarify observations and questions that arise from prior survey studies. For example, the primary analyses of the youth survey discussed previously revealed that state-level permission of cannabis home cultivation was statistically related only to an elevated likelihood of edible use, whereas state-level permission of cannabis dispensaries was related to elevated likelihoods of both lifetime vaping and edible use. After developing a hypothesis to explain this observation, we conducted a new survey 3 months later to better understand these relationships. These data replicated the results from the prior study and further demonstrated that those who grow cannabis were more likely to make edibles at home by economizing low-tetrahydrocannabinol (THC) leftover parts of the cannabis plant. However, those who lived in states with dispensaries were more likely to purchase cannabis edibles [57].
Determining and Interpreting the Idiosyncrasies of Facebook Advertising–Based Cannabis Use Data
As this line of research expands, it is crucial to understand both the strengths and limitations of this Facebook survey sampling method. Epidemiologists use a variety of sampling methods to answer different types of research questions [62-65]. For example, accurately estimating the prevalence of lifetime cannabis use in the United States requires probability-based methods, but understanding the unique cannabis use disorder treatment needs of various population subgroups requires nonprobability-based sampling methods [66]. The unique properties of Facebook sampling for studying cannabis use are largely unclear at this point — making it difficult to determine which types of research questions are most effectively addressed with this method. To begin to fill this gap, we have conducted several secondary analyses of our Facebook-based data. On the basis of our understanding that Facebook advertising was originally designed to help businesses contact their specific niche audience, we hypothesized that Facebook advertisements would produce data similar to traditional nonrandom epidemiological sampling methods, thus producing data on a relatively homogenous subpopulation.
Patterns of Cannabis Use
In our initial surveys, we were interested in studying patterns of use of novel methods of cannabis administration. We assumed that current and regular cannabis users would be the most likely to have used these methods of administration, and therefore, we attempted to oversample this subgroup by using the cannabis-centric sampling targets (eg, Medical Marijuana or High Times Magazine) discussed previously. To confirm that our sampling method did indeed oversample this subgroup of cannabis users, we compared our data with cannabis use data from the probability-based National Survey on Drug Use and Health (NSDUH). The NSDUH can be used to generate prevalence estimates of multiple subtypes of cannabis users in the United States. Figure 3 displays our Facebook-based data combined across several of our published and unpublished adult (aged above 18 years) surveys (N=10,427; includes individuals who did not complete an entire survey) in relation to data from the 2015 NSDUH [67]. The left panel of Figure 3 shows that samples of lifetime cannabis users from our surveys comprised proportionally more current (ie, used at least one time in the past 30 days) users compared with lifetime users in the NSDUH. In addition, the right panel in Figure 3 shows that our samples of current users (n=8886) comprised proportionally more daily cannabis users compared with current users in the NSDUH [59,60,68]. These findings support the notion that Facebook sampling can effectively obtain data from subgroups of lifetime cannabis users who are currently using cannabis on a regular basis.
Figure 3.
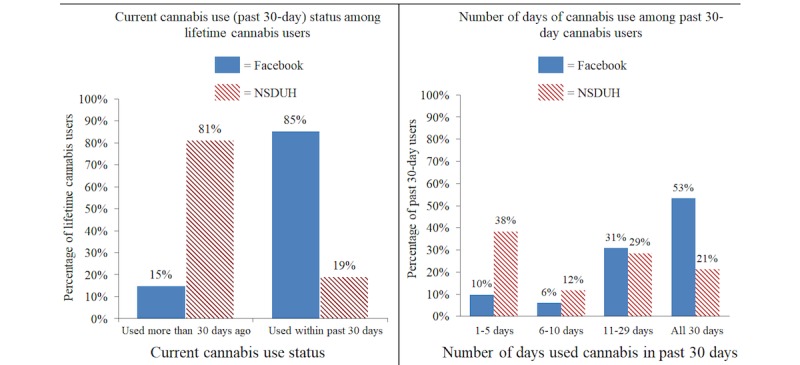
Comparisons between Facebook-generated cannabis use data and cannabis use data from the 2015 National Survey on Drug Use and Health (NSDUH).
Similar comparative analyses by other researchers support this finding. For example, Barratt et al analyzed cannabis use data from the Global Drug Survey (a self-selected Web survey) in relation to several national probability-based surveys (including NSDUH). Their results demonstrate that Web-based purposive recruitment (including the use of Facebook) can generate samples in which current cannabis users are over-represented [69].
Geographic Representation
A second consideration is the possibility of a selection bias induced by state residence. Individuals living in medical or recreational LCL states may have a greater (or lesser) propensity to take our surveys than individuals from states that have not legalized cannabis use. To determine if this was occurring, we compared several of our Facebook-based datasets (both published and unpublished) with US census data [70]. As demonstrated in Figure 4, Facebook consistently generates samples in which the proportion of survey respondents from each US state matches the proportion of the total US population represented in each US state. Pearson and Spearman correlation coefficients for each relationship displayed in Figure 4 range from .82 to .95 (P<.001). Thus, the results from these data are not necessarily biased by disproportionate geographic representation.
Figure 4.
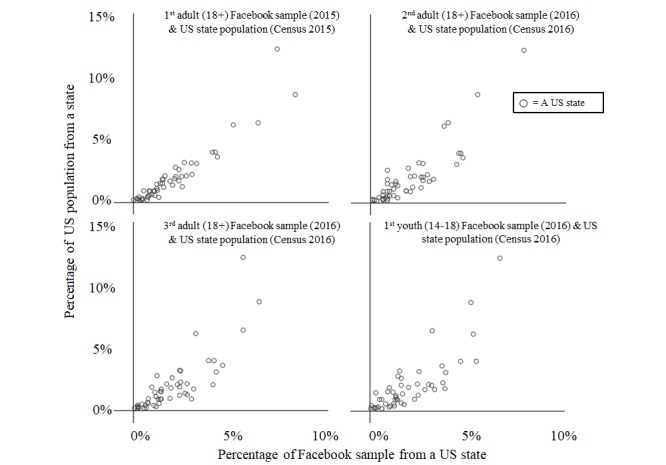
Percentage of US population in each state versus percentage of Facebook sample in each state.
These two characteristics of cannabis use data collected using Facebook advertisements and Web surveys provide some indication as to the types of research questions this method can be useful for studying. Using targeted interests (eg, Medical Marijuana) to recruit participants introduces a selection bias, and our comparisons to NSDUH data suggest that this selection bias generates samples that over-represent current and regular cannabis users. However, our comparisons to the US census indicate that these data are not provincial—Facebook samples individuals from across the United States. Thus, this sampling method seems better suited for research questions aimed at understanding how cannabis legalization may affect current and frequent cannabis users rather than how it will affect inexperienced or infrequent cannabis users.
A strength of this sampling method is that researchers can collect enough data to address their research question after only a few days of data collection. This advantage, however, begs questions related to the potential impact of natural temporal variability on the data and results. For example, how similar are data sampled at the beginning of the week to data sampled at the end of the week? Without answers to this type of question, it is difficult to know the extent to which we should be concerned about temporally related confounding. In our analyses, we have begun preliminary exploration of potential fluctuations in the types of cannabis users who take our surveys on particular days of the week. Table 2 displays demographic and cannabis use characteristics of participants from our recently published youth dataset [60] aggregated by the day of the week that the data were sampled. The resulting profile is relatively stable across days of the week for many variables, but significant variability does occur. Looking at the gender variable in Table 2, it is clear that the distribution of responses across categories within a variable can change multiple times during the week. In addition, abrupt changes in the absolute difference in proportions between categories of a variable can occur (eg, the difference between male and female representation on Saturdays). Given that the sampling strategy remained the same for the duration of the study, it is unclear why such variability occurred and why some variables—such as gender in this particular instance—might be affected more than others. Due to the current degree of uncertainty surrounding this methodological issue, we suggest collecting data for at least a full week to capture any potential temporally related variability in the data. We also suggest that relationships among sample size, effect size, number of statistical tests conducted, and P values be considered as a whole to determine whether the observed fluctuations warrant statistical adjustment.
Table 2.
Demographic and cannabis use–related data sampled via Facebook advertising according to the day of the week data were collected.
| Variable | Day of the week data were collected (N=2630) | P valuea | |||||||
|
|
Mondayb (n=435) | Tuesdayb (n=408) | Wednesdayb (n=342) | Thursdayc (n=257) | Fridayb (n=417) | Saturdayb (n=365) | Sundayb (n=406) |
|
|
| Education, n (%)d | .11 | ||||||||
| 6th grade | 0 | 0 | 0 | 0 | 1 (0.2) | 2 (0.5) | 1 (0.2) | ||
| 7th grade | 8 (1.8) | 7 (1.7) | 3 (0.9) | 4 (1.6) | 6 (1.4) | 5 (1.4) | 2 (0.5) | ||
| 8th grade | 34 (7.8) | 31 (7.6) | 39 (11.4) | 16 (6.2) | 48 (11.5) | 46 (12.6) | 43 (10.6) | ||
| 9th grade | 89 (20.5) | 75 (18.4) | 67 (19.6) | 51 (19.8) | 84 (20.1) | 89 (24.4) | 87 (21.4) | ||
| 10th grade | 135 (31.0) | 112 (27.5) | 102 (29.8) | 73 (28.4) | 107 (25.7) | 100 (27.4) | 109 (26.8) | ||
| 11th grade | 108 (24.8) | 108 (26.5) | 68 (19.9) | 71 (27.6) | 111 (26.6) | 81 (22.2) | 110 (27.1) | ||
| 12th grade | 40 (9.2) | 50 (12.3) | 41 (12.0) | 27 (10.5) | 45 (10.8) | 32 (8.8) | 44 (10.8) | ||
| Started college | 21 (4.8) | 25 (6.1) | 22 (6.4) | 15 (5.8) | 15 (3.6) | 10 (2.7) | 10 (2.5) | ||
| Race, n (%)d | .38 | ||||||||
| African American | 24 (5.5) | 12 (2.9) | 12 (3.5) | 8 (3.1) | 9 (2.2) | 11 (3.0) | 13 (3.2) | ||
| Native American | 13 (3.0) | 15 (3.7) | 7 (2.0) | 9 (3.5) | 16 (3.8) | 11 (3.0) | 7 (1.7) | ||
| Asian | 3 (0.7) | 5 (1.2) | 5 (1.5) | 4 (1.6) | 7 (1.7) | 3 (0.8) | 5 (1.2) | ||
| White | 332 (76.3) | 311 (76.2) | 274 (80.1) | 209 (81.3) | 341 (81.8) | 281 (77.0) | 319 (78.6) | ||
| Pacific Islander | 2 (0.5) | 3 (0.7) | 0 (0.0) | 1 (0.4) | 1 (0.2) | 1 (0.3) | 1 (0.2) | ||
| Hispanic | 61 (14.0) | 62 (15.2) | 44 (12.9) | 26 (10.1) | 43 (10.3) | 58 (15.9) | 61 (15.0) | ||
| Gender, n (%) | <.001 | ||||||||
| Male | 182 (41.8) | 197 (48.3) | 178 (52.0) | 150 (58.4) | 191 (45.8) | 129 (35.3) | 174 (42.9) | ||
| Female | 233 (53.6) | 200 (49.0) | 155 (45.3) | 99 (38.5) | 209 (50.1) | 223 (61.1) | 218 (53.7) | ||
| Other | 20 (4.6) | 11 (2.7) | 9 (2.6) | 8 (3.1) | 17 (4.1) | 13 (3.6) | 14 (3.4) | ||
| Living situation, n (%) | .29 | ||||||||
| Lives with neither parent | 49 (11.3) | 43 (10.5) | 37 (10.8) | 29 (11.3) | 44 (10.6) | 32 (8.8) | 35 (8.6) | ||
| Lives with both parents | 185 (42.5) | 187 (45.8) | 146 (42.7) | 129 (50.2) | 176 (42.2) | 137 (37.5) | 181 (44.6) | ||
| Lives with mother only | 153 (35.2) | 132 (32.4) | 124 (36.3) | 74 (28.8) | 155 (37.2) | 158 (43.3) | 147 (36.2) | ||
| Lives with father only | 48 (11.0) | 46 (11.3) | 35 (10.2) | 25 (9.7) | 42 (10.1) | 38 (10.4) | 43 (10.6) | ||
| Preferred method, n (%) | .34 | ||||||||
| Smoke cannabis | 231 (83.4) | 236 (81.1) | 207 (85.2) | 162 (85.3) | 231 (83.7) | 202 (86.7) | 229 (84.8) | ||
| Vaporize cannabis | 22 (7.9) | 21 (7.2) | 17 (7.0) | 17 (8.9) | 17 (6.2) | 11 (4.7) | 11 (4.1) | ||
| Eat cannabis | 24 (8.7) | 34 (11.7) | 19 (7.8) | 11 (5.8) | 28 (10.1) | 20 (8.6) | 30 (11.1) | ||
| Lifetime days smoked cannabis, n (%)e | .86 | ||||||||
| Once | 10 (2.3) | 10 (2.5) | 6 (1.8) | 4 (1.6) | 10 (2.4) | 10 (2.7) | 7 (1.7) | ||
| 2-5 days | 28 (6.5) | 24 (5.9) | 24 (7.1) | 12 (4.7) | 33 (8.0) | 26 (7.1) | 27 (6.7) | ||
| 6-10 days | 15 (3.5) | 24 (5.9) | 11 (3.3) | 17 (6.6) | 22 (5.3) | 19 (5.2) | 26 (6.4) | ||
| 11-30 days | 39 (9.0) | 43 (10.6) | 45 (13.3) | 22 (8.6) | 49 (11.8) | 36 (9.9) | 38 (9.4) | ||
| 31-100 days | 68 (15.7) | 48 (11.8) | 43 (12.7) | 38 (14.8) | 55 (13.3) | 51 (14.0) | 50 (12.4) | ||
| 101-365 days | 88 (20.4) | 93 (22.9) | 76 (22.5) | 66 (25.7) | 86 (20.7) | 81 (22.3) | 101 (25.0) | ||
| >365 days | 184 (42.6) | 164 (40.4) | 133 (39.3) | 98 (38.1) | 160 (38.6) | 141 (38.7) | 155 (38.4) | ||
aChi-squared tests used to calculate P values.
bData collected on the same weekday but during 2 separate weeks. For example, Mondayb indicates data collected on Mondays from 2 different weeks.
cData collected on a weekday on a single week. For example, Thursdayb indicates data collected on a Thursday from a single week of data collection.
dSixth and 7th grade combined in education variable, and Asian and Pacific Islander combined in race to conduct chi-squared tests.
en=14 respondents never smoked cannabis (ie, n=14 had only ever used an alternative method of administration such as vaping or edible).
Additional Considerations for Facebook Sampling
Several other methodological considerations warrant comment. Like other sampling methods, Facebook advertising is subject to both noncoverage and nonresponse biases [71]. There are cannabis users living in the United States who do not have Facebook or have Facebook but do not engage in cannabis-related activity on Facebook (and thus cannot be targeted by our advertising). Other cannabis users may not wish to engage in research studies even if they are presented with the opportunity to do so (ie, they see the advertisement on their screen but do not click it). Although it is difficult to test for systematic differences between those who do and do not click on an advertisement when given a chance, the cannabis users who do click advertisements and take surveys provide generally reliable and diagnostically valid cannabis use data [72].
Discussion and Future Directions
The utilization of social media–based recruitment for conducting cannabis epidemiology research has only begun to scratch the surface of its potential. Our experiences in conducting this research have revealed several insights about this method and the resulting data. First, it would appear prudent to operate under the assumption that Facebook advertising algorithms require a sufficient amount of time to learn about a target population to effectively disseminate advertisements. Thus, we have found it useful to wait at least 48 to 72 hours before evaluating the effectiveness of a Facebook advertising campaign. Second, Facebook advertising methods that recruit for Web-based surveys on cannabis use can quickly and inexpensively generate samples of current, regular cannabis users across the United States. Given the speed of data collection, we have also found that this sampling method is useful for timely clarification of hypotheses, via the expeditious conduct of follow-up surveys. Overall, we encourage the conceptualization of Web survey dissemination via Facebook advertising as a new type of nonprobability-based targeted sampling method. Cannabis researchers can include Facebook as part of their armamentarium of sampling methods. It can be considered as an alternative or adjunct to traditional survey methods, perhaps most valuable when trying to study cannabis behaviors not captured by traditional methods. In addition, in light of the difficulties in developing data infrastructures for evaluating the effects of cannabis legalization [73] and literature suggesting that changes to the legal status of cannabis may disproportionately impact the behavior of regular cannabis users [74], Facebook recruitment methods appear to be valuable for collecting policy-relevant data.
Web surveying via Facebook is only one of many emerging epidemiological methods for studying cannabis use. A growing body of literature has demonstrated that digital trace data [44] (ie, records of naturalistic digital behavior and communication) can be used to study cannabis use. For example, Twitter has been used to study new forms of cannabis administration such as dabbing [75,76], vaping [77], and edibles [78,79]; perceptions, attitudes, and normalization of cannabis use [80-82]; and unique communities of cannabis user subgroups and network structures of cannabis dispensaries [83,84]. Data from other Web-based platforms such as Reddit [85], Instagram [86], YouTube [87], and search engines such as Google [88] or Bing [89] are all other potential sources of digital trace data that have been used to study patterns of cannabis use.
Given the sensitive nature of substance use data, the concept of IP address tracking warrants discussion. When designing a survey, researchers must consider the balance between the need to prevent multiple responses and the need for anonymity to obtain valid responses. Without being able to determine who has already taken a survey, researchers run the risk of having single individuals complete a survey multiple times—especially if monetary incentives are used to encourage survey participation [90]. However, failure to provide respondents with anonymity may result in fewer responses or invalid data. In our surveys to date, we have used the prevent ballot box stuffing feature of Qualtrics as a middle ground. This feature uses cookies rather than IP addresses to prevent multiple responses, which allows us to maintain participant anonymity. Even so, the promise of anonymity may not convince individuals involved in illicit behavior to participate [91]. Finally, note that the use of IP addresses for preventing multiple responses can inadvertently prevent individuals who share the same IP address (eg, college dorm, shared house) from completing the survey.
The landscape of social media will continue to evolve in the coming years, and specific social media platforms such as Facebook may not remain as popular as they are today. However, all indications are that digital social networking and mass communication platforms are here to stay and will continue to grow as advertising tools. In 2017, businesses spent approximately 13.5 billion dollars using social media marketing to sell their products and services [92]. Thus, it seems likely that providing an advertising service within digital social networking platforms will remain a staple means of generating revenue for the companies that create such platforms. In addition, as the machine learning techniques used to disseminate digital marketing advertisements continue to become more sophisticated and effective, researchers can leverage such advances to even more efficiently reach and collect data on clinical subpopulations of interest.
There remain many unanswered questions related to this sampling method. Here, we mention just 3, each of which could provide exciting additional research opportunities. First, can these methods be used effectively to study the use of other substances? It is likely that the degree of stigma surrounding a particular substance of interest will affect the utility of the methodology presented here. For example, there are nationally distributed magazines and well-recognized political activist groups devoted specifically to the promotion of cannabis use and cannabis culture. These aspects of cannabis culture are available as specific targeted interests on the Facebook Business advertising platform. In contrast, to our knowledge, there are no regularly published national magazines or political activist groups that promote crystal methamphetamine use and culture. Thus, the targeting strategies for more stigmatized drugs such as crystal methamphetamine may need to be different and will likely require the use of monetary incentives. One suggestion to overcome this issue is to conduct an in-person pilot focus group with regular users of the substance of interest and collect digital or self-report data concerning their Web-based behavior. The resulting data could then be used to generate a more effective Facebook advertising campaign.
Second, will participants provide identifying contact information in a survey to facilitate longitudinal survey follow-up (ie, repeated sampling from the same individual over time)? Previous work by Harris et al has demonstrated that survey respondents recruited via Facebook are willing to provide contact information to facilitate follow-up for longitudinal studies. However, their study aimed to understand patterns of contraception use among young Australian women [30]. It remains to be seen whether something similar can be accomplished with a US-based sample of heavy cannabis users.
Finally, is it possible to use alternative advertising strategies (eg, not using cannabis-related targeted interests) to obtain samples of less experienced or less frequent cannabis users? Preliminary data currently being collected by our team suggest that this can be readily accomplished using different targeting strategies, but that data collection may be somewhat slower and more expensive.
Sampling issues are a primary concern of any epidemiological investigation because they dictate the conclusions that can be drawn from the data [63,64]. Additional methodological evaluations of social media–based sampling will fill essential gaps in our knowledge of how to use the data effectively. Presently, we believe that social media–based Web surveys have tremendous utility for members of the research community and will continue to facilitate our understanding of the evolving nature of cannabis use behaviors.
Acknowledgments
The authors would like to thank Maria Stoianova for reviewing the paper and providing helpful edits and suggestions. Funding for this work was provided by NIDA: R01-DA032243, R01-DA015186, T32-DA037202, P30-DA029926. The National Institutes of Health had no role in study design; in the collection, analysis and interpretation of data; in the writing of the report; or in the decision to submit the paper for publication.
Abbreviations
- IP
Internet protocol
- LCL
legal cannabis laws
- NSDUH
National Survey on Drug Use and Health
Footnotes
Conflicts of Interest: None declared.
References
- 1.Lee BK. Epidemiologic research and Web 2.0--the user-driven Web. Epidemiology. 2010 Nov;21(6):760–3. doi: 10.1097/EDE.0b013e3181f5a75f.00001648-201011000-00002 [DOI] [PubMed] [Google Scholar]
- 2.Morabia A. A History of Epidemiologic Methods and Concepts. Switzerland: Birkhäuser Basel; 2004. [Google Scholar]
- 3.Cooper SL. Random sampling by telephone: an improved method. J Mark Res. 1964 Nov 21;1(4):45–8. doi: 10.2307/3150377. [DOI] [Google Scholar]
- 4.Rothman KJ, Cann CI, Walker AM. Epidemiology and the internet. Epidemiology. 1997 Mar;8(2):123–5. [PubMed] [Google Scholar]
- 5.van Gelder MM, Bretveld RW, Roeleveld N. Web-based questionnaires: the future in epidemiology? Am J Epidemiol. 2010 Dec 01;172(11):1292–8. doi: 10.1093/aje/kwq291. http://aje.oxfordjournals.org/cgi/pmidlookup?view=long&pmid=20880962 .kwq291 [DOI] [PubMed] [Google Scholar]
- 6.Miller PG, Sønderlund AL. Using the internet to research hidden populations of illicit drug users: a review. Addiction. 2010 Sep;105(9):1557–67. doi: 10.1111/j.1360-0443.2010.02992.x.ADD2992 [DOI] [PubMed] [Google Scholar]
- 7.Coomber R. Dangerous drug adulteration-an international survey of drug dealers using the internet and the world wide web (WWW) Int J Drug Policy. 1997;8:71–81. http://www.websm.org/db/12/2017/Bibliography/Dangerous%20drug%20adulteration%20-%20an%20international%20survey%20of%20drug%20dealers%20using%20the%20Internet%20and%20the%20World%20Wide%20Web%20(WWW)/?&p1=1123&p2=82&p3=85&page=162 . [Google Scholar]
- 8.Barratt M, Lenton S. Beyond recruitment? Participatory online research with people who use drugs. Int J Internet Res Ethics. 2010;3(1):69–86. [Google Scholar]
- 9.Statista. 2017. [2017-05-04]. Number of internet users worldwide from 2005 to 2016 https://www.statista.com/statistics/273018/number-of-internet-users-worldwide/
- 10.eMarketer Statista. 2017. [2017-11-10]. Number of smartphone users worldwide from 2014 to 2020 (in billions) https://www.statista.com/statistics/330695/number-of-smartphone-users-worldwide/
- 11.eMarketer Statista. 2017. [2017-11-10]. Number of social network users worldwide from 2010 to 2021 (in billions) https://www.statista.com/statistics/278414/number-of-worldwide-social-network-users/
- 12.Statista. 2017. [2017-11-10]. Dossier on Facebook https://www.statista.com/study/9711/facebook-statista-dossier/
- 13.Statista. 2017. [2018-02-18]. Dossier: Social media usage worldwide https://www.statista.com/study/12393/social-networks-statista-dossier/
- 14.Statista. 2017. [2018-02-18]. Daily time spent on social networking by internet users worldwide from 2012 to 2017 (in minutes) https://www.statista.com/statistics/433871/daily-social-media-usage-worldwide/
- 15.Stewart J. Nytimes. New York, NY: The New York Times; 2016. May 05, [2017-08-10]. Facebook Has 50 minutes of Your Time Each Day It Wants More https://www.nytimes.com/2016/05/06/business/facebook-bends-the-rules-of-audience-engagement-to-its-advantage.html . [Google Scholar]
- 16.Topolovec-Vranic J, Natarajan K. The use of social media in recruitment for medical research studies: a scoping review. J Med Internet Res. 2016 Nov 7;18(11):e286. doi: 10.2196/jmir.5698. http://www.jmir.org/2016/11/e286/ v18i11e286 [DOI] [PMC free article] [PubMed] [Google Scholar]
- 17.Thornton L, Batterham PJ, Fassnacht DB, Kay-Lambkin F, Calear AL, Hunt S. Recruiting for health, medical or psychosocial research using Facebook: Systematic review. Internet Interv. 2016 May;4:72–81. doi: 10.1016/j.invent.2016.02.001. [DOI] [PMC free article] [PubMed] [Google Scholar]
- 18.Frandsen M, Thow M, Ferguson SG. The effectiveness of social media (Facebook) compared with more traditional advertising methods for recruiting eligible participants to health research studies: a randomized, controlled clinical trial. JMIR Res Protoc. 2016;5(3):e161. doi: 10.2196/resprot.5747. http://www.researchprotocols.org/2016/3/e161/ v5i3e161 [DOI] [PMC free article] [PubMed] [Google Scholar]
- 19.Eysenbach G. Improving the quality of Web surveys: the Checklist for Reporting Results of Internet E-Surveys (CHERRIES) J Med Internet Res. 2004 Sep 29;6(3):e34. doi: 10.2196/jmir.6.3.e34. http://www.jmir.org/2004/3/e34/ v6e34 [DOI] [PMC free article] [PubMed] [Google Scholar]
- 20.Fan WM, Yan Z. Factors affecting response rates of the web survey: a systematic review. Comput Human Behav. 2010 Mar;26(2):132–139. doi: 10.1016/j.chb.2009.10.015. [DOI] [Google Scholar]
- 21.Sánchez-Fernández J, Muñoz-Leiva F, Montoro-Ríos FJ. Improving retention rate and response quality in Web-based surveys. Comput Human Behav. 2012 Mar;28(2):507–514. doi: 10.1016/j.chb.2011.10.023. [DOI] [Google Scholar]
- 22.Eysenbach G, Wyatt J. Using the Internet for surveys and health research. J Med Internet Res. 2002 Nov;4(2):E13. doi: 10.2196/jmir.4.2.e13. http://www.jmir.org/2002/2/e13/ [DOI] [PMC free article] [PubMed] [Google Scholar]
- 23.Manfreda KL, Berzelak J, Vehovar V, Bosnjak M, Haas I. Web surveys versus other survey Modes: a meta-analysis comparing response rates. Int J Mark Res. 2008 Jan;50(1):79–104. doi: 10.1177/147078530805000107. [DOI] [Google Scholar]
- 24.Shih TH, Fan XT. Comparing response rates from web and mail surveys: a meta-analysis. Field Methods. 2008 Mar 03;20(3):249–271. doi: 10.1177/1525822X08317085. [DOI] [Google Scholar]
- 25.Whitaker C, Stevelink S, Fear N. The use of Facebook in recruiting participants for health research purposes: a systematic review. J Med Internet Res. 2017 Aug 28;19(8):e290. doi: 10.2196/jmir.7071. http://www.jmir.org/2017/8/e290/ v19i8e290 [DOI] [PMC free article] [PubMed] [Google Scholar]
- 26.Yuan P, Bare MG, Johnson MO, Saberi P. Using online social media for recruitment of human immunodeficiency virus-positive participants: a cross-sectional survey. J Med Internet Res. 2014;16(5):e117. doi: 10.2196/jmir.3229. http://www.jmir.org/2014/5/e117/ v16i5e117 [DOI] [PMC free article] [PubMed] [Google Scholar]
- 27.Tustin JL, Crowcroft NS, Gesink D, Johnson I, Keelan J, Lachapelle B. Facebook recruitment of vaccine-hesitant Canadian parents: cross-sectional study. JMIR Public Health Surveill. 2017 Jul 24;3(3):e47. doi: 10.2196/publichealth.6870. http://publichealth.jmir.org/2017/3/e47/ v3i3e47 [DOI] [PMC free article] [PubMed] [Google Scholar]
- 28.Nelson EJ, Hughes J, Oakes JM, Pankow JS, Kulasingam SL. Estimation of geographic variation in human papillomavirus vaccine uptake in men and women: an online survey using facebook recruitment. J Med Internet Res. 2014;16(9):e198. doi: 10.2196/jmir.3506. http://www.jmir.org/2014/9/e198/ v16i9e198 [DOI] [PMC free article] [PubMed] [Google Scholar]
- 29.Kapp JM, Peters C, Oliver DP. Research recruitment using Facebook advertising: big potential, big challenges. J Cancer Educ. 2013 Mar;28(1):134–7. doi: 10.1007/s13187-012-0443-z. [DOI] [PubMed] [Google Scholar]
- 30.Harris ML, Loxton D, Wigginton B, Lucke JC. Recruiting online: lessons from a longitudinal survey of contraception and pregnancy intentions of young Australian women. Am J Epidemiol. 2015 May 15;181(10):737–46. doi: 10.1093/aje/kwv006.kwv006 [DOI] [PubMed] [Google Scholar]
- 31.Batterham PJ. Recruitment of mental health survey participants using Internet advertising: content, characteristics and cost effectiveness. Int J Methods Psychiatr Res. 2014 Jun;23(2):184–91. doi: 10.1002/mpr.1421. [DOI] [PMC free article] [PubMed] [Google Scholar]
- 32.Crosier BS, Brian RM, Ben-Zeev D. Using Facebook to reach people who experience auditory hallucinations. J Med Internet Res. 2016;18(6):e160. doi: 10.2196/jmir.5420. http://www.jmir.org/2016/6/e160/ v18i6e160 [DOI] [PMC free article] [PubMed] [Google Scholar]
- 33.Chu JL, Snider CE. Use of a social networking web site for recruiting Canadian youth for medical research. J Adolesc Health. 2013 Jun;52(6):792–4. doi: 10.1016/j.jadohealth.2012.12.002.S1054-139X(12)00783-5 [DOI] [PubMed] [Google Scholar]
- 34.Lord S, Brevard J, Budman S. Connecting to young adults: an online social network survey of beliefs and attitudes associated with prescription opioid misuse among college students. Subst Use Misuse. 2011;46(1):66–76. doi: 10.3109/10826084.2011.521371. http://europepmc.org/abstract/MED/21190407 . [DOI] [PMC free article] [PubMed] [Google Scholar]
- 35.Jones SC, Robinson L, Barrie L, Francis K, Lee JK. Association between young Australian's drinking behaviours and their interactions with alcohol brands on Facebook: results of an online survey. Alcohol Alcohol. 2016 Jul;51(4):474–80. doi: 10.1093/alcalc/agv113.agv113 [DOI] [PubMed] [Google Scholar]
- 36.Ramo DE, Hall SM, Prochaska JJ. Reliability and validity of self-reported smoking in an anonymous online survey with young adults. Health Psychol. 2011 Nov;30(6):693–701. doi: 10.1037/a0023443. http://europepmc.org/abstract/MED/21574709 .2011-09906-001 [DOI] [PMC free article] [PubMed] [Google Scholar]
- 37.Ramo DE, Young-Wolff KC, Prochaska JJ. Prevalence and correlates of electronic-cigarette use in young adults: findings from three studies over five years. Addict Behav. 2015 Feb;41:142–7. doi: 10.1016/j.addbeh.2014.10.019.S0306-4603(14)00351-7 [DOI] [PMC free article] [PubMed] [Google Scholar]
- 38.Lenton S, Frank VA, Barratt MJ, Dahl HV, Potter GR. Attitudes of cannabis growers to regulation of cannabis cultivation under a non-prohibition cannabis model. Int J Drug Policy. 2015 Mar;26(3):257–66. doi: 10.1016/j.drugpo.2014.08.002.S0955-3959(14)00216-3 [DOI] [PubMed] [Google Scholar]
- 39.Barratt MJ, Lenton S. Representativeness of online purposive sampling with Australian cannabis cultivators. Int J Drug Policy. 2015 Mar;26(3):323–6. doi: 10.1016/j.drugpo.2014.10.007.S0955-3959(14)00288-6 [DOI] [PubMed] [Google Scholar]
- 40.Barratt MJ, Bouchard M, Decorte T, Asmussen Frank V, Hakkarainen P, Lenton S, Malm A, Nguyen H, Potter GR. Understanding global patterns of domestic cannabis cultivation. Drugs Alcohol Today. 2012 Nov 30;12(4):213–221. doi: 10.1108/17459261211286627. [DOI] [Google Scholar]
- 41.Ramo DE, Prochaska JJ. Prevalence and co-use of marijuana among young adult cigarette smokers: an anonymous online national survey. Addict Sci Clin Pract. 2012 Apr 19;7:5. doi: 10.1186/1940-0640-7-5. https://ascpjournal.biomedcentral.com/articles/10.1186/1940-0640-7-5 .1940-0640-7-5 [DOI] [PMC free article] [PubMed] [Google Scholar]
- 42.Ramo DE, Delucchi KL, Hall SM, Liu H, Prochaska JJ. Marijuana and tobacco co-use in young adults: patterns and thoughts about use. J Stud Alcohol Drugs. 2013 Mar;74(2):301–10. doi: 10.15288/jsad.2013.74.301. http://europepmc.org/abstract/MED/23384378 . [DOI] [PMC free article] [PubMed] [Google Scholar]
- 43.Eysenbach G. Infodemiology and infoveillance: framework for an emerging set of public health informatics methods to analyze search, communication and publication behavior on the Internet. J Med Internet Res. 2009;11(1):e11. doi: 10.2196/jmir.1157. http://www.jmir.org/2009/1/e11/ v11i1e11 [DOI] [PMC free article] [PubMed] [Google Scholar]
- 44.Salathé M, Bengtsson L, Bodnar TJ, Brewer DD, Brownstein JS, Buckee C, Campbell EM, Cattuto C, Khandelwal S, Mabry PL, Vespignani A. Digital epidemiology. PLoS Comput Biol. 2012;8(7):e1002616. doi: 10.1371/journal.pcbi.1002616. http://dx.plos.org/10.1371/journal.pcbi.1002616 .PCOMPBIOL-D-12-00494 [DOI] [PMC free article] [PubMed] [Google Scholar]
- 45.Ekman A, Litton JE. New times, new needs; e-epidemiology. Eur J Epidemiol. 2007;22(5):285–92. doi: 10.1007/s10654-007-9119-0. [DOI] [PubMed] [Google Scholar]
- 46.ProCon Medicalmarijuana.procon. [2017-11-10]. 29 Legal Medical Marijuana States and DC https://medicalmarijuana.procon.org/view.resource.php?resourceID=000881 .
- 47.Carlini BH, Garrett SB, Harwick RM. Beyond joints and brownies: marijuana concentrates in the legal landscape of WA State. Int J Drug Policy. 2017 Apr;42:26–29. doi: 10.1016/j.drugpo.2017.01.004.S0955-3959(17)30006-3 [DOI] [PubMed] [Google Scholar]
- 48.Barrus DG, Capogrossi KL, Cates SC, Gourdet CK, Peiper NC, Novak SP, Lefever TW, Wiley JL. Tasty THC: promises and challenges of cannabis edibles. Methods Rep RTI Press. 2016 Nov;2016 doi: 10.3768/rtipress.2016.op.0035.1611. http://europepmc.org/abstract/MED/28127591 . [DOI] [PMC free article] [PubMed] [Google Scholar]
- 49.Budney AJ, Sargent JD, Lee DC. Vaping cannabis (marijuana): parallel concerns to e-cigs? Addiction. 2015 Nov;110(11):1699–704. doi: 10.1111/add.13036. [DOI] [PMC free article] [PubMed] [Google Scholar]
- 50.Loflin M, Earleywine M. A new method of cannabis ingestion: the dangers of dabs? Addict Behav. 2014 Oct;39(10):1430–3. doi: 10.1016/j.addbeh.2014.05.013.S0306-4603(14)00162-2 [DOI] [PubMed] [Google Scholar]
- 51.Alshaikh F, Ramzan F, Rawaf S, Majeed A. Social network sites as a mode to collect health data: a systematic review. J Med Internet Res. 2014;16(7):e171. doi: 10.2196/jmir.3050. http://www.jmir.org/2014/7/e171/ v16i7e171 [DOI] [PMC free article] [PubMed] [Google Scholar]
- 52.Kosinski M, Matz SC, Gosling SD, Popov V, Stillwell D. Facebook as a research tool for the social sciences: opportunities, challenges, ethical considerations, and practical guidelines. Am Psychol. 2015 Sep;70(6):543–56. doi: 10.1037/a0039210.2015-39598-005 [DOI] [PubMed] [Google Scholar]
- 53.Umbach PD. Web surveys: best practices. In: Crisp G, editor. New Directions for Institutional Research. Hoboken, NJ: Wiley; 2004. pp. 23–38. [Google Scholar]
- 54.Wang C, Raina R, Fong D, Zhou D, Han J, Badros G. Learning Relevance from a Heterogeneous Social Network and Its Application in Online Targeting. ACM Special Interest Group on Information Retrieval (SIGIR); July 24-28, 2011; Beijing. 2011. [Google Scholar]
- 55.Xinran H, Pan J, Jin O, Xu T, Liu B, Xu T. Practical Lessons from Predicting Clicks on Ads at Facebook. International Workshop on Data Mining for Online Advertising (ADKDD); August 24-27, 2014; New York, NY. 2014. [DOI] [Google Scholar]
- 56.Hazelwood K, Bird S, Brooks D, Chintala S, Diril U, Dzhulgakov D. Applied Machine Learning at Facebook: A Datacenter Infrastructure Perspective. International Symposium on High-Performance Computer Architecture (HPCA); February 24-28, 2018; Vienna, Austria. 2018. [DOI] [Google Scholar]
- 57.Borodovsky JT, Budney AJ. Legal cannabis laws, home cultivation, and use of edible cannabis products: a growing relationship? Int J Drug Policy. 2017 Nov 02;50:102–110. doi: 10.1016/j.drugpo.2017.09.014.S0955-3959(17)30292-X [DOI] [PMC free article] [PubMed] [Google Scholar]
- 58.Facebook Inc Facebook. 2018. [2018-01-21]. About the delivery system: pacing https://www.facebook.com/business/help/1754368491258883?helpref=related&ref=related#.
- 59.Borodovsky JT, Crosier BS, Lee DC, Sargent JD, Budney AJ. Smoking, vaping, eating: is legalization impacting the way people use cannabis? Int J Drug Policy. 2016 Oct;36:141–7. doi: 10.1016/j.drugpo.2016.02.022. http://europepmc.org/abstract/MED/26992484 .S0955-3959(16)30054-8 [DOI] [PMC free article] [PubMed] [Google Scholar]
- 60.Borodovsky JT, Lee DC, Crosier BS, Gabrielli JL, Sargent JD, Budney AJ. U.S. cannabis legalization and use of vaping and edible products among youth. Drug Alcohol Depend. 2017 Aug 01;177:299–306. doi: 10.1016/j.drugalcdep.2017.02.017.S0376-8716(17)30184-9 [DOI] [PMC free article] [PubMed] [Google Scholar]
- 61.Lee DC, Crosier BS, Borodovsky JT, Sargent JD, Budney AJ. Online survey characterizing vaporizer use among cannabis users. Drug Alcohol Depend. 2016 Feb 01;159:227–33. doi: 10.1016/j.drugalcdep.2015.12.020. http://europepmc.org/abstract/MED/26774946 .S0376-8716(15)01835-9 [DOI] [PMC free article] [PubMed] [Google Scholar]
- 62.Sloboda Z. Defining and measuring drug abusing behaviors. In: Sloboda Z, editor. Epidemiology of Drug Abuse. Boston, MA: Springer US; 2005. pp. 3–14. [Google Scholar]
- 63.Kakinami L, Conner KR. Sampling strategies for addiction research. In: Miller PG, Strang J, Miller PM, editors. Addiction Research Methods. United Kingdom: Blackwell Publishing Ltd; 2010. pp. 27–42. [Google Scholar]
- 64.Taylor C, Griffiths P. Sampling issues in drug epidemiology. In: Sloboda Z, editor. Epidemiology of Drug Abuse. Boston, MA: Springer US; 2005. pp. 79–98. [Google Scholar]
- 65.Fitch C, Rhodes T, Hope V, Stimson G, Renton A. The Science of Drug Abuse Epidemiology. Vienna, Austria: United Nations Office on Drugs and Crime; 2003. The role of rapid assessment methods in drug use epidemiology. [Google Scholar]
- 66.Dupont HB, Kaplan CD, Braam RV, Verbraeck HT, de Vries NK. The application of the rapid assessment and response methodology for cannabis prevention research among youth in the Netherlands. Int J Drug Policy. 2015 Aug;26(8):731–8. doi: 10.1016/j.drugpo.2014.11.003. https://linkinghub.elsevier.com/retrieve/pii/S0955-3959(14)00307-7 .S0955-3959(14)00307-7 [DOI] [PubMed] [Google Scholar]
- 67.Center for Behavioral Health Statistics and Quality . National Survey on Drug Use and Health 2015. Research Triangle Park, NC: RTI International and United States Department of Health and Human Services. Substance Abuse and Mental Health Services Administration; 2016. [Google Scholar]
- 68.Borodovsky J, Lee DC, Crosier BS, Budney AJ. Cannabis use data collected via social media: a methodological comparison. Drug Alcohol Depend. 2017 Feb;171:e24. doi: 10.1016/j.drugalcdep.2016.08.081. [DOI] [Google Scholar]
- 69.Barratt MJ, Ferris JA, Zahnow R, Palamar JJ, Maier LJ, Winstock AR. Moving on from representativeness: testing the utility of the Global Drug Survey. Subst Abuse. 2017;11:1178221817716391. doi: 10.1177/1178221817716391. http://europepmc.org/abstract/MED/28924351 .10.1177_1178221817716391 [DOI] [PMC free article] [PubMed] [Google Scholar]
- 70.U.S. Census Bureau Census. [2018-04-06]. Annual Estimates of the Resident Population April 1, 2010 to July 1, 2016 https://www.census.gov/data/datasets/2017/demo/popest/state-total.html .
- 71.Brick JM, Kalton G. Handling missing data in survey research. Stat Methods Med Res. 1996 Sep;5(3):215–38. doi: 10.1177/096228029600500302. [DOI] [PubMed] [Google Scholar]
- 72.Ramo DE, Liu H, Prochaska JJ. Reliability and validity of young adults' anonymous online reports of marijuana use and thoughts about use. Psychol Addict Behav. 2012 Dec;26(4):801–11. doi: 10.1037/a0026201. http://europepmc.org/abstract/MED/22082344 .2011-25891-001 [DOI] [PMC free article] [PubMed] [Google Scholar]
- 73.Kilmer B, Pacula RL. Building the data infrastructure to evaluate cannabis legalization. Addiction. 2017 Jul;112(7):1140–1141. doi: 10.1111/add.13824. [DOI] [PubMed] [Google Scholar]
- 74.Pacula RL, Lundberg R. Why changes in price matter when thinking about marijuana policy: a review of the literature on the elasticity of demand. Public Health Rev. 2014;35(2):1–18. doi: 10.1007/BF03391701. http://europepmc.org/abstract/MED/25642015 . [DOI] [PMC free article] [PubMed] [Google Scholar]
- 75.Daniulaityte R, Nahhas RW, Wijeratne S, Carlson RG, Lamy FR, Martins SS, Boyer EW, Smith GA, Sheth A. “Time for dabs”: analyzing Twitter data on marijuana concentrates across the U.S. Drug Alcohol Depend. 2015 Oct 1;155:307–11. doi: 10.1016/j.drugalcdep.2015.07.1199.S0376-8716(15)01604-X [DOI] [PMC free article] [PubMed] [Google Scholar]
- 76.Cavazos-Rehg PA, Sowles SJ, Krauss MJ, Agbonavbare V, Grucza R, Bierut L. A content analysis of tweets about high-potency marijuana. Drug Alcohol Depend. 2016 Sep 01;166:100–8. doi: 10.1016/j.drugalcdep.2016.06.034.S0376-8716(16)30196-X [DOI] [PMC free article] [PubMed] [Google Scholar]
- 77.Sowles SJ, Krauss MJ, Connolly S, Cavazos-Rehg PA. A content analysis of vaping advertisements on Twitter, November 2014. Prev Chronic Dis. 2016 Sep 29;13:E139. doi: 10.5888/pcd13.160274. https://www.cdc.gov/pcd/issues/2016/16_0274.htm .E139 [DOI] [PMC free article] [PubMed] [Google Scholar]
- 78.Cavazos-Rehg PA, Zewdie K, Krauss MJ, Sowles SJ. “No high like a brownie high”: a content analysis of edible marijuana tweets. Am J Health Promot. 2018;32(4):880–86. doi: 10.1177/0890117116686574. [DOI] [PubMed] [Google Scholar]
- 79.Lamy FR, Daniulaityte R, Sheth A, Nahhas RW, Martins SS, Boyer EW, Carlson RG. “Those edibles hit hard”: exploration of Twitter data on cannabis edibles in the U.S. Drug Alcohol Depend. 2016 Jul 1;164:64–70. doi: 10.1016/j.drugalcdep.2016.04.029.S0376-8716(16)30056-4 [DOI] [PMC free article] [PubMed] [Google Scholar]
- 80.Thompson L, Rivara FP, Whitehill JM. Prevalence of marijuana-related traffic on Twitter, 2012-2013: a content analysis. Cyberpsychol Behav Soc Netw. 2015 Jun;18(6):311–9. doi: 10.1089/cyber.2014.0620. http://europepmc.org/abstract/MED/26075917 . [DOI] [PMC free article] [PubMed] [Google Scholar]
- 81.Cavazos-Rehg P, Krauss M, Grucza R, Bierut L. Characterizing the followers and tweets of a marijuana-focused Twitter handle. J Med Internet Res. 2014;16(6):e157. doi: 10.2196/jmir.3247. http://www.jmir.org/2014/6/e157/ v16i6e157 [DOI] [PMC free article] [PubMed] [Google Scholar]
- 82.Cavazos-Rehg PA, Krauss M, Fisher SL, Salyer P, Grucza RA, Bierut LJ. Twitter chatter about marijuana. J Adolesc Health. 2015 Feb;56(2):139–45. doi: 10.1016/j.jadohealth.2014.10.270.S1054-139X(14)00703-4 [DOI] [PMC free article] [PubMed] [Google Scholar]
- 83.Peiper NC, Baumgartner PM, Chew RF, Hsieh YP, Bieler GS, Bobashev GV, Siege C, Zarkin GA. Patterns of Twitter behavior among networks of cannabis dispensaries in California. J Med Internet Res. 2017 Jul 04;19(7):e236. doi: 10.2196/jmir.7137. http://www.jmir.org/2017/7/e236/ v19i7e236 [DOI] [PMC free article] [PubMed] [Google Scholar]
- 84.Baumgartner P, Peiper N. Utilizing big data and Twitter to discover emergent online communities of cannabis users. Subst Abuse. 2017;11:1178221817711425. doi: 10.1177/1178221817711425. http://europepmc.org/abstract/MED/28615950 .10.1177_1178221817711425 [DOI] [PMC free article] [PubMed] [Google Scholar]
- 85.Sowles SJ, Krauss MJ, Gebremedhn L, Cavazos-Rehg PA. “I feel like I've hit the bottom and have no idea what to do”: supportive social networking on Reddit for individuals with a desire to quit cannabis use. Subst Abus. 2017;38(4):477–482. doi: 10.1080/08897077.2017.1354956. [DOI] [PMC free article] [PubMed] [Google Scholar]
- 86.Cavazos-Rehg PA, Krauss MJ, Sowles SJ, Bierut LJ. Marijuana-related posts on Instagram. Prev Sci. 2016 Aug;17(6):710–20. doi: 10.1007/s11121-016-0669-9.10.1007/s11121-016-0669-9 [DOI] [PMC free article] [PubMed] [Google Scholar]
- 87.Krauss MJ, Sowles SJ, Mylvaganam S, Zewdie K, Bierut LJ, Cavazos-Rehg PA. Displays of dabbing marijuana extracts on YouTube. Drug Alcohol Depend. 2015 Oct 1;155:45–51. doi: 10.1016/j.drugalcdep.2015.08.020.S0376-8716(15)01613-0 [DOI] [PMC free article] [PubMed] [Google Scholar]
- 88.Zhang Z, Zheng X, Zeng DD, Leischow SJ. Tracking dabbing using search query surveillance: a case study in the United States. J Med Internet Res. 2016 Sep 16;18(9):e252. doi: 10.2196/jmir.5802. http://www.jmir.org/2016/9/e252/ v18i9e252 [DOI] [PMC free article] [PubMed] [Google Scholar]
- 89.Yom-Tov E, Lev-Ran S. Adverse reactions associated with cannabis consumption as evident from search engine queries. JMIR Public Health Surveill. 2017 Oct 26;3(4):e77. doi: 10.2196/publichealth.8391. http://publichealth.jmir.org/2017/4/e77/ v3i4e77 [DOI] [PMC free article] [PubMed] [Google Scholar]
- 90.Bowen AM, Daniel CM, Williams ML, Baird GL. Identifying multiple submissions in Internet research: preserving data integrity. AIDS Behav. 2008 Feb 1;12(6):964–973. doi: 10.1007/s10461-007-9352-2. [DOI] [PMC free article] [PubMed] [Google Scholar]
- 91.Barratt MJ, Potter GR, Wouters M, Wilkins C, Werse B, Perälä J, Pedersen MM, Nguyen H, Malm A, Lenton S, Korf D, Klein A, Heyde J, Hakkarainen P, Frank VA, Decorte T, Bouchard M, Blok T. Lessons from conducting trans-national Internet-mediated participatory research with hidden populations of cannabis cultivators. Int J Drug Policy. 2015 Mar;26(3):238–49. doi: 10.1016/j.drugpo.2014.12.004.S0955-3959(14)00360-0 [DOI] [PubMed] [Google Scholar]
- 92.Statista. 2017. [2017-11-10]. Dossier Social Media Marketing in the U.S https://www.statista.com/study/15449/social-media-marketing-in-the-us-statista-dossier/