Abstract
The breast cancer type 1 susceptibility protein (Brca1) is a regulator of DNA repair in mammary gland cells; however, recent cell culture evidence suggests that Brca1 influences other processes, including those in nonmammary cells. In this study, we sought to determine whether Brca1 is necessary for metabolic regulation of skeletal muscle using a novel in vivo mouse model. We developed an inducible skeletal muscle-specific Brca1knockout (BRCA1KOsmi) model to test whether Brca1 expression is necessary for maintenance of metabolic function of skeletal muscle when exposed to a high-fat diet (HFD). Our data demonstrated that deletion of Brca1 prevented HFD-induced alterations in glucose and insulin tolerance. Irrespective of diet, BRCA1KOsmi mice exhibited significantly lower ADP-stimulated complex I mitochondrial respiration rates compared to age-matched wild-type (WT) mice. The data show that Brca1 has the ability to localize to the mitochondria in skeletal muscle and that BRCA1KOsmi mice exhibit higher whole-body CO2 production, respiratory exchange ratio, and energy expenditure, compared with the WT mice. Our results demonstrate that loss of Brca1 in skeletal muscle leads to dysregulated metabolic function, characterized by decreased mitochondrial respiration. Thus, any condition that results in loss of Brca1 function could induce metabolic imbalance in skeletal muscle.—Jackson, K. C., Tarpey, M. D., Valencia, A. P., Iñigo, M. R., Pratt, S. J., Patteson, D. J., McClung, J. M., Lovering, R. M., Thomson, D. M., Spangenburg, E. E. Induced Cre-mediated knockdown of Brca1 in skeletal muscle reduces mitochondrial respiration and prevents glucose intolerance in adult mice on a high-fat diet.
Keywords: metabolism, disease, breast, cancer
Breast cancer 1, early-onset gene (BRCA1 in humans; Brca1 in mice) is a tumor-suppressor gene, whose protein product, termed breast cancer type 1 susceptibility protein (Brca1), is normally expressed in several cell types. Specific single-nucleotide polymorphisms in BRCA1 are strongly linked to an increased risk of breast cancer development. Brca1 plays a critical role in DNA repair; thus, mutations in the gene that lead to loss of protein function can result in accumulation of damaged DNA within the cell (1). Despite its expression in many tissues, most work concerning Brca1 has been largely restricted to breast tissue. However, recent studies have demonstrated that Brca1 plays a critical role in vascular and neuronal tissues, suggesting that Brca1 plays a much larger physiologic role than previously identified (2–4).
We recently demonstrated that Brca1 is expressed in skeletal muscle and is a critical regulator of metabolic function in cultured human myotubes (5). Specifically, we found that in vitro knockdown of Brca1 expression resulted in reduced mitochondrial O2 consumption in these cells (5). Others have shown that overexpression of Brca1 in cultured MCF7 cells, a breast cancer cell line, increased oxidative gene expression, whereas loss of Brca1 expression increased glycolytic gene expression (6). In addition, deletion of Brca1 expression in vascular cells results in reduced catabolic breakdown of free fatty acids (6, 7). The published data suggest that manipulation of Brca1 expression influences the metabolic phenotype of cultured cells and potentially the ability of the cells to respond to conditions of nutrient overload.
Recent data in cultured cells (endothelial and fibroblast) found that Brca1 was localized to the mitochondria (8, 9), which is surprising because Brca1 lacks a traditional mitochondrial localization sequence. In these cells, Brca1 was found throughout the mitochondrial matrix, suggesting colocalization with the mitochondrial DNA (8). These studies suggest that manipulation of Brca1 expression affects mitochondrial function of cultured cells. To the best of our knowledge, no studies have considered an in vivo metabolic role for Brca1 in skeletal muscle.
The purpose of this study was to determine whether Brca1 expression in skeletal muscle is critical to the regulation of metabolic function in vivo. Using a novel inducible skeletal muscle–specific Brca1 knockout (KO) mouse, we hypothesized that a reduction of Brca1 protein content in skeletal muscle would increase the development of metabolic dysfunction in response to nutrient overload induced by a high-fat diet (HFD). We found that decreases in Brca1 expression led to a significant reduction in mitochondrial respiration and improved glucose tolerance after HFD. As in other cell types, in skeletal muscle we observed Brca1 colocalization to the mitochondria, supporting a potential novel role for Brca1 in muscle mitochondrial function. Overall, these findings provide critical evidence that Brca1 expression is essential for maintaining the metabolic phenotype of skeletal muscle.
MATERIALS AND METHODS
Generation of human skeleton actin-Cre+ Brca1fl/fl mouse
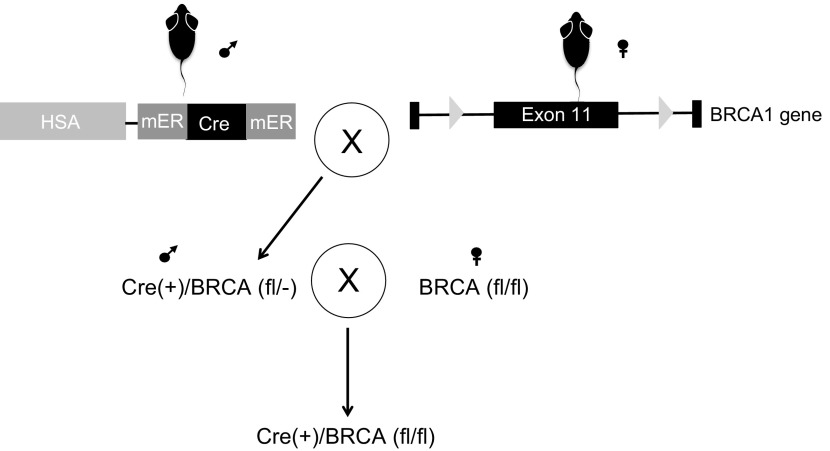
Female mice with flox sites flanking exon 11 of the Brca1 gene (referred to as Brca1fl/fl, obtained from the National Cancer Institute Mouse Repository, Bethesda, MD, USA) were bred with male mice containing a skeletal muscle tissue–specific tamoxifen-inducible Cre recombinase (mER-Cre-mER) (kind gift of Dr. Karyn Esser, University of Florida, Gainesville, FL, USA, and Dr. John J. McCarthy, University of Kentucky, Lexington, KY, USA) (Fig. 1). The breeding scheme generated offspring human skeleton actin (HSA)-mER-Cre-mER+-Brca1fl/−, which were bred to female Brca1fl/fl, resulting in HSA-mER-Cre-mER+-Brca1fl/fl mice. HSA-mER-Cre-mER+-Brca1fl/fl mice were then backcrossed for 8–9 generations before use, with the background strain being C57/Bl6NJ. The University of Maryland and East Carolina University Institutional Animal Care and Use Committee Review Boards approved all aspects involving the described animal research. In addition, all guidelines from the Guide for the Care and Use of Laboratory Animals [National Institutes of Health (NIH), Bethesda, MD, USA] were followed.
Figure 1.
Creation of a BRCA1KOsmi mouse. HSA-mER-Cre-mER mice (10) were crossed with BRCA1fl/fl mice, which have flox sites flanking exon 11 within the BRCA1 gene (11). Exon 11 in the BRCA1 is the largest exon in the BRCA1 gene (∼3400 bp) accounting for 60% of coding sequence. Male mice positive for Cre and BRCA1fl/fl were mated to female mice positive for BRCA1fl/fl, but negative for Cre. Only offspring that were Cre+ were used in these studies. Ten-week-old HSA-Cre+ BRCA1 Flox+/+ male and female mice were injected with 2 mg/d tamoxifen or vehicle solution for 5 consecutive days. In all figures, BRCA1KOsmi mice are referred to as KO and vehicle-injected mice as WT.
Animal genotyping
All animals were genotyped based on the presence of HSA-Cre and homozygote Brca1 flox expression using genomic DNA. Primer sets for Mer-Cre-Mer F-5′-GGCATGGTGGAGATCTTTGA-3′ and R-5′-CGACCGGCAAACGGACAGAAGC-3′ were used to screen for HSA-mER-Cre-mER+ animals (10). Concurrently, all animals were also genotyped for Brca1 flox using primer sets B004-5′-CTGGGTAGTTTGTAAGCATGC-3′ and B005-5′-CAATAAACTGCTGGTCTCAGG-3′ where the Brca1 flox amplicon is ∼500 bp and the wild-type (WT) is ∼450 bp.
Brca1 recombination DNA analysis
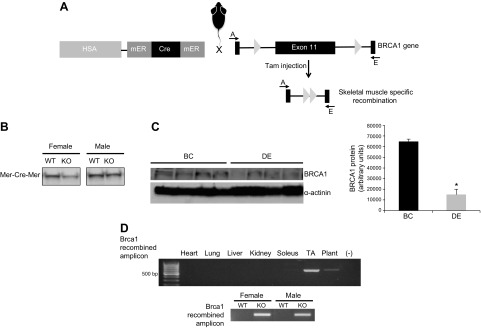
Cre-mediated recombination was confirmed through PCR analysis of genomic DNA with a DNA Isolation Kit (Qiagen, Germantown, MD, USA). Specifically, primer Brca1 Flox-A-5′-CTGGGTAGTTTGTAAGCATGC-3′ and primer Brca1 Flox-E-5′-CTGCGAGCAGTCTTCAGAAAG-3′ (Fig. 2A) were used to generate an amplicon that was ∼621 bp in length, which indicated recombination and removal of the flox region of Brca1, as has been described (11). In contrast, failure to detect an amplicon indicates no active recombination of the flox sites. No differences were found in the amount of mER-Cre-mER protein across sexes in the mouse model (Fig. 2B). The recombination events were consistent with previously described results using the HSA-driven mER-Cre-mER mouse (10). Exon 11 is the largest exon in BRCA1, with previous work demonstrating that excision of exon 11 results in loss of full-length Brca1 function (11).
Figure 2.
Induction of flox recombination of the BRCA1 gene specifically in skeletal muscle. A) Injection of tamoxifen resulted in the deletion of exon 11 of BRCA1. B) The mER-Cre-mER transgene was expressed in gastrocnemius muscle of male and female mice after mice were crossed with the BRCA1fl/fl strain. C) Injection of tamoxifen for 5 d resulted in the recombination of the flox sites, deleting exon 11. A PCR strategy was used, where primers A—E were aligned to either side of exon 11 outside of the flox sites. Because of the large size of exon 11, the PCR failed to produce a product without successful recombination of the flox sites. Successful recombination of the flox sites resulted in a PCR product of 621 bp. Tissue was collected from animals at 3 wk after injection, and recombination was found to occur only in skeletal muscle, with no recombination occurring in the heart or any nonstriated muscle. −, refers to the negative control. Recombination occurred in male and female mice with similar fidelity. D) Decreases in Brca1 protein were detected in the gastrocnemius muscle of the tamoxifen-injected compared to Veh-injected mice. We did not see complete loss of BRCA1 content, which was likely because signal was derived from other cell types, such as the intraskeletal muscle vasculature. BRCA1 expression is also found in vascular and neuronal cells (20). Means ± sem. *P < 0.05.
Experimental approach
Ten-week-old HSA-mER-Cre-mER+-Brca1fl/fl male and female mice were injected intraperitoneally (IP) with 2 mg/d tamoxifen or vehicle solution for 5 consecutive days. Preliminary experiments found that flox recombination was detectable within days after completing the 5-d injection protocol; however, to ensure that no off-target effects occurred, animals underwent a 14 d washout period before assignment to experimental groups. In the figures, animals receiving tamoxifen injections are referred to as KO mice, and mice receiving vehicle injections are referred to as WT mice. Upon completing the 14-d washout period, animals were randomly assigned to receive either a control diet (low-fat) (CD; 10% kcal fat; D12450K) (KO-CD; WT-CD) or a HFD (45% kcal fat; D12451) (WT-HFD; KO+HFD) (Research Diets, New Brunswick, NJ, USA) for a duration of 12 wk. Food intake and body weight were recorded during the 11 wk of feeding. Upon completing these measures, mice were euthanized at wk 12, and tissues were either processed or flash frozen and stored at −80°C. We also performed control experiments in a parallel cohort to account for any nonspecific effects of tamoxifen or vehicle delivery by injecting HSA- mER-Cre-mER+ in the same manner as described above, with the tissue captured in the same fashion.
Glucose–insulin tolerance testing
For glucose tolerance testing (GTT), animals from each group (n = 8/group) were left unfed overnight in cages containing hardwood bedding before GTT, whereas for insulin tolerance tests (ITTs), animals retained access to food. Before injecting glucose or insulin on the day of the test, fed (GTT) and unfed (ITT) basal blood glucose levels were measured. For GTTs, animals were injected IP with 0.001 g glucose/g body weight. For ITTs, animals were injected with recombinant insulin dissolved in sterile PBS and with 1.0 U insulin (Humalin; Eli Lilly, Indianapolis, IN, USA) per 1 kg body weight. Blood glucose levels were measured with a glucometer (AlphaTrak; Abbott, Chicago, IL, USA) before injection (0) and at 30, 60, 90, and 120 min after glucose or insulin injection. A 72-h washout period occurred between GTT and ITT procedures.
Mitochondrial respiration measures
Skeletal muscle mitochondria were isolated from animals from each group (n = 6–8/group) according to previously described methods with slight modifications (12). Quadriceps muscles were collected and immediately placed in ice-cold PBS supplemented with 10 mM EDTA. Connective tissue was removed, and muscles were minced with scissors during incubation on ice in PBS/EDTA 0.05% trypsin for 30 min. The muscles were then homogenized with a 30 ml glass/Teflon potter Elvehjem Tissue Grinder (Omni International, Kennesaw, GA, USA) in isolation buffer 1 containing 67 mM mannitol, 50 mM Tris/HCl, 1 mM EDTA, and 1 mg/ml bovine serum albumin (pH 7.4). The homogenate was transferred to a conical tube and centrifuged at 700 g for 10 min at 4°C. The supernatant was transferred and centrifuged at 8000 g for 10 min at 4°C. The pellet was resuspended in isolation buffer 2, containing 300 mM mannitol, 10 mM Tris/HCl, and 3 mM EGTA/Tris, then centrifuged at 8000 g for 10 min at 4°C. The resulting supernatant was discarded. The pellet was then resuspended in 50 μl of respiration buffer [125 mM KCl, 2 mM K2PO4, 10 mM 4-(2-hydroxyethyl)-1-piperazineethanesulfonic acid (HEPES), 1 mM MgCl, 0.1 mM EGTA, and 1% bovine serum albumin] for mitochondrial respiration measurements. The protein concentration of the pellet was determined using the Pierce BCA Protein Assay (Thermo Fisher Scientific, Waltham, MA, USA).
Mitochondrial respiration was measured (Hanstech, Norfolk, United Kingdom) as has been previously described (12). Freshly isolated mitochondria from each group were placed in the calibrated electrode chamber containing 500 μl respiration buffer. Basal respiration was induced with addition of 0.5 mM glutamate/0.025 mM malate to the respiration buffer. ADP stimulated respiration was induced with the delivery of 300 µM ADP to the chamber. Where possible, each sample was run at least in triplicate. Oxygen consumption rates were then normalized to mitochondrial protein content.
Intramuscular lipid content
To determine intramuscular lipid content (IMLC), lipid droplets were visualized and quantified by using Bodipy (493/503) (Thermo Fisher Scientific) staining of the tibialis anterior (TA) muscles from all groups (n = 6/group), as described by our group (13).
Immunoblot analysis
Immunoblot analysis with whole-muscle homogenate protein was performed (5, 14). Membranes were probed with an antibody specific to BRCA1 (I-20, rabbit polyclonal, sc-646; 1:200; Santa Cruz Biotechnology, Dallas, TX, USA), total oxphos (ab110413, mouse monoclonal, 1:1000; Abcam, Boston, MA, USA), and α-actinin (EA-53, A7732, mouse monoclonal, 1:5000; MilliporeSigma, Billerica, MA, USA).
Mouse malonyl CoA measures
Malonyl coenzyme A (CoA) measures were performed on the plantaris muscles (5).
Electron microscopy imaging of skeletal muscle
The deep (red) portions of the gastrocnemius muscles were removed, cut into 1 mm3 cubes and incubated fixed overnight with 2.5% (v/v) glutaraldehyde, 2.0% (v/v) paraformaldehyde in 0.1 M sodium cacodylate buffer (pH 7.4), overnight at 4°C. Samples were sectioned for electron microscopy at ∼90 nm, and viewed with a 201 microscope (Phillips, Eindhoven, The Netherlands) similar to the published method (15).
BRCA1 localization measure
cDNA specific for BRCA1 harboring a yellow fluorescent protein (YFP) tag was electroporated into the flexor digitorum brevis (FDB) muscle of young male mice (16). Full length BRCA1-YFP plasmid was a kind gift of Dr. B. Henderson (Westmead Institute for Cancer Research, Sydney, NSW, Australia (17). After 1 wk, the muscle was removed from mice under general anesthesia, and single muscle fibers were isolated. The isolated FDB fibers were incubated with MitoTracker DeepRed and NucBlue (Thermo Fisher Scientific) for 30 min. The fibers were carefully washed with sterile Krebs-Ringer Buffer and immediately imaged with a Fluoview FV1000 Confocal Microscope (Olympus, Center Valley, PA, USA). Images were captured at ×60 magnification, ensuring the Nyquist spatial sampling was appropriate, and colocalization was assessed with ImageJ software (NIH) according to recommended procedures (18). The YFP localization varied across the fiber, and Mander’s coefficient was therefore calculated to determine spatial localization of BRCA-YFP and MitoTracker or DAPI.
Assessment of whole body energy metabolism
The TSE LabMaster System (TSE System, Chesterfield, MO, USA) was used to determine whole-body volume of O2 (Vo2) consumption and volume of CO2 (Vco2) production, respiratory exchange ratio (RER), and energy expenditure. Data were captured over a 3-d period after 2 d of acclimation. Data represent the average over the 3 d.
Acute exercise tolerance bout
An endurance exercise test was performed for each of the 4 groups of mice. The endurance test consisted of a 3 d treadmill acclimation period where animals were placed on the treadmill with the electrical shock grid in the rear turned on for 3 min and then the treadmill speed was increased to 11 m/min for 5 min each day (14). Mice rested for 1 d before the exercise test. On the day of the test, mice began running at 11 m/min at a 5% incline, and speed was increased 2 m/min every 5 min, until the maximum speed was reached—determined by each animal’s ability to remain on the treadmill for a minimum of 20-s bouts. Failure was classified as animals remaining on the shock grid for more than 15 continuous seconds. Exercise distance and exercise duration were recorded for each animal, to assess exercise tolerance in each group of animals.
Statistical analysis
All data are means ± sem. Statistical analysis was conducted with 2-way ANOVA with post hoc tests (Student-Newman Keuls) or a Student’s t test, as appropriate. For confocal imaging experiments, we used Mander’s coefficient calculations to determine the degree of spatial overlap between the YFP signal from BRCA1 and Mitotracker DS or NucBlue signal (Thermo Fisher Scientific). Mander’s coefficient was used to determine the amount of fluorescence in colocalizing pixels for each channel. Statistical significance was set at P ≤ 0.05.
RESULTS
Mouse model
Measurements of genomic DNA demonstrated that exon 11 of the BRCA1 gene was efficiently deleted in skeletal muscle of tamoxifen-injected vs. vehicle-injected mice (Fig. 2C, D). Further, the recombination event was specific to skeletal muscle, because we did not find any evidence of recombination occurring in nonskeletal muscle tissues, nor did we find recombination occurring in vehicle-injected mice (Fig. 2C). Tamoxifen-induced flox recombination of the BRCA1 was equally efficient in both sexes of mice. The recombination event resulted in a significant reduction (78%) in Brca1 protein content of the gastrocnemius muscle (Fig. 2D), which is similar to what has been found in other conditional KO approaches. Complete loss of protein content is rarely found in induced conditional KO models, since skeletal muscle (19) contains several different cell types (i.e., neurons, fibroblasts, endothelial cells, and smooth muscle), all of which are reported to express Brca1 (20). Thus, our data confirm that Brca1 content was significantly reduced, but likely knocked out in skeletal muscle after tamoxifen injections compared to Veh injections and support our model as an inducible skeletal muscle–specific BRCA1KOsmi mouse.
Body weight, food consumption, organ mass
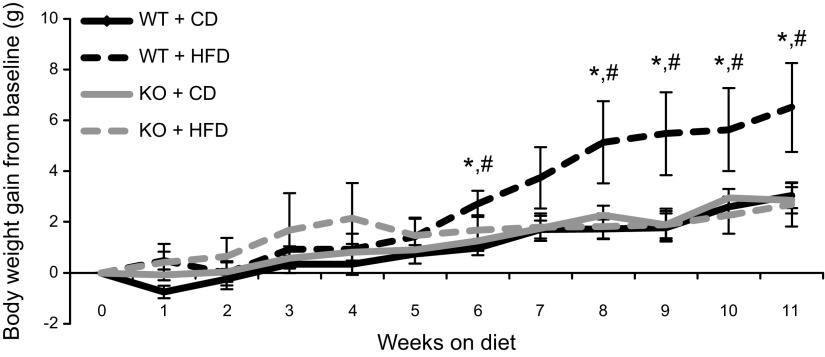
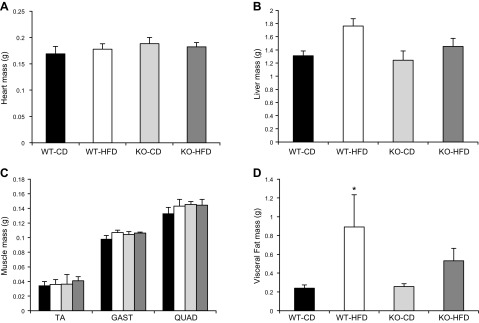
Body weight significantly increased in all groups over the course of the study; however, the WT mice fed an HFD gained significantly more weight after week 6 compared with all other groups (Fig. 3). The BRCA1KOsmi mice consumed significantly more food per day regardless of diet when compared with the WT group (Table 1). No differences were detected in heart, liver, or skeletal muscle mass (Fig. 4A–C) when comparing the WT and KO mice, regardless of diet. Fat pad mass of HFD-fed KO mice was not significantly different from those of the WT-HFD (P = 0.0809) or KO-CD (P = 0.0687) groups, although WT mice fed a 12 wk HFD exhibited significantly higher visceral fat mass compared to WT-CD mice. (Fig. 4D). Finally, in a parallel cohort of age-matched HSA-mER-Cre-mER mice that were injected with the tamoxifen protocol described above, we found no differences in body weight, food consumption, and organ mass compared to vehicle-injected mice (data not shown).
Figure 3.
Loss of functional Brca1 in skeletal muscle prevents HFD-induced increases in body weight. WT and BRCA1KOsmi mice were fed a CD or an HFD for 10 wk. After 6 wk of the diet, WT-HFD mice had significantly greater body mass than did WT-CD and BRCA1KOsmi-HFD mice (n = 7–10 mice/group). Means ± sem. *P ≤ 0.05, WT-HFD vs. WT-CD; #P ≤ 0.05, WT-HFD vs. BRCA1KOsmi-HFD.
TABLE 1.
Average food consumption of each genotype per day
| Genotype | Food consumption (g/d) | sem | Food consumption (kcal/d) | sem |
|---|---|---|---|---|
| WT-CD | 3.4 | 0.2 | 13 | 0.7 |
| WT-HFD | 3.1 | 0.2 | 14.9 | 0.8 |
| KO-CD | 3.9* | 0.3 | 15.2* | 1.3 |
| KO-HFD | 3.5* | 0.1 | 16.5* | 0.7 |
Main effect of genotype. P < 0.05 (n = 6–10 animals/group).
Figure 4.
Loss of Brca1 expression in skeletal muscle does not affect organ tissue mass, regardless of diet. WT and BRCA1KOsmi mice were placed on a CD or an HFD for 10 wk. Heart mass (A), liver mass (B), skeletal muscle mass (TA; GAST, gastrocnemius; and QUAD, quadriceps) (C), and visceral adipose tissue mass (D). After 10 wk of HFD feeding, WT-HFD mice had significantly greater visceral fat mass compared to WT-CD (n = 7–10 mice/group). Means ± sem. *P ≤ 0.05.
Glucose tolerance and insulin responses
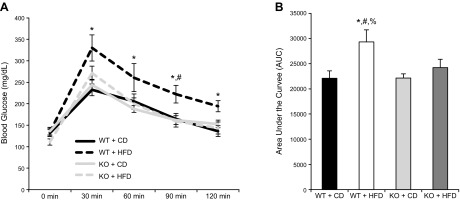
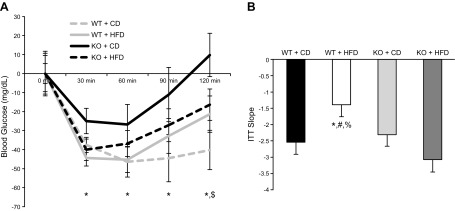
WT mice exposed to an HFD for 12 wk exhibited significantly higher glucose responses at all time points tested after an IP glucose load compared with all other groups across all the time points tested (Fig. 5A). No differences in basal glucose levels were detected across groups. Using area under the curve calculations, we found that the WT-HFD group exhibited significantly higher responses compared with the other groups (Fig. 5B). Consuming an HFD did not affect glucose tolerance in the BRCA1KOsmi mice. Using an ITT, the WT-HFD group was found to be the least responsive to insulin injection compared with all other groups (Fig. 6A). Calculation of the slope from 0 to 30 min after insulin injection demonstrated a reduced insulin response in the WT-HFD group vs. all other groups (Fig. 6B). Response to the insulin injection resulted in a main effect of genotype at 120 min after insulin injection, where blood glucose levels were elevated in WT vs. BRCA1KOsmi mice (Fig. 6A). At 30 and 120 min after insulin injection, blood glucose levels for both WT-CD and BRCA1KOsmi-HFD mice were lower than in WT-HFD mice (Fig. 6A).
Figure 5.
Deletion of Brca1 in skeletal muscle prevents HFD-induced glucose intolerance. A) No significant differences in blood glucose levels were detected across groups at baseline. After a glucose injection, blood glucose levels were higher in WT-HFD mice than in WT-CD mice at 30, 60, 90, and 120 min. *P ≤ 0.05. WT-HFD blood glucose levels were greater than BRCA1KOsmi-HFD at 90 min after glucose injection. #P ≤ 0.05. B) Total area under the curve was greater in WT-HFD mice than WT-CD mice, BRCA1KOsmi-CD mice, or BRCA1KOsmi-HFD mice (n = 6–10 mice/group). *P ≤ 0.05, WT-HFD vs. WT-CD; %P ≤ 0.05 WT-HFD vs. BRCA1KOsmi-CD; #P ≤ 0.05 WT-HFD vs. BRCA1KOsmi-HFD mice. No significant differences were detected between WT-CD and BRCA1KOsmi-CD mice.
Figure 6.
Deletion of Brca1 in skeletal muscle prevents HFD-induced insulin intolerance. A) No significant differences in blood glucose levels were detected across groups at baseline. After an IP insulin injection, blood glucose levels were higher in WT-HFD mice than in WT-CD mice at 30, 60, 90 and 120 min. *P ≤ 0.05. There was a main effect of genotype at 120 min after glucose injection. $P ≤ 0.05. B) Slope from 0 to 30 min after insulin injection was reduced in WT-HFD mice compared with WT-CD mice, BRCA1KOsmi-CD mice, and BRCA1KOsmi-HFD mice (n = 6–10 mice/group). *P ≤ 0.05, WT-HFD vs. WT-CD; %P ≤ 0.05, WT-HFD vs. BRCA1KOsmi-CD; #P ≤ 0.05, WT-HFD vs. BRCA1KOsmi-HFD.
Skeletal muscle from BRCA1KOsmi does not exhibit alterations in glycolytic enzyme protein content compared to that in age-matched WT animals
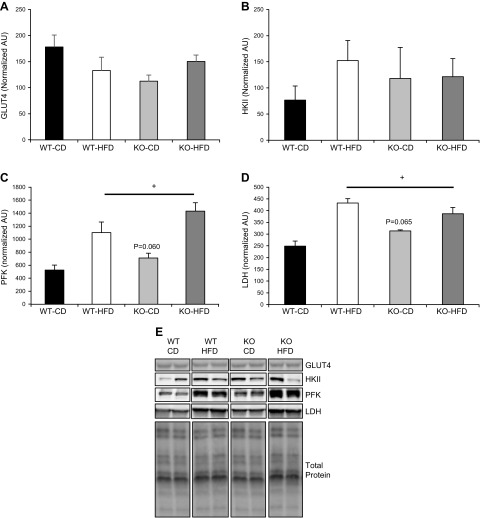
Based on the changes found in glucose tolerance and insulin responses in BRCA1KOsmi, we assessed protein content of glucose transporter (GLUT)-4 and key glycolytic enzymes including hexokinase (HK)-II, phosphofructokinase (PFK), and lactate dehydrogenase (LDH) (Fig. 7). We found no significant differences in GLUT4 content between the BRCA1KOsmi and WT mice, nor did we find an influence of diet on GLUT4 (Fig. 7A). We found no effect of genotype or diet on skeletal muscle HKII protein content (Fig. 7B). In contrast, with PFK we found a significant main effect of diet on PFK protein content in both the BRCA1KOsmi and WT mice, whereas we did not find an effect of genotype (P = 0.06) on PFK protein content (Fig. 7C). With respect to LDH, there was a significant main effect of diet on LDH protein content in both the BRCA1KOsmi and WT mice, but no effect of genotype (P = 0.065) on LDH protein content (Fig. 7D).
Figure 7.
Protein content of GLUT4 and glycolytic enzymes in skeletal muscle from age-matched WT and BRCA1KOsmi mice. A) No significant differences were detected in GLUT4 protein content in the TA muscle from age matched WT and BRCA1KOsmi mice that were fed the CD or HFD. B) No significant differences were detected in HKII protein content in the TA muscle from age-matched WT and BRCA1KOsmi mice exposed to the CD or HFD. C) PFK protein content was elevated in WT and KO mice fed an HFD. +, Main effect of diet, P ≤ 0.05. C) WT-CD vs. KO-CD. P < 0.06 (no significant difference). D) LDH protein content was higher in WT and KO mice fed an HFD. +, Main effect of diet, P ≤ 0.05. WT-CD vs. KO-CD almost reached statistical significance. (n = 4–6 mice/group). P = 0.065. E) Examples of bands measured from the Western blots from each target in each group. Please note that noncontiguous bands are shown in the examples.
BRCA1KOsmi have altered IMLC and malonyl Co-A content compared to age-matched WT animals
Using cultured human myocytes, we previously reported that decreased Brca1 expression resulted in higher lipid droplet content and reduced acetyl CoA carboxylase activity (5). In the mice, we assessed total lipid droplet content within skeletal muscle fibers by assessing cross-sections of the TA muscle using the neutral lipid stain, BODIPY (Fig. 8A). A significant main effect of lipid droplet content was detected for both diet and genotype (Fig. 8A). Specifically, animals consuming an HFD exhibited elevated lipid droplet content, whereas the BRCA1KOsmi mice had significantly less lipid droplet content compared to the WT groups. Within groups, lipid droplet content was greater in WT-HFD mice compared with WT-CD and BRCA1KOsmi-HFD mice. Similarly, IMLC in BRCA1KOsmi-HFD mice was greater than KO-CD. Confirming our previous in vitro results, we found a significant main effect of genotype in vivo, with a ∼56% lower malonyl CoA content in the KO mice vs. the WT group (Fig. 8B). No effect of diet was detected.
Figure 8.
HFD-induced IMLC accumulation is attenuated in response to loss of Brca1 in skeletal muscle. A) Lipid droplet content was significantly elevated in the TA muscle in both the WT- and BRCA1KOsmi-HFD mice compared with the WT- and BRCA1KOsmi-CD mice. BRCA1KOsmi-HFD IMLC accumulation was lower than that in WT-HFD. Means ± sem. *P ≤ 0.05 vs. WT-CD; %P ≤ 0.05 vs. BRCA1KOsmi-CD; and #P ≤ 0.05 vs. BRCA1KOsmi-HFD. B) BRCA1KOsmi exhibited decreased skeletal muscle malonyl Co-A content compared with the WT groups. HFD had no effect on malonyl Co-A content in either genotype (n = 5–6 mice/group). $P ≤ 0.05 vs. both WT groups.
BRCA1KOsmi exhibit reduced rates of mitochondrial respiration compared to that in age-matched WT animals
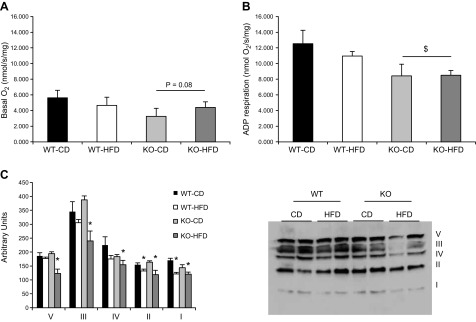
Previous work in nonmuscle tissue has implied that Brca1 protein can localize to the mitochondria; however, it is unclear whether Brca1 influences the respiration kinetics of the mitochondria. In these experiments, mitochondrial respiration was assessed using the isolated mitochondria from animals’ muscles in each group. No significant differences (P = 0.08) were detected in basal complex I (malate/glutamate, No ADP)–induced respiration in BRCA1KOsmi mice compared to WT (Fig. 9A). However, a significant main effect was detected in state 3 respiration (malate/glutamate, with ADP) in BRCA1KOsmi mice compared to WT (Fig. 9A, B). Furthermore, under basal- and ADP-stimulated conditions, the exposure of the WT or the BRCA1KOsmi group to the HFD did not further reduce mitochondrial respiration rates (Fig. 9A, B). The mitochondria isolated from BRCA1KOsmi mice fed a CD demonstrated minimal changes in mitochondrial complex content (Fig. 9C). Exposure of the BRCA1KOsmi mice to an HFD resulted in all of the mitochondrial complexes being significantly lower than in the WT-CD group, whereas the WT-HFD group demonstrated only lower complex I and II content compared to the WT-CD group. To ensure no off-target effects developed due to the tamoxifen exposure, we performed the same tamoxifen injection procedure on Cre+-only animals or in Brca (fl/fl)-only animals. We then performed skeletal muscle mitochondrial respiration experiments in the same fashion as described in Materials and Methods. We found no differences in basal (P = 0.43) or ADP (P = 0.72) stimulated respiration when comparing animals treated with tamoxifen compared to vehicle-treated animals (data not shown).
Figure 9.
Deletion of Brca1 in skeletal muscle results in reduced ADP-stimulated mitochondrial respiration in skeletal muscle. A) Basal O2 consumption was assessed in isolated mitochondria from quadriceps muscles of animals in each group after malate/glutamate delivery without ADP. There was a trend toward a main effect of genotype. P = 0.08, KO vs. WT. B) A main effect of genotype was detected in ADP stimulated respiration rates when comparing the BRCA1KOsmi to the WT groups. Means ± sem. $P ≤ 0.05. ADP respiration is the O2 consumption rate after 300 µM ADP delivery. C). BRCA1KOsmi mice consuming the CD showed minimal alterations in specific complex content with the exception of complex I in the isolated mitochondria compared to the WT animals. In contrast, BRCA1KOsmi mice fed an HFD showed significant decreases in content of all the complexes compared to the WT-CD mice (n = 5 mice/group).
Electron microscopy demonstrates that BRCA1KOsmi mice have enlarged mitochondria compared to those in age-matched WT animals
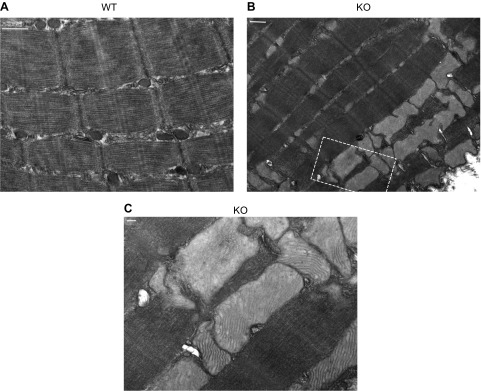
Based on the mitochondrial respiration results, we captured red gastrocnemius muscles from another cohort of animals exposed to CD to visualize muscle ultrastructure. Using CD-diet-only animals was justified, because there was no diet effect on the mitochondrial respiration data. The EM imaging demonstrated enlarged mitochondria throughout the muscle in the BRCA1KOsmi mice compared to the muscle in the age-matched WT animals (Fig. 10).
Figure 10.
Deletion of Brca1 results in dilated skeletal muscle mitochondria compared to aged-matched WT mice. Representative electron micrographs of deep gastrocnemius muscles demonstrate enlarged mitochondria in KO vs. WT mice. A) Normal muscle ultrastructure in red gastrocnemius muscle from WT male mice. Scale bar, 500 nm. B) Muscle ultrastructure imaged in red gastrocnemius muscle of age-matched male mouse KO red gastrocnemius muscle. Scale bar, 500 nm. C) High-magnification image (taken from area within the box in image B). Scale bar, 100 nm.
Skeletal muscle from BRCA1KOsmi mice do not exhibit alterations in content of key regulatory proteins of mitochondrial fission, compared with that in age-matched WT animals
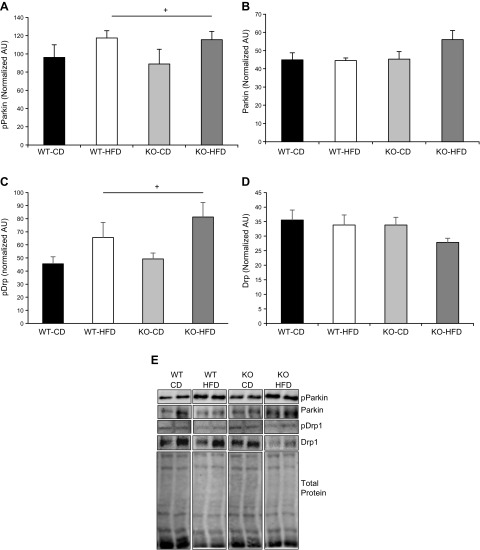
Our respiration data and electron microscopy imaging of the mitochondria suggest that deletion of BRCA1 from skeletal muscle would result in an inability to remove swollen, compromised mitochondria from the muscle cell. To test this notion, we measured the phosphorylation and total protein content of 2 key regulators of pathways that affect the quality control of the mitochondria, the ubiquitin E3-ligase Parkin, and dynamin-related protein (Drp)-1. Parkin is known to affect mitophagy, thus affecting clearance rates of mitochondria, whereas Drp1 promotes mitochondrial fission activity. We found a main effect of diet on the phosphorylation of Parkin and Drp1 in both genotypes of mice, with no effect of genotypes on either phosphorylation event (Fig. 11).
Figure 11.
Loss of BRCA1 does not affect Parkin or Drp1 phosphorylation in skeletal muscle. A, B) No significant differences were detected in GLUT4 protein content in the TA muscle from age-matched WT and BRCA1KOsmi mice that were fed normal CD or HFD. B) No significant differences were detected in HKII protein content in the TA muscle from age-matched WT and BRCA1KOsmi mice that were fed a CD or an HFD. C) PFK protein content was elevated in WT and KO exposed to an HFD. +, Main effect of diet, P ≤ 0.05. WT-CD vs. KO-CD exhibited a trend toward statistical significance. P = 0.060. D) LDH protein content was higher in WT and KO fed to an HFD. +, Main effect of diet. P ≤ 0.05. WT-CD vs. KO-CD almost reached statistical significance (n = 4–6 mice/group). P = 0.065. E) Examples of bands measured from the Western blots from each target in each group. Noncontiguous bands are shown in the examples.
BRCA1 localizes to the mitochondria in skeletal muscle
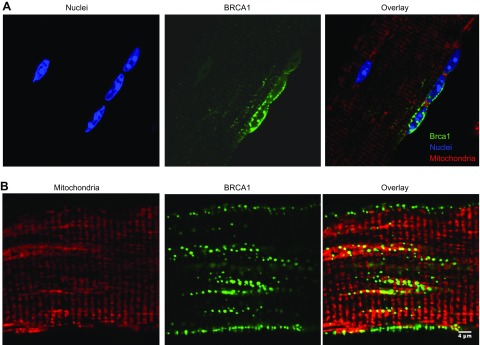
To assess Brca1 localization in skeletal muscle, a previously established somatic gene delivery approach was used (16). The assessment of endogenous murine Brca1 localization through antibody labeling is not feasible because of the poor reliability of murine-specific Brca1 antibodies. However, previous groups have shown that Brca1-YFP constructs replicate functional characteristics of endogenous Brca1 (9, 17). Using full-length BRCA1-YFP cDNA (Fig. 12A, pseudocolored green) or YFP only (data not shown), we electroporated each construct into the FDB muscle and then isolated single muscle fibers. The Brca1-YFP showed a distinct localization pattern throughout the muscle fiber, whereas YFP only exhibited a diffuse signal (data not shown). To identify compartments of Brca1-YFP localization, the muscle myonuclei (blue) and mitochondria (red, Fig. 12B) were stained. Brca1-YFP localized to multiple areas of the muscle fiber including nuclei, mitochondria, and other cytosolic compartments. Specifically, using Mander’s coefficient calculations (Table 2), we found that Brca1-YFP localizes within the nucleus and the mitochondria in adult skeletal muscle cells.
Figure 12.
BRCA1 localizes to the mitochondria and nucleus in skeletal muscle cells. Sample images of BRCA1-YFP (pseudocolored green)-positive single muscle fibers isolated from the FDB muscle after the fibers were stained for DAPI (blue) and mitochondria (red). BRCA1-YFP signal localized to specific areas of the cell. A) BRCA1-YFP and nucleus, entire cell outlined in white. B) BRCA1-YFP and mitochondria (red). Brca1-YFP exhibited discrete patterns of expression that appeared only in some mitochondria and some nuclei of each visualized muscle cell. Mander’s coefficient calculations were determined between BRCA-1-YFP and red tracker DS signal and BRCA-1-YFP and DAPI signal (Table 2). Muscle fibers positive only for YFP did not show the same localization as the BRCA1-YFP plasmid (data not shown). BRCA1-YFP localization was assessed in 20+ muscle fibers. Scale bar, 4 μm.
TABLE 2.
Colocalization of BRCA1-YFP with nucleus or mitochondria
| Statistic | Nucleus, YFP/DAPI | Mitochondria, YFP/MTDR |
|---|---|---|
| Mander’s coefficient | 0.426 ± 0.06 | 0.262 ± 0.02 |
BRCA1KOsmi mice exhibit increased Vco2, RER and energy expenditure
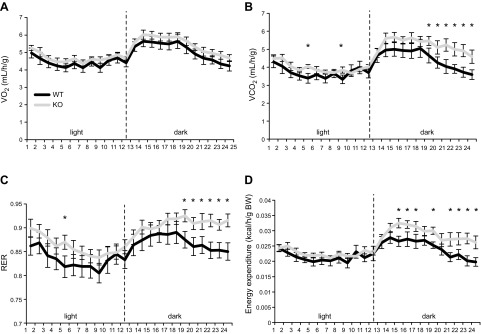
We have demonstrated that the BRCA1KOsmi mice consumed more kilocalories (independent of diet) without gaining weight, which was associated with reduced mitochondrial respiration in the KO vs. the WT mice. These results suggest that loss of Brca1 expression in skeletal muscle leads to reduced mitochondrial efficiency. To test this concept, we used a second cohort of mice and assessed whole-body indirect calorimetry of age-matched WT and KO mice. Because KO mice consumed more food and exhibited reduced mitochondrial respiration regardless of diet, only the CD diet was used. We found no differences in Vo2 consumption between groups (Fig. 13A). However, the BRCA1KOsmi mice exhibited increased whole-body Vco2, increased RER, and increased energy expenditure during the dark cycle when compared to those parameters in the age-matched WT mice (Fig. 13B–D).
Figure 13.
Ablation of Brca1 in skeletal muscle increases whole body metabolic activity. Age-matched BRCA1KOsmi and WT mice were individually housed in metabolic cages for 5 d. The first 2 d were used to acclimate the mice to the cages, with the data representing the mean data collected over the final 3 d (n = 8–12/group). Mean whole-body Vo2 (A); Vco2 (B); RER (Vco2/Vo2) (C); and energy expenditure according to body weight (D). Means ± sem (n = 6–10 mice/group). *P < 0.05, WT vs. KO.
BRCA1KOsmi mice have reduced exercise tolerance vs. age-matched WT mice
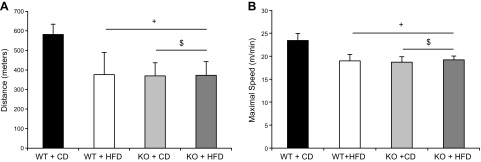
Using a well-established rodent treadmill protocol, we found a significant main effect of genotype in that the BRCA1KOsmi exhibited reducing running speeds and distances compared with those in the WT mice (Fig. 14). We also found that consuming the HFD resulted in a main-effect of reduced running speeds and distances regardless of genotype; however there was no additive effect of diet in the KO mice.
Figure 14.
Exercise tolerance is reduced with ablation of Brca1 in skeletal muscle. BRCA1KOsmi mice exhibited reduced running distances (A) and running speeds (B) compared to age-matched WT mice. Age-matched BRCA1KOsmi and WT mice were acclimated to the treadmill, and then each mouse performed an acute exercise bout after completion of the acclimation period. A main effect of genotype and diet was detected in when comparing the BRCA1KOsmi with the WT groups. Means ± sem (n = 6–8 mice/group). +P ≤ 0.05 vs. WT-CD; $ P ≤ 0.05, KO-CD vs. KO-HFD.
DISCUSSION
Using in vitro models, we had identified Brca1 as a novel regulator of metabolic function in skeletal muscle (5). In the current study, using an in vivo–based approach, we extended our previous results by demonstrating that induced loss of Brca1 in the skeletal muscle of adult mice results in reduced ADP-stimulated complex I–driven mitochondrial respiration and enlarged mitochondrial size. We also determined that Brca1 is capable of localizing to mitochondria as well as the nuclei in skeletal muscle cells. Using an exercise tolerance test, we found functional deficits in the BRCA1KOsmi when compared to the WT animals. When compared to the WT mice fed an HFD, exposure of the BRCA1KOsmi to an HFD failed to elicit similar gains in body weight and changes in insulin response and glucose tolerance. We attribute the lack of a dietary effect on BRCA1KOsmi to increased whole-body energy expenditure and differences in mitochondrial efficiency between BRCA1KOsmi and WT mice. Our data suggest that deletion of Brca1 in mouse skeletal muscle induces mitochondrial inefficiencies that allow mice to simultaneously increase food intake while attenuating weight gain. Overall, the findings clearly demonstrate that induced loss of Brca1, specifically in skeletal muscle, leads to a complex and multifaceted metabolic phenotype.
BRCA1KOsmi mice exhibited reductions in skeletal muscle mitochondrial respiration compared with the WT mice, regardless of diet. Specifically, isolated mitochondria from the BRCA1KOsmi mice exhibited reduced rates of complex I–stimulated respiration in ADP-driven conditions when compared to the WT group. In nonmuscle tissue, modulation of Brca1 expression can alter oxidative metabolism by reducing catabolism of palmitate, whereas conditional deletion of Brca1 in cardiac tissue results in decreased glucose and palmitate oxidation (4). Thus, when assessed collectively across various cell types, the data support the notion that Brca1 expression is necessary for maintenance of multiple aspects of mitochondrial function.
Brca1 overexpression in cultured breast cancer cells resulted in the reduction of glycolytic gene expression and enhanced mitochondrial gene expression (6). However, we found only minor changes in protein content of each mitochondrial complex, which is surprising, considering the differences in the mitochondrial morphology in the BRCA1KOsmi mice. Further, we did not detect significant changes in the protein content of various enzymes in glycolysis, albeit a limitation of this study is that we cannot confirm that the activities of these glycolytic enzymes did not change. The underlying mechanisms explaining how Brca1 influences mitochondrial function are largely unknown, but our data suggest that Brca1 can localize to the mitochondria in a fashion similar to that observed in MCF7 breast carcinoma cells, suggesting that Brca1 can directly influence the mitochondria (8, 9). It remains unclear how Brca1 locates to the mitochondria, because Brca1 does not contain a consensus mitochondrial localization sequence. A likely possibility is that the Brca1 protein is piggybacking into the mitochondria through an interaction with another protein that contains a mitochondrial localization sequence (17). In fact, a similar mechanism was discovered for Brca1 movement into the nucleus (17); however not all studies support our finding that Brca1 localizes in the mitochondria (21). These differences across studies may, in part, be related to the dependency on Brca1 antibodies that lack precise antigen-binding characteristics with endogenous Brca1. Alternatively, the varying results could be because Brca1 has different localization patterns depending upon the tissue type under experimental consideration.
BRCA1KOsmi mice exhibited normal glucose tolerance and no additive weight gain when exposed to an HFD compared to age-matched WT mice on the same HFD. These data suggest that loss of Brca1 attenuates the negative metabolic responses commonly associated with HFD consumption. Although the protection of the BRCA1KOsmi mice from an HFD is surprising when considering the reduction in mitochondrial respiration, there is precedence for similar results in animal models. For example, the POLG mutator mice exhibit significant losses in oxidative capacity related to the loss of a mitochondrial DNA proofreading enzyme, but remained protected from the deleterious effects of an HFD because of higher glycolytic capacities (22). A recent review of the literature found several examples of mouse models that demonstrated metabolic protection from an HFD (23), with many of the mouse models that demonstrated metabolic protection exhibiting decreases in mitochondrial respiration. Altogether, this suggests that, temporarily, an animal can adapt to exposure to nutrient overload by altering the metabolic (i.e., glycolytic) phenotype of the skeletal muscle tissue. In support of this hypothesis, the BRCA1KOsmi mice exhibited increased RER and energy expenditure during the dark cycle, suggesting that the mice were catabolizing more carbohydrate while expending an increased amount of energy compared with the WT mice. Thus, the findings suggest that deletion of exon 11 in the Brca1 gene leads to changes in the metabolic phenotype of the skeletal muscle; however, more comprehensive studies are needed to determine whether alterations in glucose utilization develop in the BRCA1KOsmi mice. Our data add to accumulating evidence suggesting that decreases in mitochondrial respiratory capacity do not necessarily correspond with increased susceptibility to glucose intolerance in HFD conditions.
The in vivo effects of Brca1 loss in skeletal muscle are in contrast to some of our previous findings where we induced acute decreases in BRCA1 expression using an shRNA based approach in cultured human myotubes (5). In cultured human myotubes, we found that reductions in BRCA1 mRNA led to reduced insulin signaling and lower insulin-induced glucose uptake. The results may have differed for several reasons. First, it is possible there are differential consequences of acute vs. chronic loss of Brca1 and our data represent an adaptation response from prolonged in vivo loss of Brca1 in the mouse model. Second, the human myotube culture model does not completely replicate the in vivo environment leading to a difference in response to Brca1 deletion. Third, it is plausible that deletion of Brca1 in mice leads to different metabolic responses compared with that in human tissue. Regardless of the reason, loss of BRCA1 in human myotubes and in skeletal muscle from BRCA1KOsmi mice results in reduced mitochondrial respiration, suggesting that Brca1 is important for mitochondrial function in skeletal muscle.
BRCA1 missense mutations resulting in partial or complete deletion of Brca1 occur in humans, but there is little to no information reported regarding the physiologic consequences of these mutations. Although BRCA1 mutations in women are frequently associated with an increased risk of tumorigenesis, our data suggested that skeletal muscle function is also altered. For example, individuals with BRCA1 mutations may have reduced mitochondrial respiration or alterations in skeletal muscle metabolic function or both; however, this has not been empirically tested. The growing number of reports regarding changes in skeletal muscle, coupled with evidence in the brain and cardiovascular system (2, 3), suggest a role for Brca1 function in tissues outside of the mammary gland. Considering the vast number of mutations in the BRCA1 gene, it is critical that more studies be pursued to address Brca1 function to identify possible cellular mechanisms regulated by the protein.
In summary, our data demonstrate for the first time that Brca1 localizes to the mitochondria in skeletal muscle and that expression of Brca1 is critical for maintenance of mitochondrial respiration. Deletion of Brca1 protects mice from developing the metabolic consequences commonly associated with an HFD. Future experiments to assess the impact of known Brca1 mutations on mitochondrial and metabolic function are critical for providing new knowledge to individuals with BRCA1 mutations.
ACKNOWLEDGMENTS
The authors thank Tom Greene (East Carolina University, Greenville, NC, USA) for technical assistance; BRCA1 plasmids were kind gift of Dr. B. Henderson (Westmead Institute for Cancer Research, Sydney, NSW Australia), and Dr. John McCarthy (University of Kentucky, Lexington, KY, USA) for numerous helpful discussions concerning animal breeding. This work was funded U.S. National Institutes of Health (NIH), National Institute of Arthritis and Musculoskeletal and Skin Diseases Grants R21AR059913, RO1AR066660, R01AR059179, and R21AR067872 (to R.M.L.); NIH National Heart, Lung, and Blood Institute Grant RO1HL125695 (to J.M.M.); and NIH National Institute on Aging Grant T32 AG000268 (to K.C.J. and A.P.V.). The authors declare no conflicts of interest.
Glossary
- Brca1
breast cancer type 1 susceptibility protein
- BRCA1KOsmi
inducible skeletal muscle-specific Brca1 knockout
- CD
control diet
- Co-A
coenzyme A
- Drp
dynamin-related protein
- FDB
flexor digitorum brevis
- GLUT
glucose transporter
- GTT
glucose tolerance test
- HFD
high-fat diet
- HK
hexokinase
- HSA
human skeleton actin
- IMLC
intramuscular lipid content
- IP
intraperitoneal
- ITT
insulin tolerance test
- KO
knockout
- LDH
lactate dehydrogenase
- mER-Cre-mER
tamoxifen-inducible Cre recombinase
- PFK
phosphofructokinase
- RER
respiratory exchange ratio
- Vco2
volume of CO2
- Veh
vehicle
- Vo2
volume of O2
- WT
wild type
- YFP
yellow fluorescent protein
AUTHORS CONTRIBUTIONS
K. C. Jackson designed the research, analyzed the data, performed the research, and wrote the paper; A. P. Valencia, M. R. Iñigo, and M. D. Tarpey designed the research, analyzed the data, and performed the research; E. E. Spangenburg analyzed data and wrote the paper; S. J. Pratt, D. J. Patteson, and D. M. Thomson analyzed the data and performed the research; and J. M. McClung and R. M. Lovering designed the research and contributed analytic tools.
REFERENCES
- 1.Roy R., Chun J., Powell S. N. (2011) BRCA1 and BRCA2: different roles in a common pathway of genome protection. Nat. Rev. Cancer 12, 68–78 [DOI] [PMC free article] [PubMed] [Google Scholar]
- 2.Pao G. M., Zhu Q., Perez-Garcia C. G., Chou S.-J., Suh H., Gage F. H., O’Leary D. D. M., Verma I. M. (2014) Role of BRCA1 in brain development. Proc. Natl. Acad. Sci. USA 111, E1240–E1248 [DOI] [PMC free article] [PubMed] [Google Scholar]
- 3.Suberbielle E., Djukic B., Evans M., Kim D. H., Taneja P., Wang X., Finucane M., Knox J., Ho K., Devidze N., Masliah E., Mucke L. (2015) DNA repair factor BRCA1 depletion occurs in Alzheimer brains and impairs cognitive function in mice. Nat. Commun. 6, 8897 [DOI] [PMC free article] [PubMed] [Google Scholar]
- 4.Lovren F., Pan Y., Quan A., Singh K. K., Khan R., Gupta N., Brezden-Masley C., Teoh H., Wheatcroft M. D., Al-Omran M., Verma S. (2014) BRCA1 shields vascular smooth muscle cells from oxidative stress. J. Thorac. Cardiovasc. Surg. 147, 1946–1955.e1 [DOI] [PubMed] [Google Scholar]
- 5.Jackson K. C., Gidlund E. K., Norrbom J., Valencia A. P., Thomson D. M., Schuh R. A., Neufer P. D., Spangenburg E. E. (2014) BRCA1 is a novel regulator of metabolic function in skeletal muscle. J. Lipid Res. 55, 668–680 [DOI] [PMC free article] [PubMed] [Google Scholar]
- 6.Privat M., Radosevic-Robin N., Aubel C., Cayre A., Penault-Llorca F., Marceau G., Sapin V., Bignon Y. J., Morvan D. (2014) BRCA1 induces major energetic metabolism reprogramming in breast cancer cells. PLoS One 9, e102438 [DOI] [PMC free article] [PubMed] [Google Scholar]
- 7.Singh K. K., Shukla P. C., Yanagawa B., Quan A., Lovren F., Pan Y., Wagg C. S., Teoh H., Lopaschuk G. D., Verma S. (2013) Regulating cardiac energy metabolism and bioenergetics by targeting the DNA damage repair protein BRCA1. J. Thorac. Cardiovasc. Surg. 146, 702–709 [DOI] [PubMed] [Google Scholar]
- 8.Coene E. D., Hollinshead M. S., Waeytens A. A., Schelfhout V. R., Eechaute W. P., Shaw M. K., Van Oostveldt P. M., Vaux D. J. (2005) Phosphorylated BRCA1 is predominantly located in the nucleus and mitochondria. Mol. Biol. Cell 16, 997–1010 [DOI] [PMC free article] [PubMed] [Google Scholar]
- 9.Maniccia A. W., Lewis C., Begum N., Xu J., Cui J., Chipitsyna G., Aysola K., Reddy V., Bhat G., Fujimura Y., Henderson B., Reddy E. S., Rao V. N. (2009) Mitochondrial localization, ELK-1 transcriptional regulation and growth inhibitory functions of BRCA1, BRCA1a, and BRCA1b proteins. J. Cell. Physiol. 219, 634–641 [DOI] [PMC free article] [PubMed] [Google Scholar]
- 10.McCarthy J. J., Srikuea R., Kirby T. J., Peterson C. A., Esser K. A. (2012) Inducible Cre transgenic mouse strain for skeletal muscle-specific gene targeting. Skelet. Muscle 2, 8 [DOI] [PMC free article] [PubMed] [Google Scholar]
- 11.Xu X., Wagner K. U., Larson D., Weaver Z., Li C., Ried T., Hennighausen L., Wynshaw-Boris A., Deng C. X. (1999) Conditional mutation of Brca1 in mammary epithelial cells results in blunted ductal morphogenesis and tumour formation. Nat. Genet. 22, 37–43 [DOI] [PubMed] [Google Scholar]
- 12.Garcia-Cazarin M. L., Snider N. N., Andrade F. H. (2011) Mitochondrial isolation from skeletal muscle. J. Vis. Exp. 49, 2452 [DOI] [PMC free article] [PubMed] [Google Scholar]
- 13.Spangenburg E. E., Pratt S. J. P., Wohlers L. M., Lovering R. M. (2011) Use of BODIPY (493/503) to visualize intramuscular lipid droplets in skeletal muscle. J. Biomed. Biotechnol. 2011, 598358 [DOI] [PMC free article] [PubMed] [Google Scholar]
- 14.Wohlers L. M., Jackson K. C., Spangenburg E. E. (2011) Lipolytic signaling in response to acute exercise is altered in female mice following ovariectomy. J. Cell. Biochem. 112, 3675–3684 [DOI] [PMC free article] [PubMed] [Google Scholar]
- 15.Stone M. R., O’Neill A., Lovering R. M., Strong J., Resneck W. G., Reed P. W., Toivola D. M., Ursitti J. A., Omary M. B., Bloch R. J. (2007) Absence of keratin 19 in mice causes skeletal myopathy with mitochondrial and sarcolemmal reorganization. J. Cell Sci. 120, 3999–4008 [DOI] [PMC free article] [PubMed] [Google Scholar]
- 16.DiFranco M., Quinonez M., Capote J., Vergara J. (2009) DNA transfection of mammalian skeletal muscles using in vivo electroporation. J. Vis. Exp. 32, 1520 [DOI] [PMC free article] [PubMed] [Google Scholar]
- 17.Henderson B. R. (2005) Regulation of BRCA1, BRCA2 and BARD1 intracellular trafficking. BioEssays 27, 884–893 [DOI] [PubMed] [Google Scholar]
- 18.Dunn K. W., Kamocka M. M., McDonald J. H. (2011) A practical guide to evaluating colocalization in biological microscopy. Am. J. Physiol. Cell Physiol. 300, C723–C742 [DOI] [PMC free article] [PubMed] [Google Scholar]
- 19.White A. T., LaBarge S. A., McCurdy C. E., Schenk S. (2015) Knockout of STAT3 in skeletal muscle does not prevent high-fat diet-induced insulin resistance. Mol. Metab. 4, 569–575 [DOI] [PMC free article] [PubMed] [Google Scholar]
- 20.Marquis S. T., Rajan J. V., Wynshaw-Boris A., Xu J., Yin G. Y., Abel K. J., Weber B. L., Chodosh L. A. (1995) The developmental pattern of Brca1 expression implies a role in differentiation of the breast and other tissues. Nat. Genet. 11, 17–26 [DOI] [PubMed] [Google Scholar]
- 21.Thompson M. E. (2010) BRCA1 16 years later: nuclear import and export processes. FEBS J. 277, 3072–3078 [DOI] [PubMed] [Google Scholar]
- 22.Wall C. E., Whyte J., Suh J. M., Fan W., Collins B., Liddle C., Yu R. T., Atkins A. R., Naviaux J. C., Li K., Bright A. T., Alaynick W. A., Downes M., Naviaux R. K., Evans R. M. (2015) High-fat diet and FGF21 cooperatively promote aerobic thermogenesis in mtDNA mutator mice. Proc. Natl. Acad. Sci. USA 112, 8714–8719 [DOI] [PMC free article] [PubMed] [Google Scholar]
- 23.Gilliam L. A. A., Neufer P. D. (2012) Transgenic mouse models resistant to diet-induced metabolic disease: is energy balance the key? J. Pharmacol. Exp. Ther. 342, 631–636 [DOI] [PMC free article] [PubMed] [Google Scholar]


