

Abstract

MALDI mass-spectrometry imaging (MALDI-MSI) is a technique capable of the label-free identification and visualization of analytes in tissue sections. We have previously applied MALDI-MSI to the study of the spatial distribution of tuberculosis (TB) drugs in necrotic lung granulomas characteristic of pulmonary TB disease, revealing heterogeneous and often suboptimal drug distributions. To investigate the impact of differential drug distributions at sites of infection, we sought to image mycobacterial biomarkers to coregister drugs and bacteria in lesion sections. The traditional method of visualizing Mycobacterium tuberculosis inside lesions is acid-fast staining and microscopy. Directly analyzing and visualizing mycobacteria-specific lipid markers by MALDI-MSI provides detailed molecular information on bacterial distributions within granulomas, complementary to high-spatial-resolution staining and microscopy approaches. Moreover, spatial monitoring of molecular changes occurring in bacteria during granuloma development can potentially contribute to a greater understanding of pulmonary-TB pathogenesis. In this study, we developed a MALDI-MSI method to detect and visualize specific glycolipids of mycobacteria within TB lesions. The biomarker signal correlated well with the bacteria visualized by IHC and acid-fast staining. This observation was seen in samples collected from multiple animal models. Although individual bacteria could not be visualized because of the limit of spatial resolution (50 μm), bacterial clusters were clearly detected and heterogeneously distributed throughout lesions. The ability to visualize drugs, metabolites, and bacterial biomarkers by MALDI-MSI enabled direct colocalization of drugs with specific bacterial target populations (identifiable by distinct metabolic markers). Future applications include assessing drug activity in lesions by visualizing drug-mediated lipid changes and other drug-induced mycobacterial metabolic responses.
Almost one-third of the world’s population is infected with M. tuberculosis (MTB), the causative agent of tuberculosis (TB), resulting in the development of the active disease in an estimated 16 million people worldwide.1 The pulmonary granuloma is the pathological hallmark of TB disease. Of the multiple morphologically distinct types of granuloma, closed necrotic lesions and cavities typically display the highest bacterial burden and correlate with poor clinical outcomes.2 Softening and subsequent liquefaction of the central caseum is thought to result in a substantial replication of the bacterial load. The ability of antituberculosis drugs to penetrate such lesions at sterilizing concentrations and reach the bacteria residing within is crucial for effective therapy.3 An effective label-free method of visualizing drug4,5 and lipid6,7 distributions within tissues can be obtained by MALDI-mass spectrometry imaging (MALDI-MSI). We have previously used MALDI-MSI to image the distribution of multiple TB drugs in pulmonary lesions in marmoset, rabbit,8 and mouse9 disease models and in clinical samples.10 Accurate colocalization of MTB populations with drug distribution is essential to determine whether the drug is reaching its target.
Bacterial burdens within tissues are traditionally visualized by acid-fast staining and microscopic examination of tissue sections.11 Because of their impenetrable, waxy cell wall, mycobacteria stain acid-fast by retaining a red dye (carbol fuchsin) after being rinsed with acid solvents (the dye is rinsed from non-acid-fast cells). The most commonly used acid-fast stains for visualizing mycobacteria are the Ziehl–Neelsen (ZN) stain and, more recently, the auramine-rhodamine stain. This technique is rapid, sensitive, and inexpensive. The targets of the various clinically used acid-fast stains are generally thought to be mycobacterial cell-wall components. However, the expression of mycolic acids and other cell-wall components, as well as their accessibility to dyes, might be variable depending on the metabolic state of the bacillary population in the specific in vitro or in vivo environment. Mycobacteria are therefore known to lose their acid-fastness under hostile environmental conditions leading to metabolic and physiological adaptations.12,13 Recently developed imaging approaches include labeling the bacteria with MTB-specific antigens (such as antigen 85)14 or using a nucleic acid binding dye (SYBR Gold).15 In contrast to the currently used acid-fast stains, SYBR Gold binds to both single- and double-stranded DNA as well as RNA, and therefore most bacteria will contain sufficient nucleic acid material to ensure consistent staining regardless of their metabolic or replicative state.16 Confocal-microscopy techniques have the advantage of identifying acid-fast and acid-negative bacteria at single-cell resolutions, but they remain time-consuming.
An alternative approach to assess bacterial loads within granulomas is the culture and quantification of colony-forming units (CFU) within homogenized granulomas. This method is highly sensitive, but it is labor- and time-intensive (colonies are required to grow for up to 6 weeks prior to counting). Additionally, because of the highly heterogeneous bacterial distributions within granulomas, homogenization causes a loss of valuable information on the spatial distribution of bacterial populations throughout the entire lesion.
The application of mass spectrometry imaging technologies to visualize microbes and microbial products has been reviewed in detail.17 Here we apply a label-free MALDI-MSI approach to detect and visualize a specific class of mycobacterial glycolipids, phosphatidyl-myo-inositol mannosides (PIMs), within TB lesions. The mycobacterial cell envelope has a multilaminate structure composed of a plasma membrane; a cell wall made of covalently linked peptidoglycan, arabinogalactan, and mycolic acids; and an outer layer of diverse glycolipids including phosphatidylinositol (PI), phosphatidylinositol mannoside (PIM), phtiocerol dimycocerosate (PDIM), trehalose dimycolate (TDM), lipoarabinomannan (LAM), lipomannan (LM), cardiolipin (CE), and phosphatidylethanolamine (PE).18,19 PIMs are highly abundant glycolipids20 conserved across all mycobacterial species; they are synthesized by mannosyltransferases from phosphatidylinositols (PI) by substitutions with up to six mannose sugars.18 The core of the PIM family is a mannosyl-phosphatidyl-myo-inositol anchor (MPI) with four potential acylation sites: positions 1 and 2 of the glycerol moiety are linked to palmitic acid and tuberculostearic acid (TBSA) residues (10-methyloctadecanoate, C19); at position 3 of the myo-inositol and position 6 of the mannosyl units, either two palmitic acids or one palmitic acid and one tuberculostearic acid are found.21,22 Position 6 of the inositol of the anchor MPI carries a chain of one to five mannose units attached to α-(1→6) and α-(1→2). PIMs are known to induce chemokine and pro-inflammatory-cytokine production from mononuclear cells through pattern-recognition receptors such as TLR-2.23,24
In this study, we applied high-mass-resolution MALDI-MSI to visualize PIMs and their precursor PIs (PI-TBSA) in pulmonary granulomas present in rabbit and mouse TB-disease models. MS imaging was performed either on the same tissue section as the histological reference stain or on an immediately adjacent one. The validity of PIM and PI-TBSA as spatial biomarkers of TB distribution was assessed by the coregistration and overlay of MALDI-MSI and acid-fast-stained-tissue microscopy images. The suitability of the MALDI-MSI approach for the simultaneous acquisition of drug and MTB-biomarker lipids was demonstrated in negative mode for the TB-drug rifampicin. A sequential-acquisition method was developed for the visualization of the TB-biomarker lipids and positive-polarity ionizing drugs in the same tissue section and was demonstrated for the drug moxifloxacin.
Experimental Section
Rabbit Experiments
All animal studies were performed in biosafety-level-3 facilities and approved by the Institutional Animal Care and Use Committee of the New Jersey Medical School, Rutgers University, Newark, NJ. Female New Zealand White (NZW) rabbits (Millbrook Farm, Concord, MA) weighing 2.2 to 2.6 kg were maintained under specific-pathogen-free conditions and fed water and chow ad libitum. The rabbits were infected with M. tuberculosis HN878 using a nose-only aerosol-exposure system as described previously.25 At 3 h postinfection, one rabbit from each round of infection was sacrificed to determine the bacterial load implanted in the lungs. At defined time points from 16 to 21 weeks postinfection, the rabbits received a single dose of 30 mg/kg rifampicin (RIF) formulated in 40% sucrose by oral gavage, seven daily doses of 30 mg/kg RIF to reach steady state, or a single dose of 100 mg/kg moxifloxacin (MXF). RIF-dosed rabbits were analyzed 6 h after the final drug dose. MXF-dosed rabbits were analyzed 12 h after the final dose. An overview of all the animals and drug-treatment schedules is shown in Table S1.
Lesion Dissection and Processing
The right and left lungs were removed and weighed for analytical drug measurement and histopathology. From each lung lobe, individual granulomas and uninvolved (nondiseased) lung-tissue sections were dissected, sized, weighed, and recorded. The lesions collected for MALDI-MS imaging were left embedded in the surrounding tissue and snap-frozen in liquid-nitrogen vapor as described previously.8
Mouse Experiments
Female specific-pathogen-free BALB/c and C3HeB/FeJ mice aged 8–10 weeks were purchased from Charles River Laboratories (Wilmington, MA) and Jackson Laboratories (Bar Harbor, ME), respectively. The mice were housed in a biosafety-level-3 animal facility and maintained with sterile bedding, water, and mouse chow. Their specific-pathogen-free status was verified by testing sentinel mice housed within the colony. This study was performed in strict accordance with the recommendations in the Guide for the Care and Use of Laboratory Animals of the National Institutes of Health. The animal protocols involving mice were approved by Colorado State University’s Institutional Animal Care and Use Committee under protocol number 14-5262A.
The M. tuberculosis Erdman strain (TMCC 107) was used for aerosol infections of the mice, and the inocula were prepared as previously described.26 Briefly, the bacteria were originally grown as a pellicle to generate low-passage seed lots. Working stocks were generated by growing to mid log phase in Proskauer–Beck medium containing 0.05% Tween 80 (Sigma Chemical Company, St. Louis, MO) in three passages, enumerated by colony counting on 7H11 agar plates, divided into 1.5 mL aliquots, and stored at −70 °C until use. C3HeB/FeJ mice were exposed to an LDA infection using a Glas-Col inhalation-exposure system as previously described,27 resulting in an average of 75 bacteria in the lungs on the day of exposure. Five mice were sacrificed the following day to determine the number of colony-forming units implanted in the lungs. Approximately 10 weeks postinfection, large caseating granulomas (type I lesions)15 and the surrounding uninvolved lung tissue were excised, frozen in liquid-nitrogen vapor over a Styrofoam cooler, placed in a clear tissue tray, wrapped in tinfoil, and immediately transferred to a dry-ice-containing cooler prior to storage at −80 °C. The samples were shipped frozen from Colorado State University to Rutgers for further analysis. An overview of all the animals and drug-treatment schedules is shown in Table S1.
MALDI-MS Analysis of Whole Bacteria
Samples were prepared following the protocol developed by Larrouy-Maumus et al.28 In brief, bacteria grown in a media solution were heat-killed at 80 °C for 30 min, spun down at 2500 rpm for 10 min, and resuspended in distilled water at an approximate concentration of 108 cells per milliliter. A diaminonaphthalene (DAN, Sigma-Aldrich, St. Louis, MO) matrix was prepared at 5 mg/mL in acetone/water (7:3). The bacteria solution (1 μL) and the matrix solution (1 μL) were deposited on the target, mixed by multiple aspiration and deposition cycles with a micropipette, and allowed to air-dry for 10 min.
Sample Preparation for MALDI-MSI Analysis
Tissue sections (12 μm) were cut from gamma-irradiated rabbit-lung-biopsy specimens using a Leica CM1850 cryostat (Walldorf, Germany) and thaw-mounted onto stainless steel slides for MALDI mass-spectrometry imaging (MALDI-MSI) or standard glass microscope slides for hematoxylin-and-eosin (H&E) staining, Ziehl–Neelsen (ZN) staining, and MALDI-MSI.
For the MALDI-MSI analysis of the rifampicin- and moxifloxacin-treated tissues, approximately 2 mL of 50% methanol containing 3 pmol/μL RIF-D3 or 3 pmol/μL MXF-D4 (TRC, Toronto, Canada) was applied to the tissues via a TM-Sprayer automated MALDI tissue-prep device (HTX Technologies, Chapel Hill, NC) under the following optimized conditions: a 0.05 mL/min flow rate, a 60 °C nozzle temperature, and a 1.3 mm/s raster speed with 20 passes over the tissue. The MXF-dosed tissues were then coated with 20 passes of a 2,5-dihydroxybenzoic acid (DHB) matrix (Sigma, St. Louis, MO) at 25 mg/mL in 50% methanol and 0.1% trifluoroacetic acid. The rifampicin-dosed tissues were coated with 20 passes of a 2′,4′,6′-trihydroxyacetophenone (THAP) matrix (Sigma, St. Louis, MO) at 20 mg/mL in 50% methanol.
MALDI Acquisition
MALDI-MSI acquisition was performed using a MALDI LTQ Orbitrap XL mass spectrometer (Thermo Fisher Scientific, Bremen, Germany) with a resolution of 60 000 at m/z 400 (full width at half maximum). The imaging data were acquired in full-scan mode to maximize sensitivity, and the drug peak identities were confirmed by acquiring several MS/MS spectra directly from the dosed tissues. The limits of detection (LOD) for RIF and MXF were 410 and 200 ng/g, calculated as described previously.10 For the negative-mode analysis (for PI-TBSA, PIM, and rifampicin), spectra were acquired across the mass range of m/z 500–2000 with a laser energy of 20 μJ and five shots per position (one microscan per position). For the positive-mode analysis (for moxifloxacin), spectra were initially acquired across the mass range of m/z 200–600 with a laser energy of 12 μJ and 10 shots per position. The laser step size was set at 50 μm, and the total analysis time for each tissue section was between 9 and 22 h. The tissue section was rinsed of the DHB matrix by submersion in 30% methanol for 1 s. A 1,5-diaminonaphthalene (DAN) matrix (Sigma, St. Louis, MO) was applied, and spectra were acquired in negative polarity across the mass range of m/z 500–2000 with a laser energy of 20 μJ and five shots per position (one microscan per position).
2D ion images were generated using Thermo ImageQuest software (v1.01). Normalized ion images of RIF were generated by dividing the RIF [M – H]− signal (m/z 821.397 ± 0.003) by the RIF-D3 [M – H]− signal (m/z 824.416 ± 0.003). Normalized ion images of MXF were generated by dividing the MXF [M + H]+ signal (m/z 402.182 ± 0.003) by the MXF-D3 [M + H]+ signal (m/z 405.201 ± 0.003).
Coregistration of MALDI-MS Images and Histology
Following the acquisition of the MALDI image, the matrix was washed from the tissue surface by immersing the slide for 10 s into a bath of 50% methanol. The tissue was then fixed by immersion for 1h in a bath of PBS with 4% paraformaldehyde prior to H&E staining. The stained tissue section was scanned using a Panoramic Desk slide scanner (3D Histech), and the full-resolution image was loaded into Adobe Photoshop CS6 (Adobe Systems, San Jose, CA). To align the H&E image and the MALDI image, the ion map of m/z 542.970 was used. This matrix-related ion was highly abundant outside the tissue and revealed the contours of the tissue border and hollow bronchioles within. The MALDI image was rescaled and aligned with the tissue using the contour and holes as guides. A green heat map of the Ac1PIM2 [M – H]− image at m/z 1413.902 was generated by Thermo ImageQuest and loaded into Adobe Photoshop CS6. The PIM image was aligned with the tissue-marker image (m/z 542.970), and a direct-overlay image was produced. To finish the alignment, the PIM image was treated with the Photoshop blending option (function “Linear Dodge (add)”), and the opacity was reduced to 70% to enable clear visualization of the bacteria.
Results and Discussion
Detection of Mycobacterial Biomarkers in Necrotic Lesions by MALDI-MSI
The extraction and MALDI-MS analysis of mycobacterial lipids from intact cultures of inactivated MTB has been previously demonstrated by Larrouy-Maumus et al.,28 who identified specific fingerprints for multiple mycobacteria species. Of the identified mycobacteria-specific lipids, PIMs were highly abundant, particularly within M. tuberculosis strains. We applied the same approach using a DAN matrix in negative mode to analyze PIMs within MTB cultures. All major PIM and acylated PIM (acPIM) species were detected (Figure 1A) as well as a phosphatidyl inositol precursor lipid composed of a tuberculostearic acid–palmitic acid chain (PI-TBSA). Next, we applied an automated-spray matrix-deposition approach to determine whether these species could be directly detected by MALDI-MS in necrotic, granuloma-containing tissue sections that had been previously demonstrated by ZN staining as containing high numbers of bacteria (Figure 1C,D). When acquiring spectra directly from the necrotic center of the granuloma, PI-TBSA (m/z 851.57) and five intact PIM species were detected: PIM2 (m/z 1175.69), Ac1PIM2 (m/z 1413.92), Ac1PIM6 (m/z 2062.13), Ac2PIM2 (m/z 1694.19), and Ac2PIM6 (m/z 2342.42, Figure 1E). The PIM profile matched the one obtained from the intact mycobacteria. MALDI-MS/MS analysis was conducted on each of the putatively identified PI and PIM peaks to confirm their identities. The product-ion spectrum from the MS/MS analysis of the ion at m/z 1413.92, putatively identified as Ac1PIM2, is shown in Figure 1G. Fragmentation of this ion revealed the loss of a palmitate (−C16, m/z 1157.53) or a tuberculostearate (−C19, m/z 1115.55), the loss of both a C16 and a C19 (m/z 859.34), or the loss of a fatty acid and a glycerol (m/z 803.36). This fragmentation profile of Ac1PIM2 matched the ones previously published,29,30 and subsequent MS/MS analyses of the of other identified PIMs were also in agreement with the published examples (data not shown). The ability to detect and identify PIM lipids directly from MTB-infected tissue sections by MALDI-MS facilitated the application of MALDI mass-spectrometry imaging (MALDI-MSI) for the visualization of bacterial distributions.
Figure 1.

Identification of mycobacteria-specific phosphatidylinositols (PIs) and phosphatidylinositol mannosides (PIMs) by the MALDI-MS analysis of intact M. tuberculosis (MTB) and MTB-infected rabbit-lung granulomas (scale bar = 2 mm). (A) MALDI-MS spectrum from intact MTB showing the major PIM species and PI-TBSA. (B) Image of H&E-stained rabbit-lung tissue featuring a large caseous granuloma. (C,D) Image of an adjacent ZN-stained whole-tissue section and a magnified region showing bacilli. (E) MALDI-MS spectrum acquired directly from the caseum of the rabbit granuloma shown in (B–D). The PIM profile shown in (A) is conserved. (F) structure of Ac1PIM2. (G) MALDI-MS/MS spectrum of Ac1PIM2 (m/z 1413). All the expected product ions are observed.
PIM Distribution Detected by MALDI-MSI Colocalizes with Bacteria
Cavitation is the most advanced stage of granuloma development and occurs when the caseous center liquefies and drains into the airways. Cavitating lesions have been shown to have high bacillary burdens and to facilitate the dissemination of the infecting bacilli from the granuloma via the airways to the external environment.31,32 An image of an H&E-stained large cavitating rabbit lesion is shown in Figure 2A, in which a central cavity is surrounded by liquefying caseum. MTB-antibody-labeling of the bacteria and confocal microscopy in an adjacent tissue section (performed as described previously),14 revealed an intense, crescent-shaped band of bacteria immediately surrounding the cavity void (Figure 2B). This distribution of bacteria was further verified by the ZN-staining of a serial section (Figure 2C–E). Although the ZN-staining of the 12 μm thick frozen tissue sections resulted in multiple artifacts (observed as purple stripes in Figure 2C), rod-shaped MTB could be clearly visualized when viewed at a high magnification (Figure 2D,E). The distribution of the acid-fast-stained MTB within the lesion was highly heterogeneous, with areas containing high bacterial counts (Figure 2D) and sparse areas with few or no bacteria present (Figure 2E). After careful analysis of the ZN-stained granuloma section, areas containing high bacterial populations were outlined in red (Figure 2F), and the overall distribution of the ZN-stained bacteria matched that of the antibody-labeled confocal image shown in Figure 2B.
Figure 2.

MALDI-MSI of PIM and PI-TBSA distributions within rabbit caseous-granuloma sections. (A) Image of H&E-stained rabbit-lung tissue featuring a large cavitating granuloma. (B) Confocal-microscopy image of MTB-specific antigen 85 within a serial tissue section. A high bacterial signal is observed in the caseum immediately surrounding the cavity void. (C) ZN-stained serial section. (D) High-magnification zoom of the caseum region containing the high bacterial load. (E) High-magnification zoom of the caseum region in which no bacteria were detected. (F) Manually drawn outline of the bacteria-dense caseum region showing similar distribution to that in (B). (G–I) MALDI-MS images of PI-TBSA, Ac1PIM2, and AC2PIM2, respectively. The distributions of the three biomarker lipids closely correlate to the distribution of antigen 85 in (B). (J) RGB overlay of the three biomarker images shown in G–I. All three markers colocalize.
The distributions of PI-TBSA and multiple PIM species were determined by MALDI-MS-imaging analysis of serial sections from the same granuloma biopsy. Ion maps for PI-TBSA, Ac1PIM2, and Ac2PIM2 are shown in Figure 2 G–I, respectively. All three lipids shared the same crescent-shaped distribution surrounding the cavity (as evidenced by the composite overlay of all three ion maps shown in Figure 2J), directly matching the distribution of bacteria visualized by antibody-labeling (Figure 2B) and ZN staining (Figure 2C–E). The precise colocalization of the PIM lipids with the bacteria indicate they are not secreted or circulate at detectable concentrations throughout the lesion and highlight their suitability as visual biomarkers of mycobacteria when analyzed by MALDI-MSI.
Heterogeneous Distribution of PIM Species Observed in a Necrotic Mouse Model
Although no differences in individual-PIM-species distributions were noted in the MALDI-MS imaging of the rabbit-lesion biopsies, differential distributions of PIM species within a single necrotic mouse lesions was observed.
The C3HeB/FeJ (also called “Kramnik”) mouse model of pulmonary TB infection has been developed as a model for assessing antituberculosis-drug efficacy.33 This model results in the production of three distinct pulmonary-lesion types, classified as type I, type II, and type III.15 Type I lesions most closely resemble classical human TB granulomas in that they develop fibrous encapsulated lung lesions with central liquefactive necrosis and abundant extracellular bacilli throughout. They comprise four distinct layers: a homogeneous, neutrophil-derived necrotic core; a dense ring of intact neutrophils surrounding the necrotic core; a thinner band of foamy (lipid-dense) macrophages; and an outermost cellular rim.
MALDI-MSI was performed on tissue sections from mouse lung lobes containing multiple type I lesions, and the distributions of PI-TBSA, Ac1PIM2, and Ac2PIM2 were plotted (Figures 3A and S1). The same tissue sections were washed to remove the matrix and stained with H&E. Intense PI-TBSA and Ac1PIM2 signals were detected throughout the necrotic cores of the three type I granulomas shown in Figure 3A. However, the Ac2PIM2 signal was observed as an outer rim at the edge of the necrotic lesion, colocalizing with the outer layer of foamy macrophages, and an inner circle, colocalizing with caseum. Little to no Ac2PIM2 signal was detected in the neutrophil-dense ring between the foamy macrophages and the inner caseum, in direct contrast to the Ac1PIM2 and PI-TBSA signals (visualized in the magnified composite overlay in Figure 3B). This interesting finding suggests either a difference in the type of PIM produced by the bacteria located within the neutrophil-rich region or differential host-cell processing of bacterial lipids within different granuloma-cell types.34,35
Figure 3.

Differential distribution of specific PIM species within distinct necrotic mouse granulomas. (A) Native MS images for each lipid displayed alongside an overlay of a coregistered H&E scan of the same tissue section after MSI acquisition. PI-TBSA and Ac1PIM2 are homogeneously distributed throughout the caseum, whereas Ac2PIM2 signal is absent in a band near the outer caseum edge. (B) Magnified regions of the MALDI-MS images and H&E overlays as indicated by the black box in (A). Note the absence of Ac2PIM2 signal within the neutrophilic ring situated between the foamy macrophages and necrotic core.
Spatial and Sensitivity Limitations
In order to assess the MALDI-MSI technique for the direct visualization of mycobacteria in tissue, it was important to evaluate the sensitivity and spatial capabilities of the approach. The commercial Orbitrap MALDI source used a laser with an approximate laser-spot diameter of 50 μm; therefore, all the tissue imaging was performed using a raster-step size of 50 μm. Because of the small size of the bacteria (2–4 μm in length), multiple bacteria would potentially be sampled in each acquisition.
In addition to the large necrotic type I granulomas, the C3HeB/FeJ mouse model produces abundant type III lesions with small foci primarily consisting of macrophages and lymphocytes and containing foamy macrophages encompassing high numbers of bacilli.15 This morphology made this kind of lesion an ideal candidate tissue for assessing the ability of the MALDI-MSI method to spatially resolve tissue areas containing high bacillary load from areas with few or no bacteria present.
Using the same mouse model shown in Figure 3, we performed a MALDI-MSI analysis on tissue sections mounted on glass microscope slides, taking the same or a subsequent tissue section for H&E histology staining (Figure 4A,B). As individual PIM species were shown to have differential distributions in bacterial populations within single mouse granulomas, bacteria in which a single PIM species is absent or below the MALDI-MSI LOD will not be detected. Hence, we summed the ion intensities from multiple PIM and PI-TBSA species to maximize coverage. The summed ion image of PI-TBSA, Ac1PIM2, and Ac2PIM2 is shown in Figure 4C. The individual ion images are shown in Figure S2. ZN-staining was conducted on the same tissue section to visualize MTB (Figure 4B), and the MS image was coregistered and overlaid on this image (Figure 4D). Small pockets of PIM signal are observed heterogeneously distributed throughout the type III lesions. Upon further magnification of the images, clear clusters of bacteria are present (Figure 4E,G), which correspond to the summed ion image of PI-TBSA and PIM (Figure 4F,H). Because of the high mass-resolving capabilities of the Orbitrap detector and the absence of isobaric endogenous peaks, false-positive pixels were not detected outside of the bacterial clusters. The limit of detection appeared to be approximately 5–10 bacteria per 50 μm2 pixel, as PIM signals could not be reproducibly detected in pixels containing fewer than 5–10 bacilli. However, the LOD is dependent upon the sufficient extraction of PI-TBSA or PIM, and this extraction efficiency may differ between the bacteria present in the acellular caseum and the intracellular bacteria residing within the macrophages.
Figure 4.
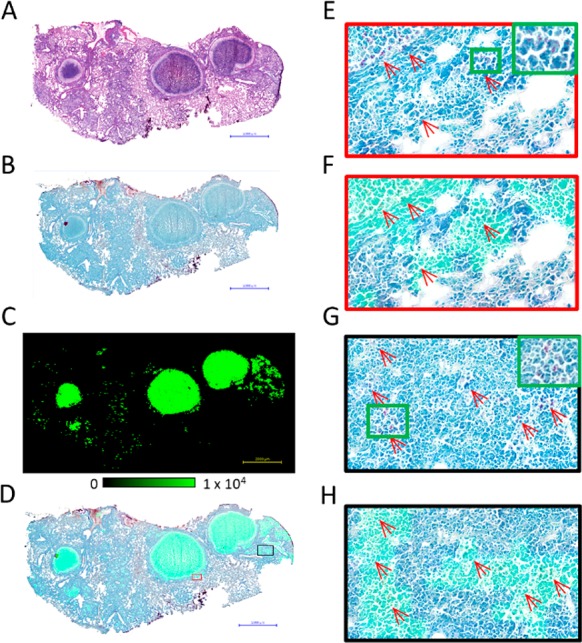
Evaluation of the spatial-resolving capabilities and sensitivity of the MALDI-MSI method (scale bar = 2 mm). (A) Image of H&E-stained mouse-lung tissue featuring multiple type I caseous granulomas. (B) Image of a serial ZN-stained whole-tissue section. (C) MALDI-MS image of the summed ion intensities of PI-TBSA, Ac1PIM2, and Ac2PIM2. (D) Coregistration and overlay of the summed ion images in (C) with the ZN-stained reference in (B). (E) Zoomed-in image of the granuloma border (red box in (D)) showing the presence of localized MTB clusters. (F) Zoomed-in image of the coregistered image shown in (D). The summed PI signal is observed to colocalize with the MTB clusters. (G) Zoomed-in image of the bacteria-rich necrotic foci in the type II lesions (black box in (D)). (H) Zoomed-in image showing PIM and MTB colocalization within the necrotic foci of the type II lesions.
Simultaneous and Sequential Imaging of Bacterial Distribution and Drug Penetration by MALDI-MSI
One of the driving factors in an effective anti-TB drug therapy is the adequate penetration of the drug into all areas of the granuloma at sterilizing concentrations (particularly the bacteria-rich caseum). We evaluated the suitability of PIM lipids as bacterial biomarkers for drug-distribution colocalization. Anti-TB drugs ionize in positive or negative mode, depending upon the specific physicochemical properties of the drug, whereas PI-TBSA and PIMs preferentially ionize in negative mode. Hence, negative-mode-ionizing TB drugs have the potential to be imaged in the same analytical run as PI-TBSA and PIMs, whereas positive-ionizing TB drugs would have to be acquired during a prior or subsequent analysis of the same tissue section. Additionally, most anti-TB drugs have molecular weights under 850 Da, but the most abundant PIM species (Ac1PIM2, Ac2PIM2, and Ac1PIM6) have molecular weights above 1400 Da. Widening the scan range may result in reduced sensitivity of drug analysis due to the saturation of the orbitrap with highly abundant endogenous molecules (lipids, peptides, and salts). Hence, PI-TBSA was selected as the optimum biomarker for bacterial imaging because of its highly abundant signal and its molecular weight falling within the typical drug-acquisition mass-scan range. As the individual PIM and PI-TBSA species within the rabbit-granuloma bacteria were colocalized, it was unnecessary to sum the ion intensities from multiple PIM species, as previously demonstrated in the mouse model.
For positive-mode-ionizing TB drugs, a two-step approach was developed, in which the drug was first analyzed in positive mode by MALDI-MS imaging of a tissue section coated by the automated deposition of a DHB matrix. After imaging, a methanol/water washing step removed the matrix. DAN matrix was then applied, and the same tissue section was reanalyzed by MALDI-MSI in negative mode. Examples of this approach for rifampicin (negative mode) and moxifloxacin (positive mode) are shown in Figure 5.
Figure 5.

Colocalization of TB drugs with the MTB biomarker (PI-TBSA). (A) H&E reference and MALDI-MS images of PI-TBSA and rifampicin (RIF) distribution in lung granulomas from a rabbit administered a single drug dose. RIF signal is not detected in the bacteria-dense necrotic core. (B) H&E reference and MALDI-MS images of PI-TBSA and RIF in lung granulomas from a rabbit administered RIF at steady state for 7 days. Two large cavities are present, and the drug is observed throughout the tissue, including in the bacteria-dense caseum surrounding the open cavity. (C) H&E reference and MALDI-MS images of PI-TBSA and moxifloxacin (MXF) from a rabbit administered a single dose. The drug signal is most abundant within the cellular rim with limited penetration into the necrotic core in which the MTB biomarker is located.
Six hours after a single dose of rifampicin, the drug was localized throughout the uninvolved lung tissue and cellular-lesion areas (Figure 5A). Low rifampicin signal was observed at the edge of the caseum; however, the drug was not detected within the central caseum in which a high PI-TBSA signal was observed, as is clear in the composite overlay image. After a steady-state dosing for 7 days, rifampicin was distributed throughout the entire biopsy, with full penetration into the bacteria-rich caseum (Figure 5B). This distribution pattern was in agreement with our previously published clinical data, in which rifampicin was shown to penetrate and accumulate within caseums at steady state.10
Moxifloxacin was observed to be primarily localized in the cellular rim of the necrotic granuloma 12 h after a single oral dose, with limited penetration into the center of the caseum (Figure 5C). PI-TBSA was heterogeneously distributed within the caseous granuloma center, and there was no evidence of delocalization by the methanol/water washing step that removed the DAN matrix (Figures 5C and S3). The overlay image clearly shows the value of this approach in evaluating the abilities of drugs to reach populations of bacteria within granulomas. However, the data must be interpreted with caution, as the limit of detection (LOD) of the MALDI-MSI technology may be higher than the concentration of the drug required for bactericidal activity.
Conclusion
We have developed a label-free MALDI-MSI method for the direct visualization of mycobacteria within thin tissue sections from TB-infected animal models. Although the MALDI-MSI method is not proposed as a replacement for traditional staining and microscopy methods, it offers unique complementary information, such as the ability to determine the distributions of individual lipid components of the mycobacterial wall. This molecular specificity enabled individual PIM species and PI-TBSA to be visualized in pulmonary granulomas from both rabbit and mouse models of active TB disease. Contrasting distributions of individual PIM lipids were observed inside morphologically distinct regions of mouse granulomas, potentially indicating that the MALDI-MSI method can resolve bacteria in different metabolic or replicative states or stages of processing by host cells. Additionally, because MALDI-MSI directly analyzes the lipid as opposed to a stain or label, it will detect bacteria regardless of their metabolic states or the intactness of their cell walls. Increases in the sensitivity and spatial-resolving capability of the method will enable smaller populations of bacteria to be identified at the single-host-cell level (10–40 μm2).
Most importantly, this approach also enables the simultaneous acquisition of ion images of drugs and pathogenic bacteria in ex vivo tissues, providing an at-a-glance qualitative readout of whether the administered drug is reaching its intended target.
In addition to visualizing mycobacteria, this technique has broad applicability to many different pathogens and disease states, with the limiting factor that pathogen-specific lipid markers must be identifiable and detectable.
Future work will focus on developing MALDI-MSI methods for other mycobacterial cell-wall lipids, including glycerophospholipids, mycolic acids, and trehalose mycolates. As the biosynthesis of some of these lipids is the site of action of some anti-TB drugs, such as isoniazid (INH) and ethionamide (ETH), there is the future potential to visualize drug-mediated lipid changes occurring directly within dosed tissues.
Acknowledgments
The authors are funded by award OPP1126594 from the Bill and Melinda Gates Foundation and by NIH grant 1S10 OD018072. We thank Jerome Nigou for helpful discussions and manuscript review, Jacques Prandi for PIM-structure interpretation, Brendan Podell for granuloma-pathology advice, and Eliseo Eugenin for confocal-microscopy assistance.
Supporting Information Available
The Supporting Information is available free of charge on the ACS Publications website at DOI: 10.1021/acs.analchem.8b00985.
MALDI-MS images of Ac1PIM2 and Ac2PIM2 localizations within tissue sections taken from three mouse-lung biopsies; MALDI-MS images of individual PIM and PI-TBSA lipids within necrotic mouse-lung lesions; MALDI-MS images of PI-TBSA from tissue sections washed in 30% methanol; and summary of animal models, infection time points, and drug-dosing schedules for the lung tissues analyzed (PDF)
The authors declare no competing financial interest.
Supplementary Material
References
- Onyebujoh P.; Rook G. A. Tuberculosis. Nat. Rev. Microbiol. 2004, 2 (12), 930–932. 10.1038/nrmicro1050. [DOI] [PubMed] [Google Scholar]
- Lenaerts A.; Barry C. E. 3rd; Dartois V. Heterogeneity in tuberculosis pathology, microenvironments and therapeutic responses. Immunol Rev. 2015, 264 (1), 288–307. 10.1111/imr.12252. [DOI] [PMC free article] [PubMed] [Google Scholar]
- Dartois V. The path of anti-tuberculosis drugs: from blood to lesions to mycobacterial cells. Nat. Rev. Microbiol. 2014, 12 (3), 159–167. 10.1038/nrmicro3200. [DOI] [PMC free article] [PubMed] [Google Scholar]
- Prideaux B.; Stoeckli M. Mass spectrometry imaging for drug distribution studies. J. Proteomics 2012, 75 (16), 4999–5013. 10.1016/j.jprot.2012.07.028. [DOI] [PubMed] [Google Scholar]
- Karlsson O.; Hanrieder J. Imaging mass spectrometry in drug development and toxicology. Arch. Toxicol. 2017, 91 (6), 2283–2294. 10.1007/s00204-016-1905-6. [DOI] [PMC free article] [PubMed] [Google Scholar]
- Gode D.; Volmer D. A. Lipid imaging by mass spectrometry - a review. Analyst 2013, 138 (5), 1289–1315. 10.1039/c2an36337b. [DOI] [PubMed] [Google Scholar]
- Carter C. L.; et al. Lipidomic dysregulation within the lung parenchyma following whole-thorax lung irradiation: Markers of injury, inflammation and fibrosis detected by MALDI-MSI. Sci. Rep. 2017, 7 (1), 10343. 10.1038/s41598-017-10396-w. [DOI] [PMC free article] [PubMed] [Google Scholar]
- Prideaux B.; et al. High-sensitivity MALDI-MRM-MS imaging of moxifloxacin distribution in tuberculosis-infected rabbit lungs and granulomatous lesions. Anal. Chem. 2011, 83 (6), 2112–2118. 10.1021/ac1029049. [DOI] [PMC free article] [PubMed] [Google Scholar]
- Irwin S. M.; et al. Bedaquiline and Pyrazinamide Treatment Responses Are Affected by Pulmonary Lesion Heterogeneity in Mycobacterium tuberculosis Infected C3HeB/FeJ Mice. ACS Infect. Dis. 2016, 2 (4), 251–267. 10.1021/acsinfecdis.5b00127. [DOI] [PMC free article] [PubMed] [Google Scholar]
- Prideaux B.; et al. The association between sterilizing activity and drug distribution into tuberculosis lesions. Nat. Med. 2015, 21 (10), 1223–1227. 10.1038/nm.3937. [DOI] [PMC free article] [PubMed] [Google Scholar]
- Burdash N. M.; et al. Evaluation of a dual-staining method for acid-fast bacilli. J. Clin Microbiol 1976, 2 (2), 149–50. [PMC free article] [PubMed] [Google Scholar]
- Deb C.; et al. A novel in vitro multiple-stress dormancy model for Mycobacterium tuberculosis generates a lipid-loaded, drug-tolerant, dormant pathogen. PLoS One 2009, 4 (6), e6077. 10.1371/journal.pone.0006077. [DOI] [PMC free article] [PubMed] [Google Scholar]
- Ulrichs T.; et al. Modified immunohistological staining allows detection of Ziehl–Neelsen-negative Mycobacterium tuberculosis organisms and their precise localization in human tissue. J. Pathol 2005, 205 (5), 633–640. 10.1002/path.1728. [DOI] [PubMed] [Google Scholar]
- Subbian S.; Eugenin E.; Kaplan G. Detection of Mycobacterium tuberculosis in latently infected lungs by immunohistochemistry and confocal microscopy. J. Med. Microbiol. 2014, 63 (11), 1432–1435. 10.1099/jmm.0.081091-0. [DOI] [PMC free article] [PubMed] [Google Scholar]
- Irwin S. M.; et al. Presence of multiple lesion types with vastly different microenvironments in C3HeB/FeJ mice following aerosol infection with Mycobacterium tuberculosis. Dis. Models & Mech. 2015, 8 (6), 591–602. 10.1242/dmm.019570. [DOI] [PMC free article] [PubMed] [Google Scholar]
- Ryan G. J.; Shapiro H. M.; Lenaerts A. J. Improving acid-fast fluorescent staining for the detection of mycobacteria using a new nucleic acid staining approach. Tuberculosis (Oxford, U. K.) 2014, 94 (5), 511–518. 10.1016/j.tube.2014.07.004. [DOI] [PubMed] [Google Scholar]
- Dunham S. J.; et al. Mass Spectrometry Imaging of Complex Microbial Communities. Acc. Chem. Res. 2017, 50 (1), 96–104. 10.1021/acs.accounts.6b00503. [DOI] [PMC free article] [PubMed] [Google Scholar]
- Jackson M. The mycobacterial cell envelope-lipids. Cold Spring Harbor Perspect. Med. 2014, 4 (10), a021105. 10.1101/cshperspect.a021105. [DOI] [PMC free article] [PubMed] [Google Scholar]
- Brennan P. J.; Nikaido H. The envelope of mycobacteria. Annu. Rev. Biochem. 1995, 64, 29–63. 10.1146/annurev.bi.64.070195.000333. [DOI] [PubMed] [Google Scholar]
- Bansal-Mutalik R.; Nikaido H. Mycobacterial outer membrane is a lipid bilayer and the inner membrane is unusually rich in diacyl phosphatidylinositol dimannosides. Proc. Natl. Acad. Sci. U. S. A. 2014, 111 (13), 4958–4963. 10.1073/pnas.1403078111. [DOI] [PMC free article] [PubMed] [Google Scholar]
- Gilleron M.; et al. Structural study of the lipomannans from Mycobacterium bovis BCG: characterisation of multiacylated forms of the phosphatidyl-myo-inositol anchor. J. Mol. Biol. 1999, 285 (5), 2147–2160. 10.1006/jmbi.1998.2438. [DOI] [PubMed] [Google Scholar]
- Gilleron M.; Quesniaux V. F.; Puzo G. Acylation state of the phosphatidylinositol hexamannosides from Mycobacterium bovis bacillus Calmette Guerin and mycobacterium tuberculosis H37Rv and its implication in Toll-like receptor response. J. Biol. Chem. 2003, 278 (32), 29880–29889. 10.1074/jbc.M303446200. [DOI] [PubMed] [Google Scholar]
- Jones B. W.; et al. Different Toll-like receptor agonists induce distinct macrophage responses. J. Leukoc Biol. 2001, 69 (6), 1036–1044. 10.1189/jlb.69.6.1036. [DOI] [PubMed] [Google Scholar]
- Vignal C.; et al. Lipomannans, but not lipoarabinomannans, purified from Mycobacterium chelonae and Mycobacterium kansasii induce TNF-alpha and IL-8 secretion by a CD14-toll-like receptor 2-dependent mechanism. J. Immunol. 2003, 171 (4), 2014–2023. 10.4049/jimmunol.171.4.2014. [DOI] [PubMed] [Google Scholar]
- Subbian S.; et al. Chronic pulmonary cavitary tuberculosis in rabbits: a failed host immune response. Open Biol. 2011, 1 (4), 110016. 10.1098/rsob.110016. [DOI] [PMC free article] [PubMed] [Google Scholar]
- Lenaerts A. J.; et al. Preclinical testing of the nitroimidazopyran PA-824 for activity against Mycobacterium tuberculosis in a series of in vitro and in vivo models. Antimicrob. Agents Chemother. 2005, 49 (6), 2294–2301. 10.1128/AAC.49.6.2294-2301.2005. [DOI] [PMC free article] [PubMed] [Google Scholar]
- Kelly B. P.; et al. Low-dose aerosol infection model for testing drugs for efficacy against Mycobacterium tuberculosis. Antimicrob. Agents Chemother. 1996, 40 (12), 2809–2812. [DOI] [PMC free article] [PubMed] [Google Scholar]
- Larrouy-Maumus G.; Puzo G. Mycobacterial envelope lipids fingerprint from direct MALDI-TOF MS analysis of intact bacilli. Tuberculosis (Oxford, U. K.) 2015, 95 (1), 75–85. 10.1016/j.tube.2014.11.001. [DOI] [PubMed] [Google Scholar]
- Hsu F. F.; et al. Structural characterization of phosphatidyl-myo-inositol mannosides from Mycobacterium bovis Bacillus Calmette Guerin by multiple-stage quadrupole ion-trap mass spectrometry with electrospray ionization. J. Am. Soc. Mass Spectrom. 2007, 18 (3), 466–478. 10.1016/j.jasms.2006.10.012. [DOI] [PMC free article] [PubMed] [Google Scholar]
- Gilleron M.; Lindner B.; Puzo G. MS/MS approach for characterization of the fatty acid distribution on mycobacterial phosphatidyl-myo-inositol mannosides. Anal. Chem. 2006, 78 (24), 8543–8548. 10.1021/ac061574a. [DOI] [PubMed] [Google Scholar]
- Leong F. J., Dartois V., Dick T., Eds. A Color Atlas of Comparative Pathology of Pulmonary Tuberculosis; CRC Press: New York, 2011. [Google Scholar]
- Canetti G.The Tubercle Bacillus; Springer: New York, 1955. [Google Scholar]
- Driver E. R.; et al. Evaluation of a mouse model of necrotic granuloma formation using C3HeB/FeJ mice for testing of drugs against Mycobacterium tuberculosis. Antimicrob. Agents Chemother. 2012, 56 (6), 3181–3195. 10.1128/AAC.00217-12. [DOI] [PMC free article] [PubMed] [Google Scholar]
- Gilleron M.; et al. Lysosomal Lipases PLRP2 and LPLA2 Process Mycobacterial Multi-acylated Lipids and Generate T Cell Stimulatory Antigens. Cell Chem. Biol. 2016, 23 (9), 1147–1156. 10.1016/j.chembiol.2016.07.021. [DOI] [PubMed] [Google Scholar]
- de la Salle H.; et al. Assistance of microbial glycolipid antigen processing by CD1e. Science 2005, 310 (5752), 1321–1324. 10.1126/science.1115301. [DOI] [PubMed] [Google Scholar]
Associated Data
This section collects any data citations, data availability statements, or supplementary materials included in this article.