

Abstract
Protein ADP-ribosylation is a post-translational modification (PTM) that plays an important role in all major cellular processes, including DNA repair, cellular signaling, and RNA metabolism. Site identification for this PTM has recently become possible through the development of several mass spectrometry based methods, a critical step in understanding the regulatory role played by mono(ADP-ribose) (MAR), poly(ADP-ribose) (PAR), and the enzymes which make these modifications: Poly(ADP-ribose) Polymerases (PARPs), best known for their role in DNA repair and as targets for chemotherapeutic PARP inhibitors. Here, we have described our method for enriching and identifying ADP-ribosylation events through the use of a phosphodiesterase to digest protein-conjugated ADP-ribose down to its attachment structure, phosphoribose. We also include here a guide to choosing between Collision-induced dissociation (CID), Higher-energy collisional dissociation (HCD) and Electron-transfer dissociation (ETD) based peptide fragmentation for the identification of phosphoribosylated peptides.
Keywords: ADP-ribosylation, poly(ADP-ribose), pADPr, MAR, mass spectrometry, MS/MS, post-translational modifications, phosphodiesterase, phosphoproteomics, phosphoenrichment, IMAC, Nudix hydrolase, RppH, NudT16, SVP, PDE, ENPP1
1 Introduction
Protein poly(ADP-ribosyl)ation (PARylation) and mono(ADP-ribosyl)ation (MARylation)—collectively, ADP-ribosylation—are increasingly being recognized for the important roles they play in cellular biology as traditional protein modifiers (in which their addition to a protein directly affects the protein’s structure or function [1,2]). In the case of PARylation, it also serves as a scaffolding element which controls the assembly and disassembly of protein complexes [3,4] such as stress granules [5], DNA repair complexes [6], and the IKK kinase complex [7,8]. Appreciation for these roles has grown along with the recognition that inhibition of PARPs (also known as ADP-ribosyltransferases), the enzymes which make MAR and PAR [9,10], is a promising therapeutic option for the treatment of cancer as well as select neurological and immunological diseases [11,12]. In this context, it is critical to understand the underlying biology of PARP inhibition and ADP-ribosylation as a cellular phenomenon. As a post-translational modification (PTM), the study of ADP-ribosylation is best aided by the global assessment of the PTM attachment sites by mass spectrometry (MS). Recent advances within the field have allowed for endogenous ADP-ribosylation site identification by MS [13–23]. Three major methods have been described to identify ADP-ribosylation sites (reviewed recently in [16,24])—progress which will aid the ADP-ribosylation field for years to come.
The method described here allows researchers to confidently identify protein MARylation and PARylation sites through the phosphoenrichment and identification of their attachment structure, phosphoribose (pR). Briefly, proteins carrying a complex mixture of polymeric PAR and monomeric MAR are denatured, reduced, alkylated, and subjected to PAR degradation by (1) a phosphodiesterase, which cleaves between phosphates, thus simplifying PAR and MAR to pR (see Fig 1), and (2) proteases to degrade proteins to peptides—a streamlined, “one pot” process which occurs without the need to change buffers or reaction tubes (see Fig 2). The phosphoribosylated peptides are pulled out of this complex mixture by performing standard phosphoenrichment with immobilized metal affinity chromatography (IMAC) resins. Finally, site identification is achieved through the LC-MS/MS aided analysis of the peptide sequences.
Figure 1. The digestion of mono- and poly(ADP-ribose) to phosphoribose.

ADP-ribose, shown here in red, can be added to proteins as a monomeric or polymeric post-translational modification, labeled here as mono(ADP-ribose) and poly(ADP-ribose), respectively. The addition of SVP, NudT16, RppH or ENPP1 will transform both PAR and MAR into phosphoribose by cleaving between the phosphates at the diester bond.
Figure 2. Methodological approach to the identification of ADP-ribosylation sites by mass spectrometry.
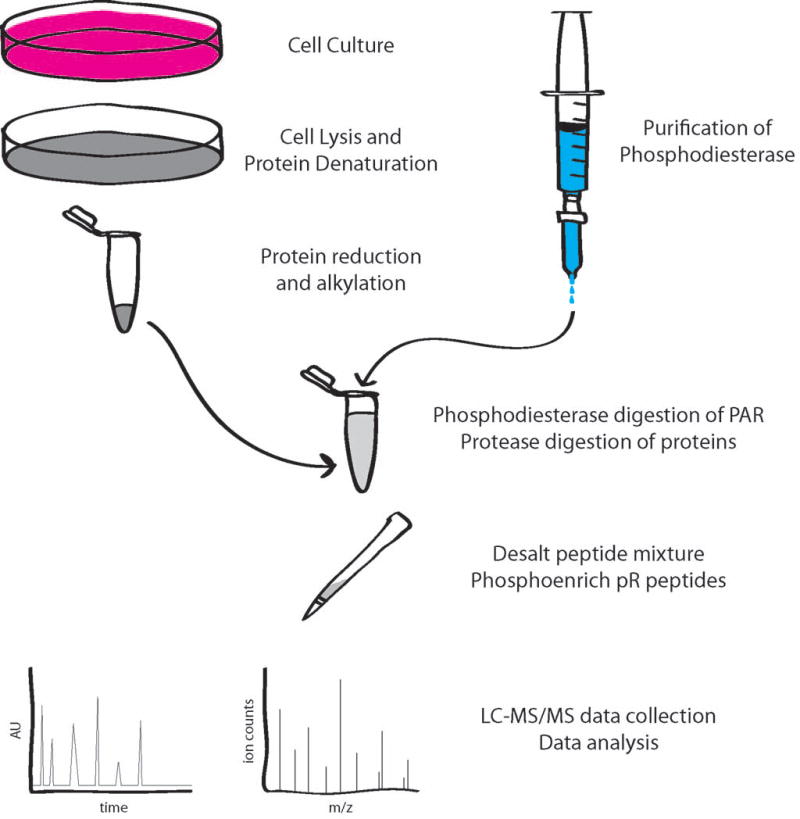
This example begins with cells in a culture dish being lysed, the proteins are then denatured, reduced and alkylated in 8 M urea. The protein mixture is next diluted to 1 M urea with the appropriate buffers and salts, and purified SVP is added to degrade the heterogeneous ADP-ribose to phosphoribose. Proteases are added to the same mixture to degrade the proteins to peptides overnight. The next day, the peptides are desalted, phosphoenriched, and analyzed on an LC-MS/MS system to ultimately yield ADPr site localization.
Development and optimization of this method has centered around several major hurdles: (1) the degradation of MAR and PAR to phosphoribose, (2) the retention of all ADP-ribosylation sites during sample processing, and (3) the confident identification of phosphoribosylation sites by MS. In the case of MAR and PAR degradation, the field has traditionally used snake venom phosphodiesterase (SVP) [25], an enzyme which is commercially available but must be purified from snake venom and therefore is subject to high lot-to-lot variability. As it is the simplest option, we have outlined its preparation and use in this example, but it is worth knowing that three alternatives have recently been proposed: the bacterial protein RppH [26] and the human protein NudT16 [27] from the Nudix family of enzymes, and the murine protein ENPP1 from the NPP enzyme family [28]. These proteins can be recombinantly expressed and purified from E. coli, making them an attractive replacement for SVP. The second hurdle—ADP-ribosylation retention—exists because MAR and PAR can be conjugated to as many as 10 different amino acids (at least in vitro)[24], allowing for attachment structures with a range of chemical and enzymatic sensitivities [29]. One of the most important considerations here is pH: many ADP-ribosylation sites are sensitive to high pH, a characterizing feature of most phosphoenrichment and MS based methodologies. Our pipeline has been designed to be performed in a neutral environment, and any modifications to this protocol should ideally maintain a neutral or acidic pH. The final consideration—optimal conditions for LC-MS/MS aided site localization—has been addressed by systematically comparing the three most popular peptide fragmentation techniques: HCD, CID and ETD (see Table 1). In short, we generally recommend fragmenting peptides by CID, as it offers the major advantage of having an extremely fast scan rate and the partial loss of the PTM (in the form of water, phosphoric acid, or the entire phosphoribose) can be diagnostic of the presence of pR. However, HCD and ETD will be advantageous in the case of certain peptides (see Fig 3), particularly large, highly charged peptides which are not generally well fragmented by CID. HCD, however, can occasionally knock the entire PTM off of the peptide, which may lead to erroneous localization of the modification site within the peptide (in exchange for high confidence peptide identification). In light of these considerations, the use of more than one fragmentation method and careful review of search engine results are always recommended.
Table 1.
The pros and cons of three popular peptide fragmentation methods.
| Fragmentation technique | CID | HCD | ETD |
|---|---|---|---|
| Collision Induced Dissociation | Higher-energy Collision Dissociation | Electron Transfer Dissociation | |
| peptide fragmentation | at the amide bond (b/y ions) | at the N-Cα bond (c/z ions) | |
| Data Collection | In the ion trap | In the orbitrap | In the ion trap |
| benefits | fastest scan rate (most sampling), loss of phosphoric acid is diagnostic | can detect low mass fragments, high mass accuracy, more fragmentation | soft fragmentation typically leaves the modification intact, allowing for cleaner spectra |
| drawbacks | lower mass accuracy than HCD, has a low-end mass cutoff, PTM fragmentation complicates spectra | slower than CID, b-ions are over fragmented, can remove pR completely | slowest scan rate (least sampling) |
| Best for | small, doubly charged peptides with a single PTM | intermediate length peptides with a low (+2, +3) charge state | long, highly charged peptides and those with multiple PTMs |
Figure 3. Examples of CID, HCD and ETD fragmentation profiles of phosphoribosylated peptides.
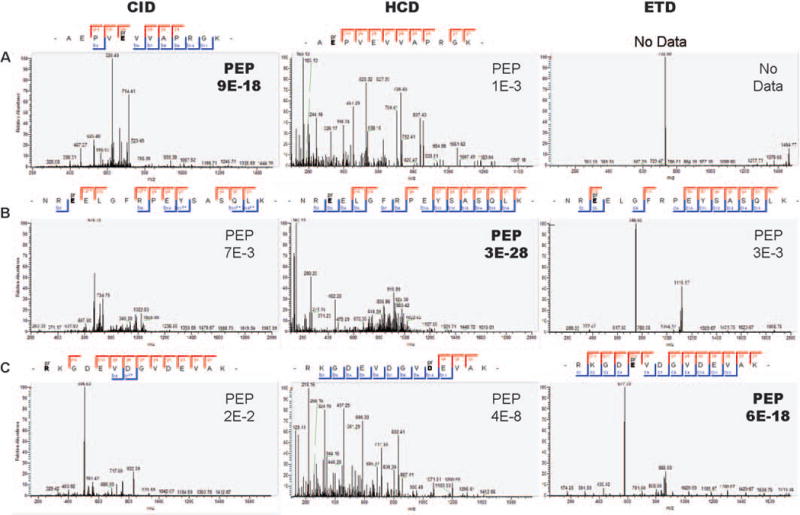
(A) A peptide containing phosphoribose on E491 of PARP1 is shown, along with the CID, HCD and ETD fragmentation profiles produced by alternative acquisition of the same precursor. In this case, z = 2, mass = 1463, and CID proved the fragmentation pattern of choice, HCD likely knocked the PTM off completely, leading to mis-localization, and ETD did not provide sufficient fragmentation for peptide assignment by MaxQuant. (B) A peptide containing phosphoribose on E168 of PARP1, here z = 3, mass = 2235, and HCD performed best, though all fragmentation methods lead to the same site assignment. (C) A highly charged peptide containing phosphoribose on E212 of PARP1, here z = 3, mass = 1728, and ETD performed best, while CID and HCD provided erroneous localization but confident peptide identification. PEP = posterior error probability, or the probability that the observed peptide spectrum match is incorrect [32].
The protein mixture analyzed here is collected from HeLa cells, however this protocol can be adapted for the analysis of a wide range of sample types, including tissue, recombinant proteins, and all cell lines, as long as researchers adhere to the basic requirements of all samples destined to be analyzed by LC-MS/MS (for example, many detergents must be avoided) and ultimately start this protocol with proteins in 8 M urea. To develop this method, we previously used a purified, recombinant protein standard—automodified human PARP1—which can be expressed and purified according to the protocol published by the Pascal lab [30] and modified with β-NAD+ in vitro [13], or purchased from Tulip BioLabs (Cat #2095). Site identification on a protein standard is essentially performed in the same way as site identification from whole cell lysate, though we will notate steps in the protocol where protein standards can be particularly helpful for troubleshooting when necessary.
2 Materials
2.1 Purification of Snake Venom Phosphodiesterase (SVP)
Phosphodiesterase I from Crotalus adamanteus venom (Worthington)
HiTrap blue sepharose column, 1 mL (GEH)
Loading/Dialysis Buffer: 10 mM Tris-Cl pH 7.5 (at room temperature), 50 mM NaCl, 15 mM MgCl2, 1% glycerol
Elution Buffer: 10 mM Tris-Cl pH 7.5 (at room temperature), 50 mM NaCl, 15 mM MgCl2, 150 mM Potassium Phosphate pH 7.5, 10% glycerol, 0.1 mg/mL BSA
1 mL and 10 mL syringes with Leur-Lok™ adapter
Blunt tipped, 18G, 1.5″ needle for use with Leur-Lok™ syringes
Ice bucket with ice
20% Ethanol
Magnetic stir plate kept at 4°C, stir bars
1 L glass beaker
Snakeskin™ dialysis tubing (22 mm I.D., 10K MWCO) and clips (ThermoFisher)
BSA standard, 10 mg/mL in water
NuPAGE® SDS-PAGE system, including: LDS Sample Buffer (4x), MOPS SDS Running Buffer (20x), and Bis-Tris 1.0 mm, 15 well, 10% gel (ThermoFisher)
SDS-PAGE Protein Ladder
Electrophoresis power supply
Heat block that can heat up to 95°C
Gel loading tips
Coomassie stain
Gel container
Sample rocker
Sheet protector
Scanner
ImageJ software (free from www.imagej.net)
2.2 Cell Lysis
Appropriate cell line and media, here we will use HeLa cells and Dulbecco’s Modified Eagle Medium (DMEM) supplemented with 10% FBS
150 mm sterile tissue culture dish
Lysis Buffer: 8 M Urea, 50 mM Tris pH 7 (at 37°C) (see Note 1)
Cell scraper
Phosphate-buffered saline (PBS), pH 7.4
Cooled bath sonicator
Benchtop centrifuge with cooling mechanism for 1.5 mL Eppendorf tubes
Protein quantification kit
2.3 Protein Reduction and Denaturation
1 M tris(2-carboxyehtyl)phosphine (TCEP) in water
500 mM chloroacetamide (CAM) in water
Heat block that can heat up to 37°C, shake up to 1000 rpm, and has a lid that keeps heat in and blocks out light.
2.4 Digestion of ADP-ribose to phosphoribose by SVP
Purified SVP (from section 3.1)
2.5 Protein Digestion
Lysyl endopeptidase (LysC), 0.5 mg/mL in water (Wako)
Modified trypsin, 0.5 mg/mL in 50 mM acetic acid (Sigma-Aldrich)
2.6 Peptide Desalting
Peptide Desalting Buffer A: 5% acetonitrile, 0.1% TFA
Peptide Desalting Buffer B: 80% acetonitrile, 0.1% TFA
Oasis® HLB 1 cc cartridge, 30 mg sorbent/cartridge, 30 μm particle size
Vacuum manifold with appropriate collection tubes, such as the Extraction Manifold from Waters
2.7 IMAC enrichment
3M Empore™ SPE Extraction Disks
Blunt tipped, 18G, 1.5″ needle
PEEK tubing, O.D. 1/16 in.
P200 tips, non-filter
Peptide Desalting Buffer A: 5% acetonitrile, 0.1% TFA
Peptide Desalting Buffer B: 80% acetonitrile, 0.1% TFA
2 mL collection tubes
Centrifuge adapters for 200 μL tips
Benchtop centrifuge
IMAC binding buffer: 0.1% Formic Acid, 40% acetonitrile
IMAC elution buffer: 0.5 M Potassium Phosphate pH 7
1% Formic Acid
PHOS-Select™ Iron Affinity Gel (Sigma-Aldrich)
Heat block that can hold samples at 25°C and shake up to 1000 rpm
2.8 LC-MS
High performance liquid chromatography system capable of 200 nL/min flow rates for sensitive LC-MS analyses
Laser puller (Sutter P2000)
10 cm × 75 μm ID fused silica capillary column pulled to ~7 μm tip, packed with 3 μm or smaller reversed phase C18 beads
High mass accuracy (~1 ppm) and resolution (R > 1500 @ m/z 400) MS instrument
HPLC Solvent A: 0.1% Acetic acid in HPLC H2O; degassed and HPLC grade
HPLC Solvent A: 0.1% Acetic acid in acetonitrile; degassed and HPLC grade
2.9 Data Analysis
MS Protein and peptide identification software, e.g., MaxQuant quantitative proteomics software package (free from www.coxdocs.org)
3 Methods
3.1 Purification of Snake Venom Phosphodiesterase (SVP)
Please note that SVP is not the only enzyme capable of cleaving ADP-ribose down to pR, human NudT16 has been shown to have comparable activity, as has RppH from E coli [26,27]. However, as SVP is the only commercially available enzyme able to cleave PAR to pR, we will focus on its preparation and use here. This protocol has been adapted from Oka et al, 1978 [25].
3.1.1 Affinity Purification
This entire purification should be performed at or near 4°C, either by keeping the materials and reagents on ice or by performing steps in a cold room (for example, during overnight dialysis).
Wash a 1 mL blue sepharose column with 5 mL of water followed by 5 mL of loading buffer. Pull water or buffer into a 10 mL syringe, attach the syringe to the column by way of the Leur-Lok™ adapter, and apply steady pressure to the plunger.
Attach a blunt-tipped needle to a 1 mL Leur-Lok™ syringe and pull up 1 mL of loading buffer. Transfer the buffer to the lyophilized SVP, dissolve the precipitate completely. Pull the sample back up in the syringe, remove the needle and expel any air from the syringe. Attach the syringe to the column and slowly load the sample, collecting the flow-through in a 1.5 mL Eppendorf tube.
Wash the column with 10 mL of loading buffer.
Elute the sample with 4 mL of elution buffer, collect (8) 0.5 mL fractions.
Wash the column with 5 mL of water, and then 5 mL of 20% Ethanol. Store at room temperature.
3.1.2 SDS PAGE analysis
Prepare BSA Standards in water: 1 mg/mL, 200 μg/mL, 40 μg/mL, 8 μg/mL.
Sample 5 μL of input, flow-through, and elution fractions, as well as BSA standards, and add each to 5 μL of 2x SDS PAGE loading buffer. Heat to 95°C for 5 minutes.
Load the protein ladder and samples onto a NuPage® Bis-Tris 1.0 mm, 15 well, 10% gel, run at 150 V until the dye front reaches the bottom of the gel. Stain with SimplyBlue™ SafeStain as per the manufacturer’s instructions. Place the cleared gel into a sheet protector and capture the image on a scanner.
Analyze the protein bands with ImageJ, constructing a standard curve from the BSA-containing bands. Based on this curve, determine the amount of protein in each fraction (1% of each sample has been loaded). Combine the fractions with high amounts of pure SVP.
Dialyze in Snakeskin™ dialysis tubing overnight at 4°C in 1 L of loading/dialysis buffer. Change the buffer once.
Collect the sample, aliquot and store it at −80°C. Optional: Run another SDS-PAGE gel with 1% of the dialyzed sample and the BSA standard curve. Calculate the final protein concentration.
3.2 Cell Lysis
This protocol has been written for adherent HeLa cells grown on 150 mm tissue culture treated dishes in DMEM supplemented with 10% FBS, but can be adapted to any cell line or primary tissue sample.
Prepare lysis buffer fresh (see Note 2) and then cool it down by setting it on top of the ice bucket or in a beaker of cool water. Ensure all urea has gone into solution, check before use as too much cooling will result in precipitation.
Remove the media from the cells, wash twice with ice-cold PBS. Drain the plate completely.
Add 500 μL of lysis buffer to each 15 cm plate, scrape the cells into the lysis buffer and then transfer the lysate to a 1.5 mL Eppendorf tube.
Ensure complete lysis by sonicating samples in a 4°C sonication bath, 3 cycles (30 seconds on, 30 seconds off) is sufficient for HeLa cells.
Spin samples for 10 minutes at 10,000 g at 4°C, save the supernatant (there may not be a pellet, it depends on the sonication efficiency).
Determine the protein concentration using a BCA kit.
Dilute all the samples in lysis buffer so that the final protein concentration is 5 μg/μL.
3.3 Protein Denaturation, Reduction and Alkylation
Transfer 100 μL (500 μg) of protein to a new 1.5 mL Eppendorf tube.
Add TCEP to a final concentration of 1 mM, incubate with shaking for 10 minutes at 37°C.
Add CAM to a final concentration of 2 mM, incubate with shaking at 1000 rpm in the dark for 10 minutes at 37°C.
3.4 Digestion of ADP-ribose to phosphoribose by SVP
Dilute all samples to a final concentration of 1 M Urea, 15 mM MgCl2, 1 mM CaCl2, and 0.25 M Tris pH 7 at 37°C (see Note 1). Add 5 μg of SVP and incubate at 37°C for 2 hours with shaking (see Notes 3 and 4 for the use of a protein standard for troubleshooting and an alternative protocol, respectively).
3.5 Protein Digestion
To the SVP digested sample, add 5 μg of LysC and 5 μg of trypsin, allow the reaction to incubate overnight at 37°C with shaking at 1000 rpm.
3.6 Peptide Clean-up/desalt
Add 800 μL of desalting buffer A to the overnight protease digestion (final volume of 1.6 mL)
Activate the 1 cc Oasis® cartridge with 1 mL of desalting buffer B, pull the buffer through by placing the cartridge onto a vacuum manifold.
Equilibrate the cartridge with 1 mL of desalting buffer A
Add the diluted sample to the cartridge, load onto the sorbent slowly.
Wash with 1 mL of desalting buffer A
Elute in 250 μL of desalting buffer B twice. Collect the eluted samples in a clean 1.5 mL Eppendorf tube.
3.7 IMAC enrichment
Dehydrate the desalted samples by spinning them in a heated SpeedVac™ under vacuum. Rehydrate them by adding 50 μL of IMAC binding buffer.
Prepare PHOS-Select™ beads by transferring 50 μL of 50% slurry to a clean Eppendorf tube and removing the buffer (leaving 25 μL of beads/sample). Wash twice with 100 μL of IMAC binding buffer each time. Leave in 25 μL of IMAC binding buffer (final volume of 50 μL).
Add peptides to the beads. Incubate for 1 hour at 25°C with shaking at 1000 rpm.
Remove the supernatant, transfer it to a fresh prep of equilibrated PHOS-Select™ beads to perform a second enrichment for 1 hour at 25°C.
Add 100 μL of IMAC binding buffer back to the first set of beads.
Prepare StageTips [31] by using the blunt tipped 18G needle to make a single punch from a folded 3M Empore™ SPE disk (effectively collecting two punches at once), place the needle into a 200 μL pipette tip and use PEEK tubing to push the punches firmly into the tip.
Place a centrifuge adaptor into a 2 mL collection tube, place a StageTip into the adaptor and transfer the apparatus to a tabletop centrifuge.
Add 50 μL of desalting buffer B to the tip to activate it, spin at a low speed for short increments of time to transfer the buffer through the C18 plug. Do not allow the tip to dry out.
Add 50 μL of desalting buffer A to the tip to equilibrate it, spin through.
Add the PHOS-Select™ beads to the equilibrated tip, spin through.
Wash with 50 μL of IMAC binding buffer, spin through. Repeat once.
Wash with 40 μL of 1% formic acid, spin through.
Elute onto the C18 stage by adding 70 μL of IMAC elution buffer and spinning through slowly. Repeat two more times.
Wash with 40 μL of 1% formic acid, spin through.
Wash with 50 μL of desalting buffer A, spin through.
Switch the adaptor and StageTip to a clean Eppendorf tube, then add 50 μL of desalting buffer B to the StageTip and slowly spin through. Discard StageTip.
Dehydrate the samples in the SpeedVac™ and bring them back up in 10 μL of desalting buffer A (UHPLC loading buffer).
Repeat steps 5–17 for the second enrichment, and 4–17 for the third and final enrichment.
3.8 nanoLC-MS/MS analyses
Inject and load re-suspended peptides onto equilibrated analytical C18 column at 3% HPLC solvent B.
Apply a suitable gradient of organic solvent for an optimized LC-MS analysis, e.g., 3–30% B over 90 min with a 200–300 nL/min flow rate. Eluting peptides should have a chromatographic peak width of ~15 secs. The goal is to separate peptides sufficiently for the MS instrument to comprehensively sample the complex mixture. See Note 5.
The MS acquisition method should apply the desired fragmentation method (e.g., CID, HCD, ETD) over the course of the LC-MS run. As an example, we use a method with one FTMS full scan (Resolution = 30 K, 3E6 ion target) to obtain high mass accuracy and resolution data for peptide precursors and Top15 CID MS/MS scans (Normal scan, 1E4 ion target) per duty cycle for complex peptide mixtures.
3.9 Data Analysis
Load the Raw files into MaxQuant (we used version 1.5.3.8), specifying that each sample has three fractions (one from each phosphoenrichment step).
Set protein, peptide and site FDRs to 0.01 and set a peptide score minimum of 40 with a delta score minimum of 17 (you can leave both the score and delta score at 0 for unmodified peptides).
Define a new modification for phosphoribose (212.01 Daltons) within Andromeda by entering the chemical composition as C5H9O7P and the specificities as D, E, K, R and C.
Set the variable modifications as phosphoribosylation (on D,E,K,R and C), phosphorylation (on S, T and Y), oxidation (on M), acetylation (at the protein N-terminus), and carbamidomethylation (on C). There are no fixed modifications.
Allow 5 peptide modifications, 2 missed cleavages, and a charge of up to 7. Set the enzyme as Trypsin.
Choose the appropriate FASTA database.
Choose the number of threads (either the number of raw files or the number of processor cores, whichever is less) and run the analysis.
Upon completion, you can browse spectra using the included viewer, or analyze the output tables found in the ‘txt’ folder (open the text files in Microsoft Excel).
Acknowledgments
The authors would like to thank Dr. Aleksandra Nita-Lazar for her helpful review of this manuscript. The proteomics work in the AKLL laboratory was funded by an NIH grant R01-GM104135, American Cancer Society Research Scholar Award 129539-RSG-16-062-01-RMC, the Safeway Research Foundation, the Patrick C. Walsh Prostate Cancer Research Fund, the Allegheny Health Network–Johns Hopkins Cancer Research Fund and the Johns Hopkins Catalyst Award. CMD was supported by an NCI training grant 5T32CA009110. SEO acknowledges funding support from NIAMS grant R01AR065459, NCI grant R21CA177402, NIBIB grant R21EB018384.
Footnotes
Tris buffers will change their pH based on temperature. In this case, pH 7 at 37°C is equal to pH 7.3 at 25°C.
Urea in water slowly degrades to form isocyanic acid, a chemical which reacts with the amino terminus as well as lysine and arginine residues of proteins. This degradation is sped up by high pH solutions and heat, both of which are generally avoided here. However, all urea solutions should be made fresh to minimize the prevalence of carbamylation by isocyanic acid.
In order to determine the extent of PAR digestion by SVP, one can sample the reaction before and after SVP digestion, run SDS-PAGE, transfer, and probe for poly(ADP-ribose) using a PAR antibody (e.g. Trevigen catalog #4336-BPC-100). As incomplete digestion of PAR to pR can ultimately result in lower site identification, this step can be optimized by adding 1 μg of a recombinant protein standard, such as automodified PARP1 (as in Daniels et al 2014 [13]), to 500 μg of whole cell lysate which can then be purified back out of the complex mixture and analyzed independently for conversion of PAR to pR.
Alternatively, proteins can be digested overnight, and SVP can be added to the reaction in the morning, thus digesting the ADPr down to pR on the peptides instead of the protein. If done this way, the PAR blot discussed in Note #3 will not be possible.
There are many LC-MS systems available from different vendors that are compatible with our protocol. We highly recommend that users optimize and evaluate their own LC-MS methods as this may be affected by many different variables, including C18 columns and packing material, analytical flow rates, LC-MS instrumentation.
References
- 1.Hottiger MO. Nuclear ADP-Ribosylation and Its Role in Chromatin Plasticity, Cell Differentiation, and Epigenetics. Annu Rev Biochem. 2015;84:227–263. doi: 10.1146/annurev-biochem-060614-034506. [DOI] [PubMed] [Google Scholar]
- 2.Gibson BA, Kraus WL. New insights into the molecular and cellular functions of poly(ADP-ribose) and PARPs. Nat Rev Mol Cell Biol. 2012;13:411–424. doi: 10.1038/nrm3376. [DOI] [PubMed] [Google Scholar]
- 3.Krietsch J, Rouleau M, Pic E, Ethier C, Dawson TM, et al. Reprogramming cellular events by poly(ADP-ribose)-binding proteins. Mol Aspects Med. 2013;34:1066–1087. doi: 10.1016/j.mam.2012.12.005. [DOI] [PMC free article] [PubMed] [Google Scholar]
- 4.Leung AK. Poly(ADP-ribose): an organizer of cellular architecture. J Cell Biol. 2014;205:613–619. doi: 10.1083/jcb.201402114. [DOI] [PMC free article] [PubMed] [Google Scholar]
- 5.Leung AK, Vyas S, Rood JE, Bhutkar A, Sharp PA, et al. Poly(ADP-ribose) regulates stress responses and microRNA activity in the cytoplasm. Mol Cell. 2011;42:489–499. doi: 10.1016/j.molcel.2011.04.015. [DOI] [PMC free article] [PubMed] [Google Scholar]
- 6.Malanga M, Althaus FR. The role of poly(ADP-ribose) in the DNA damage signaling network. Biochem Cell Biol. 2005;83:354–364. doi: 10.1139/o05-038. [DOI] [PubMed] [Google Scholar]
- 7.Hinz M, Stilmann M, Arslan SC, Khanna KK, Dittmar G, et al. A cytoplasmic ATM-TRAF6-cIAP1 module links nuclear DNA damage signaling to ubiquitin-mediated NF-kappaB activation. Mol Cell. 2010;40:63–74. doi: 10.1016/j.molcel.2010.09.008. [DOI] [PubMed] [Google Scholar]
- 8.Stilmann M, Hinz M, Arslan SC, Zimmer A, Schreiber V, et al. A nuclear poly(ADP-ribose)-dependent signalosome confers DNA damage-induced IkappaB kinase activation. Mol Cell. 2009;36:365–378. doi: 10.1016/j.molcel.2009.09.032. [DOI] [PubMed] [Google Scholar]
- 9.Hottiger MO. SnapShot: ADP-Ribosylation Signaling. Mol Cell. 2015;58:1134–1134 e1131. doi: 10.1016/j.molcel.2015.06.001. [DOI] [PubMed] [Google Scholar]
- 10.Schreiber V, Dantzer F, Ame JC, de Murcia G. Poly(ADP-ribose): novel functions for an old molecule. Nat Rev Mol Cell Biol. 2006;7:517–528. doi: 10.1038/nrm1963. [DOI] [PubMed] [Google Scholar]
- 11.Rouleau M, Patel A, Hendzel MJ, Kaufmann SH, Poirier GG. PARP inhibition: PARP1 and beyond. Nat Rev Cancer. 2010;10:293–301. doi: 10.1038/nrc2812. [DOI] [PMC free article] [PubMed] [Google Scholar]
- 12.Lord CJ, Tutt AN, Ashworth A. Synthetic lethality and cancer therapy: lessons learned from the development of PARP inhibitors. Annu Rev Med. 2015;66:455–470. doi: 10.1146/annurev-med-050913-022545. [DOI] [PubMed] [Google Scholar]
- 13.Daniels CM, Ong SE, Leung AK. A phosphoproteomic approach to characterize protein mono and poly(ADP-ribosyl)ation sites from whole cell lysate. J Proteome Res. 2014;13(8):3510–3522. doi: 10.1021/pr401032q. [DOI] [PMC free article] [PubMed] [Google Scholar]
- 14.Zhang Y, Wang J, Ding M, Yu Y. Site-specific characterization of the Asp- and Glu-ADP-ribosylated proteome. Nat Methods. 2013;10:981–984. doi: 10.1038/nmeth.2603. [DOI] [PubMed] [Google Scholar]
- 15.Chapman JD, Gagne JP, Poirier GG, Goodlett DR. Mapping PARP-1 auto-ADP-ribosylation sites by liquid chromatography-tandem mass spectrometry. J Proteome Res. 2013;12(4):1868–1880. doi: 10.1021/pr301219h. [DOI] [PubMed] [Google Scholar]
- 16.Rosenthal F, Hottiger MO. Identification of ADP-ribosylated peptides and ADP-ribose acceptor sites. Front Biosci (Landmark Ed) 2014;19:1041–1056. doi: 10.2741/4266. [DOI] [PubMed] [Google Scholar]
- 17.Rosenthal F, Messner S, Roschitzki B, Gehrig P, Nanni P, et al. Identification of distinct amino acids as ADP-ribose acceptor sites by mass spectrometry. Methods Mol Biol. 2011;780:57–66. doi: 10.1007/978-1-61779-270-0_4. [DOI] [PubMed] [Google Scholar]
- 18.Tao Z, Gao P, Liu HW. Identification of the ADP-ribosylation sites in the PARP-1 automodification domain: analysis and implications. J Am Chem Soc. 2009;131:14258–14260. doi: 10.1021/ja906135d. [DOI] [PubMed] [Google Scholar]
- 19.Gagne JP, Ethier C, Defoy D, Bourassa S, Langelier MF, et al. Quantitative site-specific ADP-ribosylation profiling of DNA-dependent PARPs. DNA Repair (Amst) 2015;30:68–79. doi: 10.1016/j.dnarep.2015.02.004. [DOI] [PubMed] [Google Scholar]
- 20.Hengel SM, Goodlett DR. A Review of Tandem Mass Spectrometry Characterization of Adenosine Diphosphate-Ribosylated Peptides. Int J Mass Spectrom. 2012;312:114–121. doi: 10.1016/j.ijms.2011.06.003. [DOI] [PMC free article] [PubMed] [Google Scholar]
- 21.Matic I, Ahel I, Hay RT. Reanalysis of phosphoproteomics data uncovers ADP-ribosylation sites. Nat Methods. 2012;9:771–772. doi: 10.1038/nmeth.2106. [DOI] [PMC free article] [PubMed] [Google Scholar]
- 22.Vyas S, Matic I, Uchima L, Rood J, Zaja R, et al. Family-wide analysis of poly(ADP-ribose) polymerase activity. Nat Commun. 2014;5:4426. doi: 10.1038/ncomms5426. [DOI] [PMC free article] [PubMed] [Google Scholar]
- 23.Rosenthal F, Nanni P, Barkow-Oesterreicher S, Hottiger MO. Optimization of LTQ-Orbitrap Mass Spectrometer Parameters for the Identification of ADP-Ribosylation Sites. J Proteome Res. 2015;14:4072–4079. doi: 10.1021/acs.jproteome.5b00432. [DOI] [PubMed] [Google Scholar]
- 24.Daniels CM, Ong SE, Leung AK. The Promise of Proteomics for the Study of ADP-Ribosylation. Mol Cell. 2015;58:911–924. doi: 10.1016/j.molcel.2015.06.012. [DOI] [PMC free article] [PubMed] [Google Scholar]
- 25.Oka J, Ueda K, Hayaishi O. Snake venom phosphodiesterase: simple purification with Blue Sepharose and its application to poly(ADP-ribose) study. Biochem Biophys Res Commun. 1978;80:841–848. doi: 10.1016/0006-291x(78)91321-9. [DOI] [PubMed] [Google Scholar]
- 26.Daniels CM, Thirawatananond P, Ong SE, Gabelli SB, Leung AK. Nudix hydrolases degrade protein-conjugated ADP-ribose. Sci Rep. 2015;5:18271. doi: 10.1038/srep18271. [DOI] [PMC free article] [PubMed] [Google Scholar]
- 27.Palazzo L, Thomas B, Jemth AS, Colby T, Leidecker O, et al. Processing of Protein ADP-ribosylation by Nudix Hydrolases. Biochem J. 2015;468(2):293–301. doi: 10.1042/BJ20141554. [DOI] [PMC free article] [PubMed] [Google Scholar]
- 28.Palazzo L, Daniels CM, Nettleship JE, Rahman N, McPherson RL, et al. ENPP1 processes protein ADP-ribosylation in vitro. FEBS J. 2016 doi: 10.1111/febs.13811. [DOI] [PMC free article] [PubMed] [Google Scholar]
- 29.Cervantes-Laurean D, Jacobson EL, Jacobson MK. Preparation of low molecular weight model conjugates for ADP-ribose linkages to protein. Methods Enzymol. 1997;280:275–287. doi: 10.1016/s0076-6879(97)80119-x. [DOI] [PubMed] [Google Scholar]
- 30.Langelier MF, Planck JL, Servent KM, Pascal JM. Purification of human PARP-1 and PARP-1 domains from Escherichia coli for structural and biochemical analysis. Methods Mol Biol. 2011;780:209–226. doi: 10.1007/978-1-61779-270-0_13. [DOI] [PubMed] [Google Scholar]
- 31.Rappsilber J, Ishihama Y, Mann M. Stop and go extraction tips for matrix-assisted laser desorption/ionization, nanoelectrospray, and LC/MS sample pretreatment in proteomics. Anal Chem. 2003;75:663–670. doi: 10.1021/ac026117i. [DOI] [PubMed] [Google Scholar]
- 32.Kall L, Storey JD, MacCoss MJ, Noble WS. Posterior error probabilities and false discovery rates: two sides of the same coin. J Proteome Res. 2008;7:40–44. doi: 10.1021/pr700739d. [DOI] [PubMed] [Google Scholar]