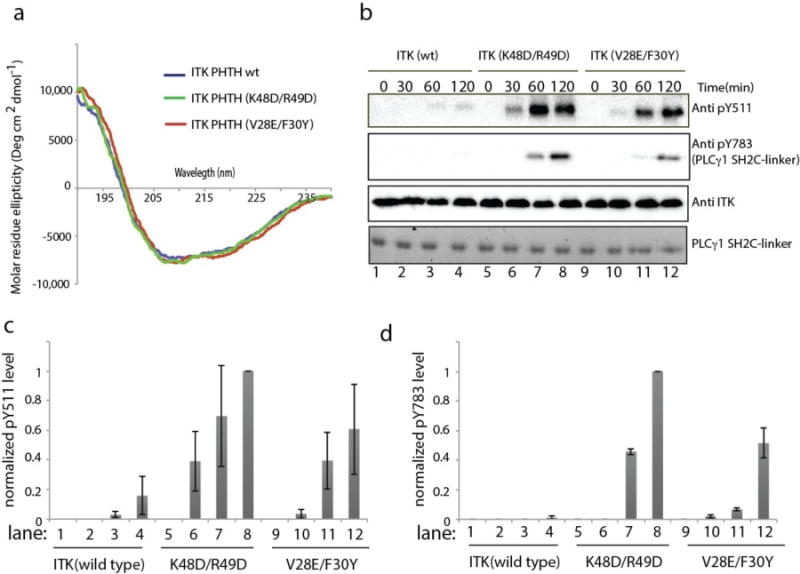
Figure 4. Mutation of the ITK PHTH interface residues in full length ITK increases ITK catalytic activity.

(a) Circular dichroism spectra for wild type ITK PHTH (blue), ITK PHTH (K48D/R49D) (green) and ITK PHTH (V28E/F30Y) (red). (b) Kinase assay spanning 0-120 minutes showing ITK activation loop autophosphorylation (pY511) and phosphorylation of exogenous PLCγ1 (pY783) for full length, wild type ITK (150 nM) in lanes 1-4, full length ITK mutant K48D/R49D (150 nM) in lanes 5-8, and full length ITK mutant V28E/F30Y (150 nM) in lanes 9-12. Phosphorylation of ITK Y511 is detected using anti-BTK pY551 (labeled Anti pY511 for clarity throughout), PLCγ1 pY783 levels are detected using anti-pY783 antibody and total enzyme levels are detected using anti-ITK antibody. Total PLCγ1 substrate levels (SH2C-linker) are detected using Coomassie stain. (c,d) Histogram representation of normalized pY511 (c) and pY783 (d) levels from the ITK kinase assays shown in (b). The intensities of the band corresponding to pY511 and pY783 were divided by the total ITK enzyme level in each lane. The value of these ratios for ITK (K48D/R49D) at time point 120 minutes was set to 1. All other intensity ratios are shown relative to this value. Experiments were run in triplicate.
