

SUMMARY
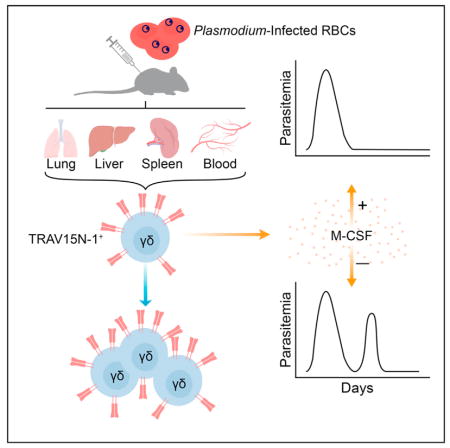
Despite evidence that γδ T cells play an important role during malaria, their precise role remains unclear. During murine malaria induced by Plasmodium chabaudi infection and in human P. falciparum infection, we found that γδ T cells expanded rapidly after resolution of acute parasitemia, in contrast to αβ T cells that expanded at the acute stage and then declined. Single-cell sequencing showed that TRAV15N-1 (Vδ6.3) γδ T cells were clonally expanded in mice and had convergent complementarity-determining region 3 sequences. These γδ T cells expressed specific cytokines, M-CSF, CCL5, CCL3, which are known to act on myeloid cells, indicating that this γδ T cell subset might have distinct functions. Both γδ T cells and M-CSF were necessary for preventing parasitemic recurrence. These findings point to an M-CSF-producing γδ T cell subset that fulfills a specialized protective role in the later stage of malaria infection when αβ T cells have declined.
In Brief
γδ T cell frequency increases late during mouse and human malaria. Mamedov et al. show that oligoclonal TRAV15N-1 (Vδ6.3) γδ T cells expand across various tissues and prevent late-stage parasitemic recurrence. These protective γδ T cells exhibit a distinct transcriptional profile that includes abundantly expressed M-CSF, which protects against Plasmodium recurrence.
INTRODUCTION
In 2015, there were an estimated 212 million new cases of malaria worldwide, with approximately 429,000 deaths (World Health Organization, 2016). With the emergence of Plasmodium falciparum strains that are resistant to artemisinin-based first-line treatments, developing a highly efficacious vaccine continues to be the most promising solution to the global malaria burden (Ashley et al., 2014; Cowman et al., 2016). Therefore, understanding the entire adaptive immune response against Plasmodium infection is of considerable importance. While much is known about the role of humoral and αβ T cell-mediated immunity during malaria, the role of γδ T cells remains the least understood aspect of the adaptive immune response.
P. falciparum infection in children, malaria-naive adults, and malaria-experienced adults has been shown to result in the expansion of γδ T cells (Ho et al., 1994; Hviid et al., 2001; Roussilhon et al., 1994). In volunteers immunized with attenuated P. falciparum sporozoites, γδ T cell expansion and frequency was the best correlate of protection compared to all other cellular immune responses (Ishizuka et al., 2016; Seder et al., 2013). Allowing for precise kinetics, controlled human malaria infections have shown that γδ T cells in malaria-naive adults expand late after infection, with elevated cell frequencies and enhanced responsiveness to stimulation with P. falciparum persisting for over 1 year (Teirlinck et al., 2011). Similarly, mice infected with the rodent-specific Plasmodium chabaudi parasite experienced a 10-fold expansion of γδ T cells (Langhorne et al., 1993; van der Heyde et al., 1993). Mice deficient in γδ T cells have been shown to experience substantial parasitemic recurrence, commonly referred to as recrudescence, during P. chabaudi infection (Langhorne et al., 1995; Seixas et al., 2002; Weidanz et al., 1999). Obtained either from P. falciparum-infected human subjects or P. chabaudi-infected mice, γδ T cells have been shown to be a major source of interferon-γ (IFN-γ)—the cytokine most commonly associated with protection against malaria (McCall and Sauerwein, 2010; Seixas and Langhorne, 1999; Teirlinck et al., 2011). However, whether IFN-γ or some other γδ T cell-derived factor is responsible for preventing recrudescent parasitemia in the later stages of infection has not been established.
Additionally, the role of the γδ T cell receptor (γδTCR) in anti-malarial protection has not been fully elucidated. Human infection or inoculation with P. falciparum parasites elicits a response from Vγ9Vδ2 γδ T cells, which comprise about 75% of all γδ T cells found in peripheral blood of healthy individuals (Ishizuka et al., 2016; Roussilhon et al., 1994). No such stereotypical response has been established in the mouse models of malaria. Beyond identifying the V-region usage of the responsive γδ T cells, the clonality of the responding γδ T cells has remained a mystery in both human and mouse malaria. In the absence of this information, it is yet to be established whether the increased γδ T cell frequency can be ascribed to TCR-driven clonal expansion or peripheral recruitment.
Here, we demonstrated the substantial expansion and activation of a specific type of γδ T cells following infection of mice with P. chabaudi. The kinetics of these γδ T cells showed a pronounced difference from αβ T cells, suggesting a specialized role in the late stage of disease following the resolution of acute parasitemia. Similarly, we observed a late activation of γδ T cells in malaria-naive volunteers infected with P. falciparum. Using single-cell TCR sequencing, whole transcriptome analysis, and flow cytometry, we found that the expansion during P. chabaudi infections was restricted to specific clones of TRAV15N-1 (Vδ6.3) γδ T cells, which expressed a specific set of soluble factors known to recruit and shape the myeloid compartment (the cytokines M-CSF, CCL3, CCL5). This demonstrated that a subset of γδ T cells defined by a restricted TCR repertoire and a distinct functional profile protects against late stage P. chabaudi parasitemia in a TCR-dependent manner, which activates a specific transcriptional program. More broadly, these data further show that the asymptomatic period following acute parasitemia is much more immunologically complex than previously appreciated.
RESULTS
Plasmodium Infection Induces γδ T Cell Expansion and Activation
To assess the expansion and activation dynamics of all major T cell subsets, we performed a broad immunophenotyping study on CD4+ and CD8+ αβ T cells and γδ T cells. Using a mouse model of blood-stage malaria induced by intraperitoneal injection of red blood cells infected (iRBCs) by Plasmodium chabaudi chabaudi AJ strain (Pcc AJ) (Figure 1A), we followed the cell frequency and activation kinetics of T cells in the blood and spleen. The γδ T cells increased in frequency and upregulated activation markers only after the acute parasitemia has resolved. The γδ T cell frequency and level of activation continued to increase and peaked at 21 days post-infection (d.p.i.), when the frequency of γδ T cells had multiplied 30-fold over baseline frequencies in the blood and 15-fold over baseline in the spleen (Figures 1B and 1C). The frequency of CD4+ and CD8+ αβ T cells initially decreased in the blood and spleen after the infection started, with a recovery in the frequency of blood-borne CD4+ αβ T cells around peak parasitemia (Figure S1A). Absolute counts of CD4+ and CD8+ αβ T cells reached their maximum numbers at the time of highest parasitemia, which corresponds to the peak in splenomegaly (Figures S1B and S1C).
Figure 1. γδ T Cells Are Expanded and Activated after Resolution of Acute Parasitemia.

(A) Parasitemia of C57BL/6 mice injected intraperitoneally (i.p.) with 105 red blood cells infected with P. chabaudi chabaudi AJ strain (Pcc AJ-iRBCs).
(B and C) γδ T cell frequency of live cells (B) and absolute numbers (C).
(D) Flow cytometry plots of CD11a and CD49d expression on blood-borne γδ T cells in naive animals and at 21 d.p.i.
(E and F) Frequency of activated (CD11a+CD49d+) γδ T cells (E) and CD4+ and CD8+ αβ T cells (F).
(A–F) n = 4 mice per time-point. Data shown as mean ± SEM from one experiment. See also Figures S1 and S2.
To measure T cell activation, we stained for CD11a and CD49d, which are established markers of T cell activation during murine malaria (Butler et al., 2011). γδ T cell activation dynamics mirrored the expansion timeline, with 92% of blood-borne and 44% of splenic γδ T cells exhibiting an activated profile at 21 d.p.i. (Figures 1D and 1E). Meanwhile, activation of CD4+ and CD8+ αβ T cells in the blood generally mimicked the changes in parasitemia, with a delay of about 4 days in the spleen (Figure 1F). The expression of CD62L and CD44 recapitulated the same activation patterns in αβ T cells (Figure S2). The contrasting timelines of cell frequency and activation changes observed in αβ T cells and γδ T cells suggested that the γδ T cell compartment plays a role in the post-acute stage of the infection.
Human γδ T Cells Are More Frequent and Highly Activated Late after Malaria Infection
In studies of P. falciparum infections in malaria-endemic regions, determining true kinetics of the observed phenomena is difficult in the absence of a defined infection start time. Controlled human malaria infections (CHMI) in malaria-naive subjects exposed to blood meals of P. falciparum-infected mosquitoes have allowed for more precise dissection of cellular responses following infection. In particular, the frequency of γδ T cells has been shown to be increased at late time-points (35 d.p.i. and later) after CHMI (Teirlinck et al., 2011). Having observed the parallel phenomenon of increased γδ T cell frequency after acute malaria resolved in the mouse malaria model, we sought to determine whether the late activation profile observed in murine γδ T cell was also observed during human P. falciparum infections.
We examined peripheral blood mononuclear cells from 5 healthy subjects, each bitten by 5 Plasmodium-infected mosquitoes and administered anti-malarial treatment once developing parasitemia. As previously reported, the frequency of γδ T cells at 35 d.p.i. was significantly increased compared to the pre-infection levels, with the starting average frequency of 5.5% increasing to 13.6% of live cells at 35 d.p.i. Slight, yet significant, drops in frequency after infection were observed for B cells and CD56bright natural killer (NK) cells, while no difference was observed in the αβ T cell and CD56dim NK cell compartments (Figure 2A). Phenotypic characterization of the γδ T cells revealed that there was a significant upregulation of the effector memory (CD45RA−CD27−) phenotype (Tem) at 35 d.p.i., increasing from an average of 44% of all γδ T cells to an average of 71% after infection. Compensating for the increased frequency of γδ Tem cells, minor drops in frequency that were not statistically significant were observed for γδ T cells with naive (CD45RA+CD27+), central memory (Tcm) (CD45RA−CD27+), and terminally differentiated effector memory (Temra) (CD45RA+CD27−) phenotypes (Figure 2B). In contrast, the pre-and post-infection time-points did not reveal any observable differences in the differentiation phenotypes of αβ T cells (Figure 2C), showing that the changes in these parameters were specific to γδ T cells.
Figure 2. Expanded and Activated γδ T Cells at Late Stage after P. falciparum Infection.

(A) Cell frequencies among live peripheral blood mononuclear cells collected from 5 human subjects infected with Plasmodium falciparum (NF135.C10 strain), at 1 day before infection (C-1) and 35 d.p.i. (C+35). Subjects started receiving anti-malarial treatment after developing parasitemia.
(B and C) Frequency of γδ T cells (B) and αβ T cells (C) with naive (CD45RA+CD27+), central memory (Tcm) (CD45RA−CD27+), effector memory (Tem) (CD45RA−CD27−), and terminally differentiated effector memory (Temra) (CD45RA+CD27−) phenotypes.
(D) CD38 and HLA-DR expression among γδ Tem cells.
(E) CD56 expression among γδ T cells.
(A–E) n = 5 subjects. Data shown as mean ± SEM. NS > 0.05, *p < 0.05, **p < 0.01 (two-tailed, paired Student’s t test).
To determine the activation profile of the γδ Tem cells, we examined their expression of the activation markers HLA-DR and CD38. While HLA-DR was not upregulated, the frequency of HLA-DR−CD38+ cells among γδ Tem cells increased from the starting average of 3% to 33% at 35 d.p.i. (Figure 2D). Expression of CD56, which has been associated with cytotoxicity in γδ T cells during infectious disease and cancer (Alexander et al., 2008; Qin et al., 2012), was downregulated among γδ Tem and Temra cells at 35 d.p.i. No such difference was found in naive γδ T cells and γδ Tcm cells (Figure 2E). These results furthered the hypothesis that γδ T cells are playing a distinct, late-stage role in contrast to αβ T cells during human malaria.
Murine γδ T Cells Are Expanded and Activated Following Drug Treatment
To determine whether the γδ T cell expansion observed in P. chabaudi-infected mice is an appropriate model of the human γδ T cell expansion, we mimicked the CHMI by clearing the infection with an anti-malarial drug early at the onset of blood parasitemia. Starting at 6 d.p.i., infected and uninfected control animals were administered a daily dose of artesunate. By 8 d.p.i., most mice did not have detectable blood parasitemia (Figure 3A). Due to increased frequency and/or splenomegaly, absolute numbers of γδ T cells tripled in infected animals as compared to uninfected controls both at 9 and 14 d.p.i. (Figure 3B). At 9 d.p.i., blood γδ T cell frequency doubled to 1.0% in infected mice, which persisted until 14 d.p.i. The frequency of splenic γδ T cells was unchanged at 9 d.p.i., but increased in the infected animals by 14 d.p.i. (Figure 3C). In addition to increased amounts, γδ T cells were also significantly more activated (CD11a+CD49d+) at both time points in the blood and spleen of infected mice in comparison to the uninfected mice (Figure 3D). Therefore, infected mice whose parasite load was limited and rapidly cleared by anti-malarial treatment still experienced an expansion and activation of γδ T cells, much like the P. falciparum-infected subjects. This result further showed that the γδ T cell expansion observed during murine malaria is a useful model of the human γδ T cell expansion.
Figure 3. γδ T Cells Expand after Limited Parasite Exposure and Prevent Post-Acute Parasitemic Recrudescence.

(A) Parasitemia in infected C57BL/6 mice. Starting at 6 d.p.i., mice were administered artesunate daily until one day before the sacrifice.
(B and C) γδ T cell absolute numbers (B) and frequency of live cells (C). Both infected and uninfected animals received daily doses of artesunate starting at 6 d.p.i. (D) Frequency of activated (CD11a+CD49d+) γδ T cells.
(E–G) Parasitemia (E), core body temperature (F), and weight (G) in infected C57BL/6 Tcrd−/− and wild-type mice. Data shown are from one experiment.
(H–J) Parasitemia (H), core body temperature (I), and weight (J) in infected C57BL/6 wild-type animals. At 12 d.p.i. (arrow), animals were injected i.p. with 200 μg of either anti-γδTCR antibody or the isotype control monoclonal antibody. Data are representative of two independent experiments.
(A–D) n = 12–13 per group (data combined from two independent experiments), (E–G) n = 8 per group, (H–J) n = 7 per group. Data shown as mean ± SEM. *p < 0.05, **p < 0.01, ***p < 0.001, ****p < 0.0001 (two-tailed, unpaired Student’s t test). See also Figure S3.
γδTCR-Deficiency after Acute Parasitemia Results in P. chabaudi Recrudescence
To determine the necessity of γδ T cells in controlling the infection, we compared two models of γδ T cell-deficiency. Previously, mice completely deficient in γδ T cells were shown to experience strong parasitemic recrudescence during infections with P. chabaudi adami 556KA (C57BL/6 Tcrd−/− mice) or P. chabaudi chabaudi AS (C57BL/6 × 129 Tcrd−/− mice) (Langhorne et al., 1995; Seixas et al., 2002; Weidanz et al., 1999). To assess the importance of γδ T cells in our system, we infected C57BL/6 Tcrd−/− and wild-type mice with 105 Pcc AJ-iRBC. During the 30 days when the animals were monitored, Tcrd−/− animals experienced three distinct peaks of parasitemia at 8, 16, and 22 d.p.i. Meanwhile, wild-type animals exhibited the single acute parasitemia peak at 8 d.p.i., along with weak recrudescence at 16 d.p.i. (Figure 3E). Compared to wild-type mice, Tcrd−/− mice exhibited a prolonged period of modestly decreased core body temperature, but no marked differences in weight fluctuations (Figures 3F and 3G). At 12 d.p.i., one infected wild-type animal was dead.
However, removing an entire lineage of T cells from an organism during ontogeny could have pleotropic effects that complicate the interpretation. Given the finding that γδ T cells experience prolonged activation and expansion after acute parasitemia subsides, we sought to determine the importance of γδ T cell-competency in the post-acute phase of the infection by targeting γδ T cells in vivo with antibodies. At 12 d.p.i., infected C57BL/6 wild-type mice were separated into two equivalent groups according to parasitemia, core body temperature, and weight change measurements. The mice received a single intraperitoneal dose of either anti-γδTCR antibody (clone GL3) or a monoclonal isotype control antibody (Armenian hamster IgG). Administering GL3 monoclonal antibody in vivo leads to prolonged TCR internalization lasting at least 14 days, without clearance of the actual γδ T cells (Koenecke et al., 2009). We confirmed that γδ T cells persisted in P. chabaudi-infected mice administered GL3 antibody (Figure S3). Silencing γδ T cells in this manner, we could determine the significance of γδTCR-mediated effects on the post-acute stage of the Plasmodium infection. The animals whose γδ T cells were silenced experienced a significant recrudescence in parasitemia at 16 d.p.i., with a much smaller recrudescence at 24 d.p.i. Meanwhile, the infection in the isotype control group proceeded typically (Figure 3H). Accompanying the renewed parasitemia in the γδ T cell-silenced animals was a trend toward dropping body core temperature that reached statistical significance in one of the two independent experiments, while no such pathology was reflected in weight changes (Figures 3I and 3J). These results strongly implicated the γδTCR in the protective function of γδ T cells.
TRAV15N-1 (Vδ6.3) γδ T Cells Clonally Expand during Murine Malaria
To further evaluate the contribution of this γδ T cell population in the observed phenotype, we employed single-cell TCR sequencing, which allows both γ and δ TCR chains to be identified (Han et al., 2013; Wei et al., 2015). With this information, we identified expanded clones, which are defined by the exact identity of all of the following parameters: Variable (V) δ gene segment; joining (J) δ gene segment; δ-CDR3 (complementarity-determining region 3) amino acid sequence; Vγ; Jγ; γ-CDR3 amino acid sequence. Any TCR that is found to be identical for both γ and δ-chains in at least 2 cells is classified as an expanded clone. At 21 d.p.i., γδ T cells were isolated from the spleens and blood of infected animals and uninfected vehicle control animals. Single-cell sequencing of these γδ T cells revealed that the cells experience a high degree of clonal expansion, with 37 to 48 expanded clones among the 193–270 γδ T cells successfully sequenced in any given infected mouse. Meanwhile, the baseline measured in the uninfected animals shows only one or two expanded clones among > 150 successfully sequenced γδ T cells in each mouse (Figure 4A). A mean of 75% of the cells with both TCR chains identified belonged to one of the expanded clones in the infected mice, compared to the 2% in the uninfected animals (Figure 4B).
Figure 4. TRAV15N-1 γδ T Cells Are Clonally Expanded.

(A) Clonal expansion of single splenic and blood-borne γδ T cells from infected (I) and uninfected (U) C57BL/6 mice at 21 d.p.i. Per mouse, the number (n) of cells with both γ and δ chains successfully identified is shown. The absolute number of cells expressing a particular TCR clone expressed by two or more cells is shown with a distinct colored section.
(B) Frequency of cells expressing an expanded TCR clone among all cells with both γ and δ chains successfully identified.
(C and D) Frequency of V-region-usage by δ-chains (C) and γ-chains (D) among γδ T cells isolated from the spleen and blood at 21 d.p.i. Any clonal group of expanded cells (identical γ and δ chains) was counted as a single instance of Vγ and Vδ usage.
(E) Groups of clonally expanded TRAV15N-1 γδTCRs with convergent δ-CDR3 amino acid (aa) sequences. Each row identifies the paired CDR3 aa sequences, Vγ (TRGV, IMGT nomenclature) region, the mouse (“M”) that the clone came from, and the number of cells (“C”) that expressed that exact γδTCR pairing. Red boxes identify convergence.
(F and G) Quantification (F) and staining (G) of TRAV15N-1 on splenic γδ T cells at 21 d.p.i. Data are representative of two experiments.
(B–D) n = 3–4 per group, (F and G) n = 4–5 per group. All data shown as mean ± SEM. NS > 0.05, **p < 0.01, ***p < 0.001, ****p < 0.0001 (two-tailed, unpaired Student’s t test).
Apart from identifying specific clones, we examined the sequenced cells for trends in Vγ and Vδ-segment usage. The δ chains of γδ T cells from infected animals predominantly used a single V-segment: TRAV15N-1 (IMGT nomenclature; Vα7 (Arden et al., 1985), Vδ6.3 (Happ et al., 1989) in earlier nomenclatures). On average, 74% of γδ T cell clones from infected animals were expressing TRAV15N-1, whereas the same V-segment was expressed by only 15% of γδ T cells from the un-infected controls. This strong difference is observed having non-redundantly counted any clonally expanded set of cells as only one instance of Vγ and Vδ usage (Figure 4C). With respect to the γ chain, there was a significant increase in TRGV1 gene segment usage in the γδ T cells of infected animals and a significant drop in the usage of TRGV4. This skewing was driven by preferential pairing of TRAV15N-1 with TRGV1 (Figure 4D).
Furthermore, the δ-CDR3 sequences of a subset of expanded clones from different mice converged on certain amino acid motifs. For instance, there was an enrichment of clones that contain the IGGI motif encoded by the diversity (D)-gene segment TRDD2. Also, certain clones were enriched for a hydrophobic amino acid (leucine or methionine) in the first position after the TRAV15N-1-encoded CALWEL sequence. Finally, two groups of expanded clones from several mice contained very similar δ-CDR3 sequences: CALWE(L/S)LRA(S/T)DKLVF and CALWELAGYEXXDKLVF (X denoting any amino acid) (Figure 4E).
Corroborating the almost exclusive expansion of TCR clones using TRAV15N-1, about 90% of γδ T cells from infected animals stained for this V-region, while an average of only 10% of γδ T cells from uninfected animals were stained (Figures 4F and 4G). The frequency of TRAV15N-1 γδ T cells matched the frequency of activated (CD11a+CD49d+) γδ T cells at the same time-point (Figure 1E). The restriction to a single V-region on the δ-chain and convergence toward certain δ-CDR3 motifs showed that the γδ T cell expansion was driven by the TCR and suggested narrow antigen specificity.
Protective γδ T Cells Have a Distinct Transcriptional and Functional Profile
Having shown that the absence of functional γδ T cells throughout the infection or specifically in the post-acute stage leads to parasitemic recrudescence, we sought to determine how γδ T cells were mediating their protective capacity. Thus, we performed RNA-sequencing on γδ T cells collected during the expansion phase at 19 d.p.i. from infected and uninfected vehicle control animals. At the level of global transcription, γδ T cells from infected animals were close replicates of each other as shown by consistently low Jensen–Shannon distance scores; clustering of infected and uninfected groups along principle component 1 of the principle component analysis; and the high uniformity among transcriptional profiles on the level of individual genes (Figure S4).
After ranking genes by differential expression between γδ T cells from infected and uninfected cohorts, we compiled a list of the top 50 immune-related genes that are upregulated in the infected cohort (Figure 5A). Delving into the individual genes on this list revealed several sets of genes that have related function or classification. Confirming previous reports of highly expressed NK cell receptors on activated γδ T cells, a series of killer cell lectin-like receptors (Klra3, Klra9, Klrb1b, Klrb1f, Klre1, Klri1, Klri2) and Cd244 (encodes for Natural Killer Cell Receptor 2B4) were upregulated among γδ T cells from the infected animals (Cohen et al., 2013). A series of other gene sets were identified: factors associated with cytotoxicity (Fcrl6, Gzmb, Ncf2); exhaustion markers (Havcr2 [encodes Tim3], Prdm1 [Blimp1], Tigit, Entpd1 [encodes CD39]); positive and negative regulators of apoptosis (Bcl2a1d, Bcl2a1b, Htra3, Casp7, Entpd1, Birc5 (encodes Survivin), Plekhf1); proteins in the TCR signaling cascade (Plcg2, Pik3ap1, Lat2); factors associated with cell trafficking or tissue invasion (Itgax [encodes CD11c], Itgad [encodes CD11d], Gcnt1, Hpse, S1pr5, Tiam2, Adam8); growth factors, chemokines, and other proteins known to control myeloid cell recruitment, activation, and differentiation (Csf1 [encodes M-CSF], Ccl3, Ccl4, Ccl5, Ccl6, Ccrl2, Spp1 [encodes osteopontin], S100a9, Metrnl) (Table S1). Furthermore, three splice variants of Csf1 are known to exist, two of which (variants 1 and 3) are known to encode for secreted isoforms of macrophage colony-stimulating factor (M-CSF), while variant 2 encodes for the cell-surface isoform of M-CSF (Stanley and Chitu, 2014). The frequency of variant 1 (89%) and variant 3 (10.5%) among all Csf1 transcripts indicates that the expanded γδ T cells express the secreted isoforms of M-CSF, with negligible, if any, levels of cell-surface M-CSF (Figure 5B). While not among the top 50 immune-related genes, the gene encoding CCL5, which is related to and shares the chemokine receptors CCR1 and CCR5 with CCL3, was upregulated 8-fold in the infected cohort (Table S1). As the protein encoded by Csf1 (upregulated 251-fold) is known to promote development and polarization of macrophages, while the protein encoded by Ccl3 (upregulated 191.5-fold) is known to recruit various myeloid cell subsets, we sought to validate the transcriptional findings of these two genes and the related Ccl5 at the protein level to elucidate the mechanism by which the expanding γδ T cells are suppressing blood parasitemia.
Figure 5. Expanding γδ T Cells Secrete Myeloid-Recruiting and Stimulating Factors.

(A) Gene expression of splenic γδ T cells from infected (1I-4I) and uninfected (1U-4U) C57BL/6 mice at 19 d.p.i. Z scores were normalized within each gene from the top 50 immune-related genes upregulated in γδ T cells from infected animals compared to uninfected animals.
(B) Frequency of splice variants (V1, V2, V3) among Csf1 transcripts in splenic γδ T cells of infected animals.
(C) Frequency of γδ T cells in the blood. Data are representative of three independent experiments.
(D) Intracellular M-CSF staining in splenic γδ T cells. The plot is representative of four independent experiments.
(E) TRAV15N-1+TRGV1+ cells among M-CSF+ γδ T cells in the blood of an infected animal. The plot is representative of two independent experiments.
(F and G) Frequencies of M-CSF, CCL5, and CCL3-producing γδ T cells (F) and of γδ T cells with the specified combinations of intracellular cytokines (G) (ND: < 1%). Cells were stained directly ex vivo without stimulation. Data are representative of two independent experiments.
(A–G) Samples obtained at 19 d.p.i. (B) n = 4, (C) n = 4–5 per group, (F and G) n = 5 per group. All data shown as mean ± SEM. NS > 0.05, *p < 0.05, **p < 0.01, ***p < 0.001, ****p < 0.0001 (two-tailed, unpaired Student’s t test). See also Table S1 and Figures S4 and S5.
At 19 d.p.i., when γδ T cells were highly expanded (Figure 5C), the frequencies of γδ T cells expressing M-CSF, CCL5, and CCL3 were quantified by intracellular cytokine staining. We developed an M-CSF staining reagent for this purpose using an existing anti-M-CSF monoclonal antibody. Mirroring the 251-fold upregulation of Csf1 transcription at the protein level, the mean fluorescence intensity of the M-CSF signal shifted by more than 3 orders of magnitude in γδ T cells from the infected animals (Figure 5D). Because most of the γδ T cell expansion was attributed to cells expressing TRAV15N-1 and TRGV1 V-regions, we measured usage of these V-regions by M-CSF-producing γδ T cells. On average, 91% (spleen) and 93% (blood) of M-CSF+ γδ T cells from infected animals were TRGV1+TRAV15N-1+, as shown by a representative plot (Figure 5E). A mean of 77% (spleen) and 68% (blood) of γδ T cells from infected animals expressed M-CSF directly ex vivo without any additional stimulation, while fewer than 1% of γδ T cell from uninfected mice contained intracellular M-CSF (Figure 5F). Additionally, no significant levels of intracellular M-CSF were detected in CD4+ αβ T cells, CD8+ αβ T cells, and B cells. Also, the myeloid compartment (CD11b+ or CD11c+) exhibited modest changes in M-CSF expression (Figures S5A and S5B). CCL5 was highly upregulated in γδ T cells from infected animals. Finally, production of CCL3 among splenic γδ T cells was increased in infected animals, while no statistically significant increase was observed in the blood (Figure 5F). The frequencies of γδ T cells expressing various combinations of M-CSF, CCL5, and CCL3 were also quantified. Among splenic γδ T cells from infected animals, 42% expressed all three cytokines and 35% produced only M-CSF and CCL5. As for blood-borne γδ T cells from infected animals, 14% expressed all three cytokines and 53% produced only M-CSF and CCL5. The combination of only M-CSF and CCL3 was rarely observed. The frequency of γδ T cells producing only CCL5 and CCL3 stayed consistently low among the assayed tissues and infection states (Figure 5G).
To determine the maximal capacity of γδ T cells to make CCL5 and CCL3, we quantified the frequency of cells producing these chemokines after culturing blood-borne cells with protein trafficking inhibitors in the absence or presence of PMA and ionomycin (PMA/I). In the absence of PMA/I, frequency of CCL5+ and CCL3+ γδ T cells increased 10-fold and 3.5-fold, respectively, in the infected animals. Among cells cultured with PMA/I, frequency of CCL5+ γδ T cells doubled and that of CCL3+ γδ T cells modestly increased in the infected animals (Figure S5C). In this assay, we also stained for interleukin-22 (IL-22), IL-4, IL-13, IL-17A, perforin, granzyme B, and IL-10, none of which was detected at significant levels in γδ T cells from infected or uninfected animals. Also, γδ T cells from infected animals cultured with PMA/I did not upregulate IFN-γ more than γδ T cells from uninfected animals (data not shown). Our data showed that the expanded γδ T cells abundantly express a distinct set of cytokines, including CCL3, CCL5, and M-CSF, the latter being restricted to TRGV1+TRAV15N-1+ γδ T cells
M-CSF+ TRAV15N-1 γδ T Cells Are Expanded in the Liver and Lung
To further understand the extent of γδ T cell expansion and phenotypic changes during murine malaria, we examined non-lymphoid sites relevant to malaria and γδ T cell biology—liver and lung. Both of these organs, as well as the spleen, carry a substantial parasitemic burden in the post-acute stage of the P. chabaudi infection (Brugat et al., 2014). Additionally, γδ T cells are present in the epithelium, including that of the liver and the lung (Bonneville et al., 2010). We administered either anti-γδTCR antibody or isotype control antibody at 12 d.p.i. and assayed γδ T cells in the peripheral organs at 16 d.p.i., when parasite recrudescence peaked in γδ T cell-incompetent mice (Figure 3H). Treatment with the anti-γδTCR antibody clearly inhibited expansion in the liver, lung, and spleen. In the comparison of uninfected animals to infected ones that received the isotype control antibody, γδ T cell frequency among live hematopoietic cells (CD45+) increased about 4-fold in the liver and lung and about 10-fold in the spleen (Figure 6A). Across all three tissues, γδ T cells were highly activated (CD11a+CD49d+), enriched for TRAV15N-1 V-region usage, and had high frequencies of M-CSF+ cells (Figures 6B–6D). In addition, we found that infected animals had significantly increased levels of M-CSF in the spleen, which was strongly reduced in infected animals treated with the anti-γδTCR antibody (Figure 6E). Therefore, γδ T cells are the major source of M-CSF in the spleen, and M-CSF-producing TRAV15N-1 γδ T cells are present in tissues known to bear a substantial parasite burden in the post-acute stage of infection. We did not see this effect in the lung and liver, which might indicate that the spleen is a major site of γδ T cell activity for preventing recrudescence.
Figure 6. M-CSF+ TRAV15N-1+ γδ T Cells Are Expanded and Activated in Organs.

(A) Frequency of γδ T cells among live CD45+ cells at 16 d.p.i. At 12 d.p.i., each infected animal was injected i.p. with 200 μg of either anti-γδTCR antibody or the isotype control monoclonal antibody. Data combined from two independent experiments.
(B–D) Frequency of activated (CD11a+CD49d+) (B), TRAV15N-1+ (C), or M-CSF+ cells among total γδ T cells. Data combined from two independent experiments.
(E) M-CSF protein at 16 d.p.i. in the tissue (n = 3–4 per group). Data shown are from one experiment. (A–D) n = 8 per group. All data shown as mean ± SEM. NS > 0.05, *p < 0.05, **p < 0.01, ***p < 0.001, ****p < 0.0001 (two-tailed, unpaired Student’s t test).
γδ T Cells Are the Post-Acute Source of M-CSF
While there was no detectable intracellular M-CSF in αβ T cells at 19 d.p.i., we examined whether αβ T cells produced M-CSF during the acute stage of the infection. An earlier study has shown that CD4+ αβ T cells from C57BL/6 mice infected with P. chabaudi chabaudi AS express Csf1 and secrete M-CSF upon stimulation with PMA/I at 6 d.p.i. (Fontana et al., 2016). We observed that CD4+ αβ T cells produced M-CSF at 8 d.p.i. directly ex vivo without additional stimulation. On average, 19% (spleen) and 4% (blood) of CD4+ αβ T cells from infected animals produced M-CSF, while no detectable amounts were observed in uninfected animals. At the acute stage, 3% (spleen) and 10% (blood) of γδ T cells also produced M-CSF (Figure 7A). In combination with substantially greater cell numbers at the acute stage, the larger frequency of M-CSF producers in the CD4+ αβ T cell compartment compared to the γδ T cell compartment suggested that CD4+ αβ T cells were the main source of M-CSF at the acute stage of infection. CD8+ αβ T cells did not make any detectable levels of M-CSF (data not shown). The frequencies of M-CSF producers observed at 8 d.p.i. are dwarfed by the large frequencies of M-CSF+ γδ T cells measured at 19 d.p.i., when no appreciable levels of M-CSF+ CD4+ αβ T cells were detected (Figure 7A). As shown by fluorescence intensity, M-CSF production in CD4+ αβ T cells appeared to be more graded than the discreet pattern of expression observed in γδ T cells (Figure 7B). Using flow cytometry, we have confirmed that the post-acute stage is dominated by TRGV1+TRAV15N-1+ (Vγ1+Vδ6.3+) γδ T cells (Figure 7C).
Figure 7. αβ and γδ T Cells Produce Protective M-CSF at Distinct Infection Stages.

(A and B) Frequencies (A) and representative flow cytometry plots (B) of M-CSF-producing CD4+ αβ and γδ T cells (ND: < 1%) from infected (A and B) and uninfected (A) C57BL/6 mice at 8 and 19 d.p.i. Cells were stained directly ex vivo without stimulation.
(C) Frequency of TRGV1+TRAV15N-1+ cells among γδ T cells.
(D) Parasitemia in infected C57BL/6 wild-type animals injected with 200 μg of anti-γδTCR (Armenian Hamster IgG; at 12 d.p.i.), 1 mg of anti-M-CSF (Rat IgG1; at 12 and 14 d.p.i.), or respective isotype control monoclonal antibodies.
(A–C) n = 5 per group, (D) n = 4–5 per group. All data shown as mean ± SEM and are representative of two independent experiments. NS > 0.05, *p < 0.05, **p < 0.01, ***p < 0.001, ****p < 0.0001 (two-tailed, unpaired Student’s t test).
Having found that a large fraction of γδ T cells produce M-CSF in the post-acute stage of infection, we wanted to determine the contribution of this cytokine to suppression of parasitemic recrudescence. As before, infected C57BL/6 wild-type mice were separated into four equivalent groups according to the measured health parameters and administered one of the following antibodies at 12 d.p.i.: (1) anti-γδTCR (Armenian Hamster IgG); (2) isotype control monoclonal (Armenian Hamster IgG); (3) anti-M-CSF (Rat IgG1); (4) isotype control monoclonal (Rat IgG1). Anti-M-CSF antibody and the corresponding isotype control antibody were administered again at 14 d.p.i.. As shown in Figure 7C, depletion of M-CSF led to a pronounced parasitemic recrudescence that reached a mean of 12% parasitemia at 16 days post-infection, in contrast to < 1% for the rat IgG1 isotype control animals (Figure 7D). This phenocopies the silencing or deletion of γδ T cells, indicating that M-CSF, which is expressed by a specific subset of these cells, is critical for the suppression of later rounds of parasitemia.
DISCUSSION
While the responses of CD4+ αβ T cells, CD8+ αβ T cells, and B cells during human and murine malaria have been extensively examined, our understanding of the γδ T cell response has been quite limited. Although studies of human and murine malaria have shown increased γδ T cell frequencies, little is known about the precise function of these cells (Roussilhon et al., 1994; Teirlinck et al., 2011; van der Heyde et al., 1993). Focusing first on the kinetics, we found that γδ T cells increased in frequency approximately 30-fold and 15-fold in the blood and spleen, respectively, and became highly activated (CD11a+CD49d+) after the resolution of acute P. chabaudi parasitemia, reaching peak frequency and activation at 21 d.p.i. This is in contrast to CD4+ and CD8+ αβ T cells, which were expanded and activated in parallel with blood parasitemia. Similarly, in malaria-naive volunteers infected with P. falciparum, γδ T cells exhibited a more activated effector phenotype (CD38+CD45RA−CD27−) at 35 d.p.i. compared to the pre-infection baseline—a difference not observed in the αβ T cell compartment at this late time-point. Interestingly, an early study of influenza-infected mice showed that γδ T cells were expanding during late time points when the αβ T cells were already contracting in frequency, with Vγ1 and/or Vγ2 γδ T cells representing the largest portion of the γδ T cell population at the latest time-point (Carding et al., 1990). The time-course data shown here demonstrate that this late expansion involves a very specific γδ T cell type whose cytokines, particularly M-CSF, suppress parasitemia.
Further establishing the expansion of murine γδ T cells as a useful model of the same phenomenon during human malaria, we observed that murine γδ T cells are also expanded and activated even if the parasites are cleared at the acute stage with the anti-malarial artesunate. The expansion of murine γδ T cells, reaching 10- to 20-fold about 3 weeks after P. chabaudi infection has been a long-standing puzzle (van der Heyde et al., 1993). In general agreement with previous reports of Tcrd−/− mice infected with P. chabaudi chabaudi AS or P. chabaudi adami 556KA (Seixas et al., 2002; Weidanz et al., 1999), infection of γδ T cell-deficient mice in our system (P. c. chabaudi AJ in C57BL/6 Tcrd−/− mice) resulted in three peaks of parasitemia. While this result strongly suggested that γδ T cells are involved in suppressing renewed parasitemia, one cannot discount the possibility that in the absence of γδ T cells during the acute stage of the infection, the parasites were insufficiently cleared in various organs and were primed for recrudescence. Thus, by blocking the ability of γδ T cells to recognize ligands through the TCR after the acute stage of the infection, we definitively showed their role in preventing recrudescence.
The possible mechanisms accounting for increased γδ T cell frequency were either recruitment of tissue-resident γδ T cells to the blood and spleen or TCR-driven clonal expansion. We investigated this using single-cell TCR sequencing and flow cy-tometry. The paired-chain TCR sequencing data showed that the increased abundance of γδ T cells was largely attributable to clonal expansion of γδ T cells that preferentially express the TRAV15N-1 (Vδ6.3) V-gene segment of TCRδ, with a corresponding increase in TRGV1 (Vγ1). Furthermore, about 90% of γδ T cells at the peak of their expansion were shown to be TRAV15N-1+ by flow cytometry. Therefore, increased γδ T cell frequency and the corresponding control of parasitemia during infection with P. chabaudi were largely driven by γδTCR-dependent expansion. Additionally, Vγ4 γδ T cells can act as negative regulators of Vγ1 γδ T cells (Welte et al., 2011). Therefore, the observed drop in TRGV4 (Vγ4) usage could provide a partial explanation for the late expansion of TRGV1+TRAV15N-1+ γδ T cells. Other explanations include the low starting frequency of the specific clones that are found to be highly expanded at the peak of expansion, as well as the possibly late availability of whichever ligands trigger this activation and expansion. The combination of an almost exclusive use of TRAV15N-1 and the convergence on particular CDR3-motifs by the expanding clones suggests narrow antigen specificity.
Notably, a body of literature shows that TRGV1+TRAV15N-1+ (Vγ1+Vδ6.3+, Helig and Tonegawa nomenclature) γδ T cell clones are responsive to Mycobacterium spp.-derived heat shock protein-60 (HSP-60) and murine HSP-65, with a highly conserved 17-amino acid peptide identified as the ligand (Born et al., 1990; Fu et al., 1993; O’Brien et al., 1992). Since the peptide derived from murine HSP-65 is 76% identical to the corresponding stretch of the homologous P. chabaudi HSP-60, these published findings offer the intriguing possibility that the expanded clones shown are cross-reactive γδ T cells responding to P. chabaudi or mouse-derived HSP-60. TRGV1+ TRAV15N-1+ γδ T cell clones have also been shown to respond to synthetic copolymers of glutamic acid and tyrosine, as well as to cardiolipin and related anionic phospholipids (Born et al., 2003; Cady et al., 2000). We are currently exploring these ligands as candidates for the expanded γδTCRs identified in this study.
Having characterized the expansion of this oligoclonal set of γδ T cells, we proceeded to determine the functional properties of this γδ T cell population. Whole transcriptome analysis of γδ T cells from infected and uninfected animals revealed a strong upregulation of numerous factors, including M-CSF, known to stimulate and recruit myeloid cells. Canonically, γδ T cells are mainly thought of as IFN-γ or IL-17-producers (Chien et al., 2014). In the context of P. falciparum, human γδ T cells either exposed to the parasites in vitro or obtained from CHMI subjects have been shown to produce pro-inflammatory cytokines, with a strong focus on IFN-γ (Goodier et al., 1995; Teirlinck et al., 2011). Expression of IFN-γ was also shown to be elevated in murine γδ T cells during the first two weeks of P. chabaudi infection (Seixas and Langhorne, 1999). These earlier results, together with those reported here, strongly imply that two distinct types of γδ T cells are involved in the response to P. chabaudi infection. The acute phase γδ T cells mostly produce IFN-γ, while the late stage γδ T cells produce M-CSF. Using intracellular cytokine staining in γδ T cells, we validated the expression of M-CSF, CCL3, and CCL5. Chemokines CCL3 and CCL5 are known to mediate migration of macrophages, neutrophils, natural killer cells, and CD8+ αβ T cells primarily by signaling through CCR1 and CCR5 (Griffith et al., 2014). In general, myeloid cells (phagocytic cells, CD169+ macrophages, and inflammatory monocytes) are involved to varying extents in the immune response to Plasmodium parasites (Fontana et al., 2016; Spence et al., 2013; Sponaas et al., 2009). The intracellular M-CSF signal shifted by more than 3 orders of magnitude in the infected γδ T cells directly ex vivo. We also showed that post-acute depletion of M-CSF phenocopies the post-acute silencing of γδ T cells, suggesting that γδ T cells could be suppressing parasitemia via M-CSF.
Little is known about the role of M-CSF during malaria. Levels of this cytokine were elevated in patients admitted with P. falciparum and P. vivax infections, and in mice infected with P. chabaudi or P. berghei (Lee et al., 1997; Villeval et al., 1990). A recent report implicates CD4+ αβ T cell-derived M-CSF in protection against P. chabaudi parasitemia (Fontana et al., 2016). By intracellular cytokine staining, we confirmed that during the acute stage CD4+ αβ T cells produced M-CSF protein and were the main T cell subset to do so. However, we also show that in the post-acute stage, γδ T cells were the only T cell type with detectable intracellular M-CSF. While Fontana and colleagues show post-acute parasitemic recrudescence in animals whose Csf1 has been deleted in CD4+ cells, interpretation of these results is complicated by the extended tamoxifen treatment given to the mice—as evidenced by unusually high recrudescent parasitemia in control animals.
Our data showed that γδ T cells can be polarized toward production of M-CSF and accessory cytokines (i.e., CCL5, CCL3) that influence the myeloid compartment. This functional phenotype coupled with the restricted TRAV15N-1 V-repertoire suggests that this is a distinct subset of γδ T cells that specializes in interacting with the myeloid compartment during infection. Cancer studies have shown IL-17-dependent crosstalk between γδ T cells and myeloid cells, while infections of γδ T cell-deficient mice with Bordetella pertussis, Listeria monocytogenes, or Escherichia coli have shown dysfunctional myeloid recruitment (Shibata et al., 2007; Silva-Santos et al., 2015; Skeen et al., 2004; Zachariadis et al., 2006). These M-CSF-producing γδ T cells suggest a mechanism for understanding how γδ T cells might shape the myeloid response during cancer or infection.
In light of our findings that the expansion and activation of M-CSF-producing TRAV15N-1 γδ T cells extend to the liver and lung, the tissue-specific role of these cells remains to be fully elucidated. Early studies have shown that specific γδ T cell clones inhibit Plasmodium yoelii sporozoites in the liver (Tsuji et al., 1996; 1994). Whether TRAV15N-1 γδ T cells work in the same fashion during the hepatic stage of P. chabaudi infection remains to be determined.
In addition to contributing to a greater understanding of malaria, the mouse P. chabaudi infection provides a model for general understanding of γδ T cells, which remain one of the least understood cell types within the immune system. Our findings take substantial steps forward in elucidating the mechanisms through which γδ T cells provide protection during malaria and reveal a subset of γδ T cells with distinct phenotypic and functional characteristics. Following the convention set for IL-17 and IFN-γ-producing γδ T cells (Tγδ-17 and Tγδ-IFN-γ) (Jensen et al., 2008), we propose to designate this M-CSF-producing subset TγδM.
STAR ★ METHODS
Detailed methods are provided in the online version of this paper and include the following:
KEY RESOURCES TABLE
| REAGENT or RESOURCE | SOURCE | IDENTIFIER |
|---|---|---|
| Antibodies | ||
| Purified Rat Anti-Mouse CD16/CD32 (Fc Block) (clone 2.4G2) | BD PharMingen | Cat.# 553141 |
| Anti-mouse CD3 PerCP-Cy5.5 (clone 17A2) | BioLegend | Cat.# 100218 |
| Anti-mouse TCRgd PE-Cy7 (clone GL3) | BioLegend | Cat.# 118124 |
| Anti-mouse CD4 Alexa Fluor 700 (clone RM4-5) | BioLegend | Cat.# 100536 |
| Anti-mouse CD8a BV785 (clone 53-6.7) | BioLegend | Cat.# 100750 |
| Anti-mouse CD44 FITC (clone IM7) | BioLegend | Cat.# 103006 |
| Anti-mouse CD62L BV421 (clone MEL-14) | BioLegend | Cat.# 104436 |
| Anti-mouse CD11a Alexa Fluor 647 (clone M17/4) | BioLegend | Cat.# 101114 |
| Anti-mouse CD19 PE-Cy5 (clone 6D5) | BioLegend | Cat.# 115510 |
| Anti-mouse TER-119 PE-Cy5 (clone TER-119) | BioLegend | Cat.# 116210 |
| Anti-mouse CD11b PE-Cy5 (clone M1/70) | BioLegend | Cat.# 101210 |
| Anti-mouse CD11c PE-Cy5 (clone N418) | BioLegend | Cat.# 117316 |
| Anti-mouse NK1.1 PE-Cy5 (clone PK136) | BioLegend | Cat.# 108716 |
| Anti-mouse CD49d PE (clone R1-2) | eBioscience | Cat.# 12-0492-83 |
| Anti-mouse TCRb APC-eFluor 780 (clone H57-597) | eBioscience | Cat.# 47-5961-82 |
| Anti-mouse CD19 APC-Cy7 (clone 1D3) | BD PharMingen | Cat.# 557655 |
| Anti-mouse CD3 BV650 (clone 17A2) | BioLegend | Cat.# 100229 |
| Anti-mouse IL-22 PE (clone 1H8PWSR) | eBioscience | Cat.# 12-7221-82 |
| Anti-mouse IL-4 APC (clone 11B11) | eBioscience | Cat.# 17-7041-82 |
| Anti-mouse IL-13 eFluor 450 (clone eBio13A) | eBioscience | Cat.# 48-7133-82 |
| Anti-mouse IFN-g PerCP-Cy5.5 (clone XMG1.2) | eBioscience | Cat.# 45-7311-82 |
| Anti-mouse IL-17A FITC (clone eBio17B7) | eBioscience | Cat.# 11-7177-81 |
| Anti-mouse Perforin APC (clone eBioOMAK-D) | eBioscience | Cat.# 17-9392-80 |
| Anti-mouse Granzyme B eFluor450 (clone NGZB) | eBioscience | Cat.# 48-8898-82 |
| Anti-mouse CCL3 PerCP-eFluor710 (clone DNT3CC) | eBioscience | Cat.# 46-7532-82 |
| Anti-mouse IL-10 Alexa Fluor 488 (clone JES5-16E3) | eBioscience | Cat.# 53-7101-82 |
| Anti-mouse CCL5 PE (clone 2E9/CCL5) | BioLegend | Cat.# 149104 |
| Anti-mouse CD4 BV421 (clone RM4-5) | BioLegend | Cat.# 100544 |
| Anti-mouse CD11b APC-Cy7 (clone M1/70) | BioLegend | Cat.# 101226 |
| Anti-mouse CD19 FITC (clone 1D3) | BD PharMingen | Cat.# 553785 |
| Anti-mouse TCRb FITC (clone H57-597) | eBioscience | Cat.# 11-5961-85 |
| Anti-mouse CD11c APC-eFluor 780 (clone N418) | eBioscience | Cat.# 47-0114-82 |
| Anti-mouse M-CSF (clone 5A1) | BD PharMingen | Cat.# 552513 |
| Rat IgG1, kappa Isotype Control Alexa Fluor 647 (clone RTK2071) | BioLegend | Cat.# 400418 |
| Anti-mouse Vd6.3/2 PE (clone 8F4H7B7) | BD PharMingen | Cat.# 555321 |
| Anti-mouse Vg1 BV421 (clone 2.11) | BD PharMingen | Cat.# 566308 |
| Anti-mouse Vg2 BV650 (clone UC3-10A6) | BD PharMingen | Cat.# 742311 |
| Anti-mouse IFN-g Alexa Fluor 488 (clone XMG1.2) | eBioscience | Cat.# 53-7311-82 |
| Anti-mouse CD45 BV421 (clone 30-F11) | BioLegend | Cat.# 103134 |
| Anti-mouse CD11a FITC (clone M17/4) | BioLegend | Cat.# 101106 |
| Anti-mouse Vd6.3/2 BV650 (clone 8F4H7B7) | BD Biosciences | Cat.# 744475 |
| Anti-mouse CD49d FITC (clone R1-2) | eBioscience | Cat.# 11-0492-82 |
| Goat anti-hamster (Armenian) IgG Alexa Fluor 488 (clone Poly4055) | BioLegend | Cat.# 405508 |
| Anti-mouse CD4 Alexa Fluor 700 (clone GK1.5) | BioLegend | Cat.# 100430 |
| Normal Syrian Hamster Serum | Jackson ImmunoResearch | Cat.# 007-000-120 |
| Normal Rat Serum | Jackson ImmunoResearch | Cat.# 012-000-120 |
| Human TruStain FcX (Fc Receptor Blocking Solution) | BioLegend | Cat.# 422302 |
| Anti-human CD19 PE-Cy7 (clone HIB19) | BioLegend | Cat.# 302216 |
| Anti-human TCRab PE-Cy7 (clone IP26) | BioLegend | Cat.# 306720 |
| Anti-human HLA-DR Alexa Fluor 647 (clone L243) | BioLegend | Cat.# 307622 |
| Anti-human CD38 BV421 (clone HIT2) | BioLegend | Cat.# 303526 |
| Anti-human CD27 BV650 (clone O323) | BioLegend | Cat.# 302828 |
| Anti-human CD45RA Alexa Fluor 700 (clone HI100) | BioLegend | Cat.# 304120 |
| Anti-human CD62L PerCP-Cy5.5 (clone DREG-56) | BioLegend | Cat.# 304824 |
| Anti-human CD56 Alexa Fluor 488 (clone HCD56) | BioLegend | Cat.# 318312 |
| Anti-human CD3 BV605 (clone OKT3) | BioLegend | Cat.# 317322 |
| Anti-human TCRgd PE (clone 5A6.E9) | Life Technologies | Cat.# MHGD04 |
| Anti-mouse TCRgd (clone GL3, low endotoxin, azide-free [LEAF]) | BioLegend | Cat.# 118114 |
| Armenian Hamster IgG isotype control (clone HTK888, LEAF) | BioLegend | Cat.# 400916 |
| Anti-mouse CSF1 (clone 5A1, LEAF) | Bio X Cell | Cat.# BE0204 |
| Rat IgG1 isotype control, anti-horseradish peroxidase (clone HRPN, LEAF) | Bio X Cell | Cat.# BE0088 |
| Anti-mouse TCRgd Alexa Fluor 647 (clone GL3) | BioLegend | Cat.# 118134 |
| Armenian Hamster IgG isotype control Alexa Fluor 647 (clone HTK888) | BioLegend | Cat.# 400924 |
| Chemicals, Peptides, and Recombinant Proteins | ||
| KaryoMAX Giemsa | GIBCO | Cat.# 10092-013 |
| Artesunate | Sigma-Aldrich | Cat.# A3731 |
| ACK Lysing Buffer | GIBCO (Thermo Fisher Scientific) | Cat.# A10492-01 |
| Bovine Serum Albumin | Sigma | Cat.# A3069-50G |
| LIVE/DEAD Fixable Aqua Dead Cell Stain Kit | Life Technologies | Cat.# L34966 |
| Protein Transport Inhibitor Cocktail | eBioscience | Cat.# 00-4980-03 |
| Cell Stimulation Cocktail | eBioscience | Cat.# 00-4970-03 |
| Collagenase IV | Worthington | Cat.# LS004188 |
| DNase I | Sigma-Aldrich | Cat.# 10104159001 |
| Iodixanol gradient (OptiPrep) | Sigma-Aldrich | Cat.# D1556-250ML |
| cOmplete Protease Inhibitor Cocktail | Sigma-Aldrich | Cat.# 11836170001 |
| RNAprotect Cell Reagent | QIAGEN | Cat.# 76526 |
| Critical Commercial Assays | ||
| Alexa Fluor 647 Antibody Labeling Kit | Life Technologies | Cat.# A20186 |
| Mouse M-CSF Quantikine ELISA Kit | R&D Systems | Cat.# MMC00 |
| QIAGEN OneStep RT-PCR Kit | QIAGEN | Cat.# 210215 |
| HotStarTaq Master Mix Kit | QIAGEN | Cat.# 203445 |
| QIAquick Gel Extraction Kit | QIAGEN | Cat.# 28704 |
| MiSeq Reagent Kit v2 (500-cycles) | Illumina | Cat.# MS-102-2003 |
| RiboGone Mammalian rRNA Depletion Kit | Clontech | Cat.# 634846 |
| SMARTer® Stranded RNA-Seq Kit | Clontech | Cat.# 634836 |
| Deposited Data | ||
| Whole transcriptome data | This paper | GEO accession: GSE108478 |
| Experimental Models: Organisms/Strains | ||
| Mouse: C57BL/6J | The Jackson Laboratory | Stock # 000664 |
| Mouse: B6.129P2-Tcrdtm1Mom/J | The Jackson Laboratory | Stock # 002120 |
| Plasmodium chabaudi chabaudi AJ | MR4 (BEI Resources) | Cat.# MRA-756 |
| Plasmodium falciparum (clone NF135.C10) | Laboratory of Robert W. Sauerwein | N/A |
| Oligonucleotides | ||
| TCR Sequencing Primers | Wei et al., 2015 | N/A |
| Software and Algorithms | ||
| FlowJo X 10.0.7r2 | Tree Star, Inc. | https://www.flowjo.com |
| GraphPad Prism 7.0c | GraphPad Software, Inc. | https://www.graphpad.com/ |
| FastQC 0.11.4 | Babraham Institute | https://www.bioinformatics.babraham.ac.uk/projects/fastqc/ |
| STAR 2.4.2a | Dobin A et al., 2012 | https://github.com/alexdobin/STAR |
| Cufflinks 2.2.1 | Trapnell C et al., 2014 | http://cole-trapnell-lab.github.io/cufflinks/install/ |
| RSEM 1.2.30 | Li B et al., 2011 | http://deweylab.biostat.wisc.edu/rsem |
| MiGMAP 1.0.0 | Shugay et al., 2015; Ye et al., 2013 | https://github.com/mikessh/migmap |
| CD-HIT 4.6.5 | Li and Godzik, 2006 | https://github.com/weizhongli/cdhit |
| MUSCLE 3.8.31 | Edgar, 2004 | https://www.drive5.com/muscle/ |
| EMBOSS 6.6.0 | Rice et al., 2000 | ftp://emboss.open-bio.org/pub/EMBOSS/ |
| BioPerl 1.6.924 | Stajich et al., 2002 | http://search.cpan.org/dist/BioPerl-1.6.924/ |
| IgBLAST 1.4.0 | Ye et al., 2013 | ftp://ftp.ncbi.nih.gov/blast/executables/igblast/release/ |
| Other | ||
| BD LSR II | BD Biosciences | N/A |
| BD FACSAria II cell sorter | BD Biosciences | N/A |
| 2100 Bioanalyzer | Agilent Technologies | N/A |
| HiSeq 4000 System | Illumina | N/A |
| MiSeq System | Illumina | N/A |
CONTACT FOR REAGENT AND RESOURCE SHARING
Further information and requests for resources and reagents should be directed to and will be fulfilled by the Lead Contact, Mark M. Davis (mmdavis@stanford.edu).
EXPERIMENTAL MODEL AND SUBJECT DETAILS
Parasite Strains
Plasmodium chabaudi chabaudi AJ strain (Malaria Research and Reference Reagent Resource Center [MR4]) were tested for contaminating pathogens prior to use.
Mouse Strains
C57BL/6J mice and Tcrd−/− (C57BL/6J) (B6.129P2-Tcrdtm1Mom/J) at 8–12 weeks of age were obtained from the Jackson Laboratory. The animals were housed in the Stanford Research Animal Facility according to Stanford University guidelines, and Tcrd−/− C57BL/6J mice were bred in the facility. All mouse experiments were approved by the Stanford Administrative Panel on Laboratory Animal Care. The animals were rested for at least 7 days prior to any experiments. Only female mice were used for all the experiments, except for the flow cytometry-based validation of TRAV15N-1 expression in expanded γδ T cells, which was done in both male and female mice.
Controlled Human Malaria Infection Samples
PBMC samples were collected as part of a collaborative clinical trial of the Radboud University Medical Center and the Leiden University Medical Center involving volunteers who provided informed consent (Schats et al., 2015). The Central Committee for Research Involving Human Subjects of the Netherlands (NL39414.000.12) approved the study, which complied with the Declaration of Helsinki and Good Clinical Practice and was registered at ClinicalTrials.gov (Identifier: NCT01660854). Each healthy, malaria-naive volunteer was infected with P. falciparum clone NF135.C10 via bites of five Anopheles stephensi mosquitoes. The infected volunteers were monitored as outpatients once daily at days 5 and 6, twice daily at days 7–15, and once daily at days 16–21. At each visit, a thick blood smear was performed for determination of blood parasitemia. As soon as two unambiguous parasites were detected by microscopy in a thick smear of 0.5 μL of blood, the infected volunteer was administered 1000 mg atovaquone and 400 mg proguanil once daily for three days according to Dutch national malaria guidelines. One day prior to the infection and at 35 d.p.i., peripheral blood mononuclear cells were isolated and cryopreserved. The analyzed samples were obtained from 4 female and 1 male volunteers aged between 21 and 34.
METHOD DETAILS
Mouse Infections
Mice were given intraperitoneal (i.p.) injections of frozen stocks of P. chabaudi-infected RBCs (iRBCs). Once the parasitemia reached 10%–20% (7–10 days post-infection), freshly obtained 105 iRBCs in Krebs saline with glucose (KSG) (Spence et al., 2011) were i.p. injected into a cohort of female (unless noted otherwise) mice. Uninfected control animals were injected with the vehicle (KSG) alone on the day of infection. Parasitemia was monitored by preparing a thin smear of tail blood, fixing it in methanol, staining it in KaryoMAX Giemsa (GIBCO), and quantifying the frequency of parasitized erythrocytes at 100x magnification. Body temperature was measured with a rectal probe.
Artesunate-treated mice were infected as described. Starting at 6 d.p.i., mice were administered daily 50 μL i.p. injections of artesunate (Sigma-Aldrich) until one day before the sacrifice. Control uninfected mice received the same artesunate treatment. To prepare the artesunate solution, the drug was initially dissolved to a concentration of 100 mg/mL in 5% (w/v) sodium bicarbonate. This solution was diluted to a final concentration of 17 mg/mL with 0.9% (w/v) sodium chloride. Blood parasitemia was quantified by examining thin smears of tail blood. Only mice with detectable parasitemia at 6 d.p.i. were included in the analysis. Blood and spleen were harvested either at 9 or 14 d.p.i., processed, and analyzed by flow cytometry.
Flow Cytometry
Blood and spleen were obtained from the animals, and the erythrocytes were lysed with Ammonium-Chloride-Potassium (ACK) buffer. For immunophenotyping, the remaining cells were stained in FACS buffer (PBS, 0.5% bovine serum albumin [Sigma], 0.02% NaN3). Splenocytes were enumerated with a hemocytometer. Prior to staining, the cells were incubated in Fc Block (anti-CD16/CD32, clone 2.4G2, BD PharMingen) for 20 min at 4°C. A cocktail containing the Live/Dead Aqua stain (Life Technologies) and antibodies against the following antigens was added to the blocked cells: CD3 PerCP-Cy5.5 (17A2); TCRγδ PE-Cy7 (GL3); CD4 Alexa Fluor 700 (RM4-5); CD8α Brilliant Violet (BV) 785 (53-6.7); CD44 FITC (IM7); CD62L BV421 (MEL-14); CD11a Alexa Fluor 647 (M17/4); CD19 PE-Cy5 (6D5); TER-119 PE-Cy5 (TER-119); CD11b PE-Cy5 (M1/70); CD11c PE-Cy5 (N418); NK1.1 PE-Cy5 (PK136) (all from BioLegend); and CD49d PE (R1-2, eBioscience). All stains were performed for 30 min at 4°C.
For intracellular cytokine staining, cells were stained either directly ex vivo or following a 6-hour in vitro incubation at 37°C. Incubated cells were cultured in complete RPMI 1640 (10% fetal bovine serum, GlutaMAX [GIBCO], 100 U/mL penicillin, 100 μg/mL streptomycin) supplemented with protein trafficking inhibitors brefeldin A (10.6 μM) and monensin (2 μM) (eBioscience) in the presence or absence of phorbol 12-myristate 13-acetate (PMA) (81 nM) and ionomycin (1.34 μM) (eBioscience). After an incubation with Fc Block in FACS buffer, the cells were surface stained with the following cocktail: Live/Dead Aqua; TCRγδ PE-Cy7 (GL3, BioLegend); TCRβ APC-eFluor 780 (H57-597, eBioscience); CD19 APC-Cy7 (1D3, BD PharMingen); CD3 BV650 (17A2, BioLegend). According to manufacturer’s instructions, the cells were fixed and permeabilized (BD Cytofix/Cytoperm) and then stained with one of the following cocktails: (1) IL-22 PE (1H8PWSR); IL-4 APC (11B11); IL-13 eFluor 450 (eBio13A); IFN-γ PerCP-Cy5.5 (XMG1.2); and IL-17A FITC (eBio17B7) (all from eBioscience); (2) Perforin APC (eBioOMAK-D); Granzyme B eFluor450 (NGZB); CCL3 PerCP-eFluor710 (DNT3CC); IL-10 Alexa Fluor 488 (JES5-16E3) (all from eBioscience); and CCL5 PE (2E9/CCL5, BioLegend).
Cells that were assayed directly ex vivo were stained with one of the following cocktails: (1) Live/Dead Aqua; CD8α BV785 (53-6.7); CD3 BV650 (17A2); CD4 BV421 (RM4-5); TCRγδ PE-Cy7 (GL3); CD11b APC-Cy7 (M1/70) (all from BioLegend); CD19 FITC (1D3, BD PharMingen); TCRβ FITC (H57-597, eBioscience); and CD11c APC-eFluor 780 (N418, eBioscience). After fixation and permeabilization, cells were stained with antibodies against the following cytokines: CCL3 PerCP-Cy5.5 (DNT3CC, eBioscience); CCL5 PE (2E9/CCL5, BioLegend); and M-CSF (5A1, BD PharMingen) or rat IgG1 isotype control Alexa Fluor 647 (RTK2071, anti-trinitrophenol, BioLegend); (2) Live/Dead Aqua; Vδ6.3/2 PE (8F4H7B7); Vγ1 BV421 (2.11); Vγ4 (Helig and Tonegawa nomenclature) BV650 (UC3-10A6); CD19 APC-Cy7 (1D3) (all from BD PharMingen); TCRγδ PE-Cy7 (GL3); CD3 PerCP-Cy5.5 (17A2); CD4 Alexa Fluor 700 (RM4-5); CD8α BV785 (53-6.7) (all from BioLegend). After fixation and permeabilization, cells were stained with antibodies against the following cytokines: M-CSF (5A1, BD PharMingen) and IFN-γ Alexa Fluor 488 (XMG1.2, eBioscience). The anti-M-CSF antibody (5A1) was conjugated to Alexa Fluor 647 with an antibody labeling kit following manufacturer’s instructions (Life Technologies).
In assays examining lung, liver, and spleen, the organs were removed after the mice were transcardially perfused with PBS. Livers and lungs were finely minced. Livers were enzymatically digested in RPMI 1640 supplemented with 1 mg/mL collagenase IV (Worthington) and 0.1 mg/mL DNase I (Sigma-Aldrich) for 30 min at 37°C with agitation, and sequentially strained through 100-μm and 70-μm filters. Liver non-parenchymal cells were obtained after separation on a 20% iodixanol gradient (OptiPrep, Sigma-Aldrich). Lungs were enzymatically digested in RPMI 1640 supplemented with 0.5 mg/mL collagenase IV and 0.1 mg/mL DNase I for 45 min at 37°C with agitation, strained through a 70-μm filter, and washed in complete RPMI 1640. Splenic single cell suspensions were strained through 70-μm filters. Following ACK lysis and Fc Block in FACS buffer, the cells were stained in the following cocktail: Live/Dead Aqua; TCRγδ PE-Cy7 (GL3); CD4 Alexa Fluor 700 (RM4-5); CD8α BV785 (53-6.7); CD45 BV421 (30-F11); CD11a FITC (M17/4) (all from BioLegend); CD19 APC-Cy7 (1D3, BD PharMingen); CD49d PE (R1-2, eBioscience); Vδ6.3/2 BV650 (8F4H7B7, BD Biosciences). After fixation and permeabilization, cells were stained with anti-M-CSF (5A1, BD PharMingen) conjugated to Alexa Fluor 647 (Life Technologies).
For validating TRAV15N-1 (Vδ6.3) V-region usage, the cells were harvested from infected male and female C57BL/6 mice and were processed as described. After incubation in Fc Block, the cells were stained in the following cocktail: Live/Dead Aqua; Vδ6.3/2 PE (8F4H7B7, BD PharMingen); TCRγδ PE-Cy7 (GL3, BioLegend); CD3 PerCP-Cy5.5 (17A2, BioLegend); CD11a Alexa Fluor 647 (M17/4, BioLegend); CD49d FITC (R1-2, eBioscience); TRCβ APC-eFluor 780 (H57-597, eBioscience); and CD19 APC-Cy7 (1D3, BD PharMingen). Samples were acquired on an LSRII (BD Biosciences), and the resulting data were analyzed on FlowJo X (Tree Star).
To confirm the effects of in vivo administration of anti-γδTCR antibody (GL3), spleen and/or blood of antibody-treated animals were processed as described. After incubation in Fc Block, the cells were stained in the following cocktail: Live/Dead Aqua; CD3 PerCP-Cy5.5 (17A2, rat IgG2b isotype); CD4 Alexa Fluor 700 (RM4-5, rat IgG2a isotype); CD8α BV785 (53-6.7, rat IgG2a isotype) (all from BioLegend). Cells obtained from animals administered unconjugated antibodies were fixed, permeabilized, and stained with goat anti-Armenian Hamster IgG secondary antibody Alexa Fluor 488 (Poly4055, BioLegend). Samples were acquired on an LSRII (BD Biosciences), and the resulting data were analyzed on FlowJo X (Tree Star).
Tissues harvested from artesunate-treated animals were processed as described. After incubation in Fc Block, the cells were stained in the following cocktail: Live/Dead Aqua; TCRγδ PE-Cy7 (GL3); CD3 PerCP-Cy5.5 (17A2); CD11a Alexa Fluor 647 (M17/4); CD8α BV785 (53-6.7); CD4 Alexa Fluor 700 (RM4-5 or GK1.5); CD44 FITC (IM7); CD62L BV421 (MEL-14) (all from BioLegend); CD49d PE (R1-2, eBioscience); and CD19 APC-Cy7 (1D3, BD PharMingen). Samples were acquired on an LSRII (BD Biosciences), and the resulting data were analyzed on FlowJo X (Tree Star).
For single-cell TCR sequencing and RNA-sequencing, the tissues were processed as described. Cells were incubated in Fc Block, normal Syrian hamster serum (1:10, Jackson ImmunoResearch), and normal rat serum (1:10, Jackson ImmunoResearch) for 20 min at 4°C. Cells that were fluorescence activated cell sorted (FACS) for single-cell TCR sequencing were stained with the following cocktail: Live/Dead Aqua; TCRγδ PE-Cy7 (GL3, BioLegend); CD3 PerCP-Cy5.5 (17A2, BioLegend); TRCβ APC-eFluor 780 (H57-597, eBioscience); and CD19 APC-Cy7 (1D3, BD PharMingen). Splenocytes that were FACS sorted for whole transcriptome analysis were stained with the same antibodies, as well as with CD49d PE (R1-2, eBioscience) and CD11a Alexa Fluor 647 (M17/4, BioLegend). γδ T cells were FACS sorted on an Aria II cell sorter (BD Biosciences).
Frozen human peripheral blood mononuclear cells (PBMCs) were thawed and rested for at least 1 hour at 37°C in complete RPMI. After an incubation in Fc Block (Human TruStain FcX, BioLegend) for 20 min at 4°C, the cells were stained with the following cocktail: Live/Dead Aqua; CD19 PE-Cy7 (HIB19); TCRαβ PE-Cy7 (IP26); HLA-DR Alexa Fluor 647 (L243); CD38 BV421 (HIT2); CD27 BV650 (O323); CD45RA Alexa Fluor 700 (HI100); CD62L PerCP-Cy5.5 (DREG-56); CD56 Alexa Fluor 488 (HCD56); CD3 BV605 (OKT3) (all from BioLegend); and TCRγδ PE (5A6.E9, Life Technologies). Data were acquired on an Aria II.
M-CSF Protein Measurements
Previously snap-frozen tissues from transcardially perfused animals were homogenized in cOmplete Protease Inhibitor Cocktail (Sigma-Aldrich), sonicated, and filtered through a 1.2-μm filter. M-CSF levels were quantified with an ELISA kit following the manufacturer’s instructions (R&D Systems) (Bettina et al., 2016).
TCR and Whole Transcriptome Sequencing
For paired chain γδTCR sequencing, γδ T cells were single-cell sorted into OneStep RT-PCR Buffer (QIAGEN) in a 96-well PCR plate. Succeeding steps were performed following principles previously described, with the primers and PCR conditions obtained from a subsequent report adapting the technique to mouse γδTCR (Han et al., 2014; Wei et al., 2015). Modifications to these steps are detailed in this brief description. The first two steps are nested PCR reactions during which portions of the TCRγ and TCRδ loci capturing a part of the variable (V)-region, the complementarity-determining region 3 (CDR3), and the beginning of the constant (C)-region are amplified using V-region and C-region-targeting primers. In both PCR reactions, each V-region primer was at 0.0625 μM, and each C-region primer was at 0.6 μM. In this step, we followed the manufacturer’s instructions for the OneStep RT-PCR Kit (QIAGEN), with the reaction volume scaled down to 15 μL and the following cycling conditions: 50°C, 36 min; 95°C, 15 min; 25 cycles of [94°C, 30 s; 62°C, 1 min; 72°C, 1 min]; 72°C, 10 min; 4°C. For the second PCR reaction, we used 1 μL of the first reaction product in a new 15 μL reaction using the HotStartTaq Master Mix Kit (QIAGEN) in the following cycling conditions: 94°C, 15 min; 30 cycles of [94°C, 30 s; 62°C, 1 min; 72°C, 1 min]; 72°C, 5 min; 4°C. In the final PCR reaction, each well was barcoded. Also, for each original cell, the γ and δ products were amplified separately in this step. Using 1 μL of the second reaction product, a new 14 μL reaction using the HotStart Master Mix Kit in the following cycling conditions was performed: 95°C, 15 min; 36 cycles of [94°C, 15 s; 62°C, 1 min; 72, 1 min]; 72°C, 5 min; 4°C. All the primers were at 0.05 μM, except Paired End primers, which were at 0.5 μM. For each TCR chain (γ or δ) separately, the final product from all the wells was pooled, run on a 1% agarose gel, and purified using the QIAquick Gel Extraction Kit (QIAGEN). After analyzing the final products on the 2100 Bioanalyzer (Agilent Technologies), the TCRγ and TCRδ products were mixed in equal concentrations and sequenced on the MiSeq platform using a MiSeq Reagent Kit v2 (500 cycles) (Illumina).
For whole transcriptome sequencing, γδ T cells were bulk sorted directly into RNAprotect Cell Reagent (QIAGEN). RNA was extracted with an RNeasy Plus Micro Kit (QIAGEN). After analysis on the 2100 Bioanalyzer, the sequencing libraries were prepared using the RiboGone Mammalian rRNA Depletion Kit (Clontech) and the SMARTer Stranded RNA-Seq Kit (Clontech). The resulting library was sequenced on the HiSeq 4000 platform (Illumina).
In Vivo Antibody-Based Silencing and Neutralization Assays
C57BL/6 mice were infected as described earlier. Parasitemia, weight change, and temperature were measured. At 12 days post-infection (d.p.i.), the mice were split into groups equivalent according to the three measured parameters and were administered i.p. injections of the appropriate antibody: 200 μg anti-TCRγδ (GL3; Armenian hamster IgG; low endotoxin, azide-free [LEAF]; BioLegend); 200 μg Armenian Hamster IgG isotype control (HTK888; anti-trinitrophenol; LEAF; BioLegend); 1 mg anti-M-CSF (5A1; Rat IgG1; LEAF; Bio X Cell); 1 mg rat IgG1 isotype control (HRPN; anti-horseradish peroxidase; LEAF; Bio X Cell). An additional 1 mg dose was administered at 14 d.p.i. to the anti-M-CSF and the rat IgG1 isotype control groups.
To confirm that γδ T cells persist in infected animals after anti-TCRγδ antibody administration, P.c.c AJ-iRBC infected mice were injected i.p. at 12 d.p.i. with one of the following: 200 μg anti-TCRγδ (GL3; Armenian hamster IgG; low endotoxin, azide-free [LEAF]; BioLegend); 200 μg Armenian Hamster IgG isotype control (HTK888; anti-trinitrophenol; LEAF; BioLegend); 200 μg anti-TCRγδ Alexa Fluor 647 (GL3, BioLegend); 200 μg Armenian Hamster IgG isotype control Alexa Fluor 647 (HTK888, BioLegend). At 14 d.p.i., spleens and/or blood were processed as described earlier, stained, and analyzed by flow cytometry.
Sequencing Data Analysis
For each sample in the whole transcriptome sequencing library, 15–35 million 75-basepair paired-end reads were acquired from the sequencer. Read quality was determined with FastQC 0.11.4. Using STAR 2.4.2a, we aligned the reads to the mouse reference genome (NCBI37/mm9), with splice junctions defined by the GTF file (UCSC). On average, 70% of reads were aligned to the reference genome, and 65% of reads uniquely aligned to the reference genome. Gene expression was determined by calculating fragments per kilobase per million aligned reads (FPKM) using Cufflinks 2.2.1. Further, Cufflinks was used to determine differential expression between the two conditions – infected and uninfected. RSEM 1.2.30 was used to quantify relative abundance of Csf1 isoforms.
TCR sequencing data were analyzed using a custom pipeline that identified the dominant clone for each sequenced cell. The pipeline consisted of the following steps. Using our previously published algorithm, we combined R1 and R2 reads and identified the strand-encoded barcodes that identified a given cell (Han et al., 2014). The resulting reads were analyzed by MiGMAP 1.0.0, which uses IgBlast 1.4.0 (NCBI) to identify CDR3 sequences (Shugay et al., 2015; Ye et al., 2013). To ensure an unbiased clustering, we supplied the clustering algorithm CD-HIT 4.6.5 (95% similarity cut-off) with CDR3 nucleotide sequences from each cell separately without any accompanying V-D-J region information (Li and Godzik, 2006). For up to 3 top clusters by size with at least 10 reads for any given cell, all the reads in that cluster were aligned using MUSCLE 3.8.31 (Edgar, 2004). These multiple alignments were then used to generate a consensus DNA sequence using the cons program from EMBOSS 6.6.0 (Rice et al., 2000). Wherever needed, sequence manipulations were done using BioPerl 1.6.924 (Stajich et al., 2002). The final consensus sequences were analyzed using MiGMAP, which identifies the V-D-J usage, the CDR3 nucleotide and amino acid sequences, and the boundaries between the various germline and non-germline encoded portions of the CDR3. Due to the high level sequence homology among TRGV1, TRGV2, and TRGV3 V-regions in the PCR-amplified stretch of the TCR, we relied on Jγ-usage to distinguish among them based on the following established pairings: TRGV1-TRGJ4; TRGV3-TRGJ3; TRGV2-TRGJ2 (Carding and Egan, 2002). TRAV15N-2*01 and TRAV15D-2/DV6D-2*03 have identical IMGT nucleotide reference sequences, and these V-regions cannot be distinguished from the highly homologous TRAV15-2/DV6-2*02 V-region using the amplified portions of the TCR. We refer to these three V-regions collectively as TRAV15N-2.
For the purposes of identifying clonally expanded cells, we considered only cells with both γ- and δ-chains identified and productively rearranged, each chain with at least 30 reads. Additionally, we disregarded cells whose sequenced reads from the predominant δ-chain constituted fewer than 50% of all δ-chain reads from that cell, with a 30% cut-off for the γ-chain. For the purposes of quantifying V-region usage, we treated data from each TCR chain independently of the other chain – any identifiable δ-chain was counted regardless of whether the paired γ-chain was identified, and vice versa. Additionally, any group of cells that were classified as part of a single clonal expansion was counted as one instance in the quantification of V-region usage.
QUANTIFICATION AND STATISTICAL ANALYSIS
Data are shown as mean ± standard error of mean (SEM). Statistical analysis was done with Prism 7.0c (GraphPad Software, Inc.). Statistical significance was determined using a two-tailed, unpaired Student’s t test. Statistical significance is indicated as follows: not significant, NS > 0.05, *p < 0.05, ** p < 0.01, *** p < 0.001, **** p < 0.0001. Sample sizes (n) for all shown data can be found in the figure legends. Sample sizes were determined based on initial experiments.
DATA AND SOFTWARE AVAILABILITY
The RNA-seq data from expanded γδ T cells has been deposited in the Gene Expression Omnibus (GEO, NCBI) under accession code GSE108478.
Supplementary Material
Figure S1. Related to Figure 1. Changing amounts of αβ T cells and splenocytes during P. chabaudi infection.
(A and B) The frequency in the blood and spleen (A) and the absolute number in the spleen (B) of CD4+ and CD8+ αβ T cells taken from C57BL/6 mice infected with 105 Pcc AJ-iRBCs.
(C) The number of splenocytes in C57BL/6 mice infected with 105 Pcc AJ-iRBCs.
(A–C) n=4 per time-point. Data shown as mean ± SEM from one experiment.
Figure S2. Related to Figure 1. Activated phenotypes of αβ T cells during P. chabaudi infection.
(A–D) The frequencies of naïve (CD62L+CD44−), effector (CD62L−CD44+), and central memory (CD62L+CD44+) blood-borne CD4+ αβ T cells (A), splenic CD4+ αβ T cells (B), blood-borne CD8+ αβ T cells (C), and splenic CD8+ αβ T cells (D) in naïve (N) and infected C57BL/6 mice. Data shown as mean ± SEM from one experiment; n=4 per time-point.
Figure S3. Related to Figure 3. γδ T cells persist after anti-γδTCR antibody administration.
(A and B) Representative plots (A) and quantification (B) of CD3+Armenian Hamster IgG+ cells among live CD3+CD4−CD8− splenocytes obtained at 14 d.p.i. from infected C57BL/6 mice (n=4 per group). The animals were administered at 12 d.p.i. i.p. 200 μg of anti-γδTCR antibody (clone GL3, Armenian Hamster IgG isotype) or irrelevant Armenian Hamster IgG isotype control (clone HTK888; anti-trinitrophenol). After fixation and permeabilization, the cells were stained with goat anti-Armenian Hamster IgG secondary antibody. Data are representative of two independent experiments.
(C) Representative plots of CD3+Alexa Fluor 647+ cells among live CD3+CD4−CD8− cells obtained at 14 d.p.i. from infected C57BL/6 mice (n=3 per group). The animals were injected at 12 d.p.i. i.p. 200 μg of Alexa Fluor 647-conjugated anti-γδTCR (clone GL3, Armenian Hamster IgG isotype) or irrelevant Armenian Hamster IgG isotype control (clone HTK888; anti-trinitrophenol). None of the antibodies used in the staining panel were conjugated to Alexa Fluor 647 or equivalent dyes. Data shown are from one experiment.
Figure S4. Related to Figure 5. Global comparison of γδ T cells from infected and uninfected animals.
(A) Pairwise comparisons of the global transcriptomes of splenic γδ T cells from infected (1I-4I) and uninfected (1U-4U) mice as measured by Jensen-Shannon (JS) distance scores. Samples were collected at 19 d.p.i..
(B) Principle component (PC) analysis transformation of global transcription by gd T cells from infected and uninfected animals. Percentage of total variance accounted for by PC1 and PC2 shown.
(C) Normalized global transcription. Using gene expression measurements, the heat map shows Z-scores normalized within each gene of the entire identified transcriptome (9892 genes). Each row shows a separate gene.
Figure S5. Related to Figure 5. M-CSF staining across leukocytes.
(A) Representative FACS pseudocolor plots of intracellular M-CSF staining in splenic and blood-borne CD4+ αβ T cells (TCRβ+CD4+CD8− CD11b/CD11c−TCRγδ −), CD8+ αβ T cells (TCRβ+CD8+CD4− CD11b/CD11c−TCRγδ −), B cells (CD19+CD4−CD8−CD11b/CD11c−TCRγδ −), and myeloid cells (CD11b+ and/or CD11c+, CD3−TCRβ −TCRγδ −CD19−) from infected and uninfected vehicle control animals at 19 d.p.i. are shown. Data are representative of two independent experiments.
(B) Quantified M-CSF staining in splenic (S) and blood-borne (B) myeloid cells obtained from infected and uninfected vehicle control animals at 19 d.p.i. from two independent experiments.
(C) Frequency of blood-borne γδ T cells at 19 d.p.i. that are CCL5+ and CCL3+ with or without stimulation. Cells were cultured for 6 hours in the presence of protein trafficking inhibitors and in the absence or presence of PMA and ionomycin before staining. Data are representative of three independent experiments.
(A and B) n=5 per group, (C) n=4–5 per group. (B and C) Data shown as mean ± SEM. Twotailed, unpaired Student’s t-test.
Table S1. Related to Figure 5. Clusters of Upregulated Genes
Highlights.
γδ T cells are expanded and activated in the later stages of mouse and human malaria
Murine γδ T cells prevent late stage Plasmodium chabaudi recurrence
TRAVN-1+ (Vδ6.3+) γδ T cells clonally expand in the blood, spleen, lung, and liver
Expanded γδ T cells express M-CSF, which protects against parasitemic recurrence
Acknowledgments
We thank members of the Davis and Chien laboratories, A. Han, C. Tato, and K. Yadava for helpful discussion and advice; A. Nau, X. Ji, V. Shokoohi for experimental help; volunteers in the CHMI study; Stanford Shared FACS Facility and Functional Genomics Facility for equipment and services. M.R.M. was supported under an NIH Training Grant (T32AI729029). Work was supported by US National Institutes of Health (5U19AI057229 to M.M.D.) and the Stanford University School of Medicine (Discovery Innovation Fund to Y.-h.C.). M.M.D. is supported by the Howard Hughes Medical Institute and the Bill & Melinda Gates Foundation.
Footnotes
AUTHOR CONTRIBUTIONS
M.R.M. conceived the project; conceived, designed, and performed the experiments; analyzed data; and wrote the manuscript. R.V.N. and Y.Z. analyzed sequencing data. K.C., J.H.M.O., and D.L.T. assisted with mouse infections and experimental design. J.A.K. and N.S. assisted with experiments and experimental design. F.R. helped with experimental design. A.S., D.S.S., Y.-h.C., and R.W.S. provided expertise, reagents, samples, and helped with experimental design. M.M.D. conceived the project and experiments and wrote the manuscript.
DECLARATION OF INTERESTS
The authors declare no competing interests.
Supplemental Information includes five figures and one table and can be found with this article online at https://doi.org/10.1016/j.immuni.2018.01.009.
References
- Alexander AAZ, Maniar A, Cummings JS, Hebbeler AM, Schulze DH, Gastman BR, Pauza CD, Strome SE, Chapoval AI. Isopentenyl pyrophosphate-activated CD56+ γδ T lymphocytes display potent antitumor activity toward human squamous cell carcinoma. Clin Cancer Res. 2008;14:4232–4240. doi: 10.1158/1078-0432.CCR-07-4912. [DOI] [PMC free article] [PubMed] [Google Scholar]
- Arden B, Klotz JL, Siu G, Hood LE. Diversity and structure of genes of the α family of mouse T-cell antigen receptor. Nature. 1985;316:783–787. doi: 10.1038/316783a0. [DOI] [PubMed] [Google Scholar]
- Ashley EA, Dhorda M, Fairhurst RM, Amaratunga C, Lim P, Suon S, Sreng S, Anderson JM, Mao S, Sam B, et al. Tracking Resistance to Artemisinin Collaboration (TRAC) Spread of artemisinin resistance in Plasmodium falciparum malaria. N Engl J Med. 2014;371:411–423. doi: 10.1056/NEJMoa1314981. [DOI] [PMC free article] [PubMed] [Google Scholar]
- Bettina A, Zhang Z, Michels K, Cagnina RE, Vincent IS, Burdick MD, Kadl A, Mehrad B. M-CSF Mediates Host Defense during Bacterial Pneumonia by Promoting the Survival of Lung and Liver Mononuclear Phagocytes. J Immunol. 2016;196:5047–5055. doi: 10.4049/jimmunol.1600306. [DOI] [PMC free article] [PubMed] [Google Scholar]
- Bonneville M, O’Brien RL, Born WK. Gammadelta T cell effector functions: a blend of innate programming and acquired plasticity. Nat Rev Immunol. 2010;10:467–478. doi: 10.1038/nri2781. [DOI] [PubMed] [Google Scholar]
- Born W, Hall L, Dallas A, Boymel J, Shinnick T, Young D, Brennan P, O’Brien R. Recognition of a peptide antigen by heat shock–reactive γδ T lymphocytes. Science. 1990;249:67–69. doi: 10.1126/science.1695022. [DOI] [PubMed] [Google Scholar]
- Born WK, Vollmer M, Reardon C, Matsuura E, Voelker DR, Giclas PC, O’Brien RL. Hybridomas expressing gammadelta T-cell receptors respond to cardiolipin and β2-glycoprotein 1 (apolipoprotein H) Scand J Immunol. 2003;58:374–381. doi: 10.1046/j.1365-3083.2003.01315.x. [DOI] [PubMed] [Google Scholar]
- Brugat T, Cunningham D, Sodenkamp J, Coomes S, Wilson M, Spence PJ, Jarra W, Thompson J, Scudamore C, Langhorne J. Sequestration and histopathology in Plasmodium chabaudi malaria are influenced by the immune response in an organ-specific manner. Cell Microbiol. 2014;16:687–700. doi: 10.1111/cmi.12212. [DOI] [PMC free article] [PubMed] [Google Scholar]
- Butler NS, Moebius J, Pewe LL, Traore B, Doumbo OK, Tygrett LT, Waldschmidt TJ, Crompton PD, Harty JT. Therapeutic blockade of PD-L1 and LAG-3 rapidly clears established blood-stage Plasmodium infection. Nat Immunol. 2011;13:188–195. doi: 10.1038/ni.2180. [DOI] [PMC free article] [PubMed] [Google Scholar]
- Cady CT, Lahn M, Vollmer M, Tsuji M, Seo SJ, Reardon CL, O’Brien RL, Born WK. Response of murine γδ T cells to the synthetic polypeptide poly-Glu50Tyr50. J Immunol. 2000;165:1790–1798. doi: 10.4049/jimmunol.165.4.1790. [DOI] [PubMed] [Google Scholar]
- Carding SR, Egan PJ. γδ T cells: functional plasticity and heterogeneity. Nat Rev Immunol. 2002;2:336–345. doi: 10.1038/nri797. [DOI] [PubMed] [Google Scholar]
- Carding SR, Allan W, Kyes S, Hayday A, Bottomly K, Doherty PC. Late dominance of the inflammatory process in murine influenza by γ/δ + T cells. J Exp Med. 1990;172:1225–1231. doi: 10.1084/jem.172.4.1225. [DOI] [PMC free article] [PubMed] [Google Scholar]
- Chien YH, Meyer C, Bonneville M. γδ T cells: first line of defense and beyond. Annu Rev Immunol. 2014;32:121–155. doi: 10.1146/annurev-immunol-032713-120216. [DOI] [PubMed] [Google Scholar]
- Cohen NR, Brennan PJ, Shay T, Watts GF, Brigl M, Kang J, Brenner MB ImmGen Project Consortium. Shared and distinct transcriptional programs underlie the hybrid nature of iNKT cells. Nat Immunol. 2013;14:90–99. doi: 10.1038/ni.2490. [DOI] [PMC free article] [PubMed] [Google Scholar]
- Cowman AF, Healer J, Marapana D, Marsh K. Malaria: Biology and Disease. Cell. 2016;167:610–624. doi: 10.1016/j.cell.2016.07.055. [DOI] [PubMed] [Google Scholar]
- Edgar RC. MUSCLE: multiple sequence alignment with high accuracy and high throughput. Nucleic Acids Res. 2004;32:1792–1797. doi: 10.1093/nar/gkh340. [DOI] [PMC free article] [PubMed] [Google Scholar]
- Fontana MF, de Melo GL, Anidi C, Hamburger R, Kim CY, Lee SY, Pham J, Kim CC. Macrophage colony stimulating factor derived from CD4+ T cells contributes to control of a blood-borne infection. PLoS Pathog. 2016;12:e1006046. doi: 10.1371/journal.ppat.1006046. [DOI] [PMC free article] [PubMed] [Google Scholar]
- Fu YX, Cranfill R, Vollmer M, Van Der Zee R, O’Brien RL, Born W. In vivo response of murine γδ T cells to a heat shock protein-derived peptide. Proc Natl Acad Sci USA. 1993;90:322–326. doi: 10.1073/pnas.90.1.322. [DOI] [PMC free article] [PubMed] [Google Scholar]
- Goodier MR, Lundqvist C, Hammarström ML, Troye-Blomberg M, Langhorne J. Cytokine profiles for human Vγ9+ T cells stimulated by Plasmodium falciparum. Parasite Immunol. 1995;17:413–423. doi: 10.1111/j.1365-3024.1995.tb00909.x. [DOI] [PubMed] [Google Scholar]
- Griffith JW, Sokol CL, Luster AD. Chemokines and chemokine receptors: positioning cells for host defense and immunity. Annu Rev Immunol. 2014;32:659–702. doi: 10.1146/annurev-immunol-032713-120145. [DOI] [PubMed] [Google Scholar]
- Han A, Newell EW, Glanville J, Fernandez-Becker N, Khosla C, Chien YH, Davis MM. Dietary gluten triggers concomitant activation of CD4+ and CD8+ αβ T cells and γδ T cells in celiac disease. Proc Natl Acad Sci USA. 2013;110:13073–13078. doi: 10.1073/pnas.1311861110. [DOI] [PMC free article] [PubMed] [Google Scholar]
- Han A, Glanville J, Hansmann L, Davis MM. Linking T-cell receptor sequence to functional phenotype at the single-cell level. Nat Biotechnol. 2014;32:684–692. doi: 10.1038/nbt.2938. [DOI] [PMC free article] [PubMed] [Google Scholar]
- Happ MP, Kubo RT, Palmer E, Born WK, O’Brien RL. Limited receptor repertoire in a mycobacteria-reactive subset of γδ T lymphocytes. Nature. 1989;342:696–698. doi: 10.1038/342696a0. [DOI] [PubMed] [Google Scholar]
- Ho M, Tongtawe P, Kriangkum J, Wimonwattrawatee T, Pattanapanyasat K, Bryant L, Shafiq J, Suntharsamai P, Looareesuwan S, Webster HK, Elliott JF. Polyclonal expansion of peripheral γδ T cells in human Plasmodium falciparum malaria. Infect Immun. 1994;62:855–862. doi: 10.1128/iai.62.3.855-862.1994. [DOI] [PMC free article] [PubMed] [Google Scholar]
- Hviid L, Kurtzhals JAL, Adabayeri V, Loizon S, Kemp K, Goka BQ, Lim A, Mercereau-Puijalon O, Akanmori BD, Behr C. Perturbation and proinflammatory type activation of Vδ1(+) γδ T cells in African children with Plasmodium falciparum malaria. Infect Immun. 2001;69:3190–3196. doi: 10.1128/IAI.69.5.3190-3196.2001. [DOI] [PMC free article] [PubMed] [Google Scholar]
- Ishizuka AS, Lyke KE, DeZure A, Berry AA, Richie TL, Mendoza FH, Enama ME, Gordon IJ, Chang LJ, Sarwar UN, et al. Protection against malaria at 1 year and immune correlates following PfSPZ vaccination. Nat Med. 2016;22:614–623. doi: 10.1038/nm.4110. [DOI] [PMC free article] [PubMed] [Google Scholar]
- Jensen KDC, Su X, Shin S, Li L, Youssef S, Yamasaki S, Steinman L, Saito T, Locksley RM, Davis MM, et al. Thymic selection determines gammadelta T cell effector fate: antigen-naive cells make interleukin-17 and antigen-experienced cells make interferon γ. Immunity. 2008;29:90–100. doi: 10.1016/j.immuni.2008.04.022. [DOI] [PMC free article] [PubMed] [Google Scholar]
- Koenecke C, Chennupati V, Schmitz S, Malissen B, Förster R, Prinz I. In vivo application of mAb directed against the gammadelta TCR does not deplete but generates “invisible” gammadelta T cells. Eur J Immunol. 2009;39:372–379. doi: 10.1002/eji.200838741. [DOI] [PubMed] [Google Scholar]
- Langhorne J, Pells S, Eichmann K. Phenotypic characterization of splenic T cells from mice infected with Plasmodium chabaudi chabaudi. Scand J Immunol. 1993;38:521–528. doi: 10.1111/j.1365-3083.1993.tb03235.x. [DOI] [PubMed] [Google Scholar]
- Langhorne J, Mombaerts P, Tonegawa S. αβ and γδ T cells in the immune response to the erythrocytic stages of malaria in mice. Int Immunol. 1995;7:1005–1011. doi: 10.1093/intimm/7.6.1005. [DOI] [PubMed] [Google Scholar]
- Lee SH, Looareesuwan S, Chan J, Wilairatana P, Vanijanonta S, Chong SM, Chong BH. Plasma macrophage colony-stimulating factor and P-selectin levels in malaria-associated thrombocytopenia. Thromb Haemost. 1997;77:289–293. [PubMed] [Google Scholar]
- Li W, Godzik A. Cd-hit: a fast program for clustering and comparing large sets of protein or nucleotide sequences. Bioinformatics. 2006;22:1658–1659. doi: 10.1093/bioinformatics/btl158. [DOI] [PubMed] [Google Scholar]
- McCall MBB, Sauerwein RW. Interferon-γ–central mediator of protective immune responses against the pre-erythrocytic and blood stage of malaria. J Leukoc Biol. 2010;88:1131–1143. doi: 10.1189/jlb.0310137. [DOI] [PubMed] [Google Scholar]
- O’Brien RL, Fu YX, Cranfill R, Dallas A, Ellis C, Reardon C, Lang J, Carding SR, Kubo R, Born W. Heat shock protein Hsp60-reactive γδ cells: a large, diversified T-lymphocyte subset with highly focused specificity. Proc Natl Acad Sci USA. 1992;89:4348–4352. doi: 10.1073/pnas.89.10.4348. [DOI] [PMC free article] [PubMed] [Google Scholar]
- Qin G, Liu Y, Zheng J, Xiang Z, Ng IHY, Malik Peiris JS, Lau YL, Tu W. Phenotypic and functional characterization of human γδ T-cell subsets in response to influenza A viruses. J Infect Dis. 2012;205:1646–1653. doi: 10.1093/infdis/jis253. [DOI] [PubMed] [Google Scholar]
- Rice P, Longden I, Bleasby A. EMBOSS: the European molecular biology open software suite. Trends Genet. 2000;16:276–277. doi: 10.1016/s0168-9525(00)02024-2. [DOI] [PubMed] [Google Scholar]
- Roussilhon C, Agrapart M, Guglielmi P, Bensussan A, Brasseur P, Ballet JJ. Human TcRγδ+ lymphocyte response on primary exposure to Plasmodium falciparum. Clin Exp Immunol. 1994;95:91–97. doi: 10.1111/j.1365-2249.1994.tb06020.x. [DOI] [PMC free article] [PubMed] [Google Scholar]
- Schats R, Bijker EM, van Gemert GJ, Graumans W, van de Vegte-Bolmer M, van Lieshout L, Haks MC, Hermsen CC, Scholzen A, Visser LG, Sauerwein RW. Heterologous protection against malaria after immunization with Plasmodium falciparum sporozoites. PLoS ONE. 2015;10:e0124243. doi: 10.1371/journal.pone.0124243. [DOI] [PMC free article] [PubMed] [Google Scholar]
- Seder RA, Chang LJ, Enama ME, Zephir KL, Sarwar UN, Gordon IJ, Holman LA, James ER, Billingsley PF, Gunasekera A, et al. VRC 312 Study Team. Protection against malaria by intravenous immunization with a nonreplicating sporozoite vaccine. Science. 2013;341:1359–1365. doi: 10.1126/science.1241800. [DOI] [PubMed] [Google Scholar]
- Seixas EM, Langhorne J. γδ T cells contribute to control of chronic parasitemia in Plasmodium chabaudi infections in mice. J Immunol. 1999;162:2837–2841. [PubMed] [Google Scholar]
- Seixas E, Fonseca L, Langhorne J. The influence of gamma-delta T cells on the CD4+ T cell and antibody response during a primary Plasmodium chabaudi chabaudi infection in mice. Parasite Immunol. 2002;24:131–140. doi: 10.1046/j.1365-3024.2002.00446.x. [DOI] [PubMed] [Google Scholar]
- Shibata K, Yamada H, Hara H, Kishihara K, Yoshikai Y. Resident Vdelta1+ gammadelta T cells control early infiltration of neutrophils after Escherichia coli infection via IL-17 production. J Immunol. 2007;178:4466–4472. doi: 10.4049/jimmunol.178.7.4466. [DOI] [PubMed] [Google Scholar]
- Shugay M, Bagaev DV, Turchaninova MA, Bolotin DA, Britanova OV, Putintseva EV, Pogorelyy MV, Nazarov VI, Zvyagin IV, Kirgizova VI, et al. VDJtools: unifying post-analysis of T cell receptor repertoires. PLoS Comput Biol. 2015;11:e1004503. doi: 10.1371/journal.pcbi.1004503. [DOI] [PMC free article] [PubMed] [Google Scholar]
- Silva-Santos B, Serre K, Norell H. γδ T cells in cancer. Nat Rev Immunol. 2015;15:683–691. doi: 10.1038/nri3904. [DOI] [PubMed] [Google Scholar]
- Skeen MJ, Freeman MM, Ziegler HK. Changes in peritoneal myeloid populations and their proinflammatory cytokine expression during infection with Listeria monocytogenes are altered in the absence of γ/δ T cells. J Leukoc Biol. 2004;76:104–115. doi: 10.1189/jlb.1103574. [DOI] [PubMed] [Google Scholar]
- Spence PJ, Cunningham D, Jarra W, Lawton J, Langhorne J, Thompson J. Transformation of the rodent malaria parasite Plasmodium chabaudi. Nat Protoc. 2011;6:553–561. doi: 10.1038/nprot.2011.313. [DOI] [PMC free article] [PubMed] [Google Scholar]
- Spence PJ, Jarra W, Lévy P, Reid AJ, Chappell L, Brugat T, Sanders M, Berriman M, Langhorne J. Vector transmission regulates immune control of Plasmodium virulence. Nature. 2013;498:228–231. doi: 10.1038/nature12231. [DOI] [PMC free article] [PubMed] [Google Scholar]
- Sponaas AM, Freitas do Rosário AP, Voisine C, Mastelic B, Thompson J, Koernig S, Jarra W, Renia L, Mauduit M, Potocnik AJ, Langhorne J. Migrating monocytes recruited to the spleen play an important role in control of blood stage malaria. Blood. 2009;114:5522–5531. doi: 10.1182/blood-2009-04-217489. [DOI] [PubMed] [Google Scholar]
- Stajich JE, Block D, Boulez K, Brenner SE, Chervitz SA, Dagdigian C, Fuellen G, Gilbert JGR, Korf I, Lapp H, et al. The Bioperl toolkit: Perl modules for the life sciences. Genome Res. 2002;12:1611–1618. doi: 10.1101/gr.361602. [DOI] [PMC free article] [PubMed] [Google Scholar]
- Stanley ER, Chitu V. CSF-1 receptor signaling in myeloid cells. Cold Spring Harb Perspect Biol. 2014;6:6. doi: 10.1101/cshperspect.a021857. [DOI] [PMC free article] [PubMed] [Google Scholar]
- Teirlinck AC, McCall MBB, Roestenberg M, Scholzen A, Woestenenk R, de Mast Q, van der Ven AJAM, Hermsen CC, Luty AJF, Sauerwein RW. Longevity and composition of cellular immune responses following experimental Plasmodium falciparum malaria infection in humans. PLoS Pathog. 2011;7:e1002389. doi: 10.1371/journal.ppat.1002389. [DOI] [PMC free article] [PubMed] [Google Scholar]
- Tsuji M, Mombaerts P, Lefrancois L, Nussenzweig RS, Zavala F, Tonegawa S. γδ T cells contribute to immunity against the liver stages of malaria in αβ T-cell-deficient mice. Proc Natl Acad Sci USA. 1994;91:345–349. doi: 10.1073/pnas.91.1.345. [DOI] [PMC free article] [PubMed] [Google Scholar]
- Tsuji M, Eyster CL, O’Brien RL, Born WK, Bapna M, Reichel M, Nussenzweig RS, Zavala F. Phenotypic and functional properties of murine γδ T cell clones derived from malaria immunized, αβ T cell-deficient mice. Int Immunol. 1996;8:359–366. doi: 10.1093/intimm/8.3.359. [DOI] [PubMed] [Google Scholar]
- van der Heyde HC, Elloso MM, Roopenian DC, Manning DD, Weidanz WP. Expansion of the CD4-, CD8- γδ T cell subset in the spleens of mice during non-lethal blood-stage malaria. Eur J Immunol. 1993;23:1846–1850. doi: 10.1002/eji.1830230817. [DOI] [PubMed] [Google Scholar]
- Villeval JL, Gearing A, Metcalf D. Changes in hemopoietic and regulator levels in mice during fatal or nonfatal malarial infections. II. Nonerythroid populations. Exp Parasitol. 1990;71:375–385. doi: 10.1016/0014-4894(90)90063-i. [DOI] [PubMed] [Google Scholar]
- Wei YL, Han A, Glanville J, Fang F, Zuniga LA, Lee JS, Cua DJ, Chien YH. A highly focused antigen receptor repertoire characterizes γδ T cells that are poised to make IL-17 rapidly in naive animals. Front Immunol. 2015;6:118. doi: 10.3389/fimmu.2015.00118. [DOI] [PMC free article] [PubMed] [Google Scholar]
- Weidanz WP, Kemp JR, Batchelder JM, Cigel FK, Sandor M, Heyde HC. Plasticity of immune responses suppressing parasitemia during acute Plasmodium chabaudi malaria. J Immunol. 1999;162:7383–7388. [PubMed] [Google Scholar]
- Welte T, Aronson J, Gong B, Rachamallu A, Mendell N, Tesh R, Paessler S, Born WK, O’Brien RL, Wang T. Vγ4+ T cells regulate host immune response to West Nile virus infection. FEMS Immunol Med Microbiol. 2011;63:183–192. doi: 10.1111/j.1574-695X.2011.00840.x. [DOI] [PMC free article] [PubMed] [Google Scholar]
- World Health Organization. World Malaria Report 2016. 2016. pp. 1–186. [Google Scholar]
- Ye J, Ma N, Madden TL, Ostell JM. IgBLAST: an immunoglobulin variable domain sequence analysis tool. Nucleic Acids Res. 2013;41:W34–W40. doi: 10.1093/nar/gkt382. [DOI] [PMC free article] [PubMed] [Google Scholar]
- Zachariadis O, Cassidy JP, Brady J, Mahon BP. gammadelta T cells regulate the early inflammatory response to Bordetella pertussis infection in the murine respiratory tract. Infect Immun. 2006;74:1837–1845. doi: 10.1128/IAI.74.3.1837-1845.2006. [DOI] [PMC free article] [PubMed] [Google Scholar]
Associated Data
This section collects any data citations, data availability statements, or supplementary materials included in this article.
Supplementary Materials
Figure S1. Related to Figure 1. Changing amounts of αβ T cells and splenocytes during P. chabaudi infection.
(A and B) The frequency in the blood and spleen (A) and the absolute number in the spleen (B) of CD4+ and CD8+ αβ T cells taken from C57BL/6 mice infected with 105 Pcc AJ-iRBCs.
(C) The number of splenocytes in C57BL/6 mice infected with 105 Pcc AJ-iRBCs.
(A–C) n=4 per time-point. Data shown as mean ± SEM from one experiment.
Figure S2. Related to Figure 1. Activated phenotypes of αβ T cells during P. chabaudi infection.
(A–D) The frequencies of naïve (CD62L+CD44−), effector (CD62L−CD44+), and central memory (CD62L+CD44+) blood-borne CD4+ αβ T cells (A), splenic CD4+ αβ T cells (B), blood-borne CD8+ αβ T cells (C), and splenic CD8+ αβ T cells (D) in naïve (N) and infected C57BL/6 mice. Data shown as mean ± SEM from one experiment; n=4 per time-point.
Figure S3. Related to Figure 3. γδ T cells persist after anti-γδTCR antibody administration.
(A and B) Representative plots (A) and quantification (B) of CD3+Armenian Hamster IgG+ cells among live CD3+CD4−CD8− splenocytes obtained at 14 d.p.i. from infected C57BL/6 mice (n=4 per group). The animals were administered at 12 d.p.i. i.p. 200 μg of anti-γδTCR antibody (clone GL3, Armenian Hamster IgG isotype) or irrelevant Armenian Hamster IgG isotype control (clone HTK888; anti-trinitrophenol). After fixation and permeabilization, the cells were stained with goat anti-Armenian Hamster IgG secondary antibody. Data are representative of two independent experiments.
(C) Representative plots of CD3+Alexa Fluor 647+ cells among live CD3+CD4−CD8− cells obtained at 14 d.p.i. from infected C57BL/6 mice (n=3 per group). The animals were injected at 12 d.p.i. i.p. 200 μg of Alexa Fluor 647-conjugated anti-γδTCR (clone GL3, Armenian Hamster IgG isotype) or irrelevant Armenian Hamster IgG isotype control (clone HTK888; anti-trinitrophenol). None of the antibodies used in the staining panel were conjugated to Alexa Fluor 647 or equivalent dyes. Data shown are from one experiment.
Figure S4. Related to Figure 5. Global comparison of γδ T cells from infected and uninfected animals.
(A) Pairwise comparisons of the global transcriptomes of splenic γδ T cells from infected (1I-4I) and uninfected (1U-4U) mice as measured by Jensen-Shannon (JS) distance scores. Samples were collected at 19 d.p.i..
(B) Principle component (PC) analysis transformation of global transcription by gd T cells from infected and uninfected animals. Percentage of total variance accounted for by PC1 and PC2 shown.
(C) Normalized global transcription. Using gene expression measurements, the heat map shows Z-scores normalized within each gene of the entire identified transcriptome (9892 genes). Each row shows a separate gene.
Figure S5. Related to Figure 5. M-CSF staining across leukocytes.
(A) Representative FACS pseudocolor plots of intracellular M-CSF staining in splenic and blood-borne CD4+ αβ T cells (TCRβ+CD4+CD8− CD11b/CD11c−TCRγδ −), CD8+ αβ T cells (TCRβ+CD8+CD4− CD11b/CD11c−TCRγδ −), B cells (CD19+CD4−CD8−CD11b/CD11c−TCRγδ −), and myeloid cells (CD11b+ and/or CD11c+, CD3−TCRβ −TCRγδ −CD19−) from infected and uninfected vehicle control animals at 19 d.p.i. are shown. Data are representative of two independent experiments.
(B) Quantified M-CSF staining in splenic (S) and blood-borne (B) myeloid cells obtained from infected and uninfected vehicle control animals at 19 d.p.i. from two independent experiments.
(C) Frequency of blood-borne γδ T cells at 19 d.p.i. that are CCL5+ and CCL3+ with or without stimulation. Cells were cultured for 6 hours in the presence of protein trafficking inhibitors and in the absence or presence of PMA and ionomycin before staining. Data are representative of three independent experiments.
(A and B) n=5 per group, (C) n=4–5 per group. (B and C) Data shown as mean ± SEM. Twotailed, unpaired Student’s t-test.
Table S1. Related to Figure 5. Clusters of Upregulated Genes