

Abstract
The present study examined synaptic communication between direct and indirect output pathway striatal medium-sized spiny neurons (MSNs) and their target structures, the substantia nigra pars reticulata (SNr) and the external globus pallidus (GPe) in two mouse models of Huntington's disease (HD). Cre recombination, optogenetics, and whole-cell patch-clamp recordings were used to determine alterations in intrinsic and synaptic properties of SNr and GPe neurons from both male and female symptomatic R6/2 (>60 d) and presymptomatic (2 months) or symptomatic (10–12 months) YAC128 mice. Cell membrane capacitance was decreased, whereas input resistance was increased in SNr neurons from R6/2, but not YAC128 mice. The amplitude of GABAergic responses evoked by optogenetic stimulation of direct pathway terminals was reduced in SNr neurons of symptomatic mice of both models. A decrease in spontaneous GABA synaptic activity, in particular large-amplitude events, in SNr neurons also was observed. Passive membrane properties of GPe neurons were not different between R6/2 or YAC128 mice and their control littermates. Similarly, the amplitude of GABA responses evoked by activation of indirect pathway MSN terminals and the frequency of spontaneous GABA synaptic activity were similar in HD and control animals. In contrast, the decay time of the evoked GABA response was significantly longer in cells from HD mice. Interestingly, activation of indirect pathway MSNs within the striatum evoked larger-amplitude responses in direct pathway MSNs. Together, these results demonstrate differential alterations in responses evoked by direct and indirect pathway terminals in SNr and GPe leading to striatal output imbalance and motor dysfunction.
SIGNIFICANCE STATEMENT Previous work on Huntington's disease (HD) focused on striatal medium-sized spiny neurons (MSNs) almost exclusively. Little is known about the effects that alterations in the striatum have on output structures of the direct and indirect pathways, the substantia nigra pars reticulata (SNr) and the external segment of the globus pallidus (GPe), respectively. We combined electrophysiological and optogenetic methods to examine responses evoked by selective activation of terminals of direct and indirect pathway MSNs in SNr and GPe neurons in two mouse models of HD. We show a differential disruption of synaptic communication between the direct and indirect output pathways of the striatum with their target regions leading to an imbalance of striatal output, which will contribute to motor dysfunction.
Keywords: electrophysiology, external globus pallidus, Huntington's disease, optogenetics, substantia nigra, synaptic activity
Introduction
Huntington's disease (HD) is a progressive autosomal dominant neurodegenerative disorder characterized by motor, cognitive, and psychiatric symptoms (Haddad and Cummings, 1997; Harper and Jones, 2002). It is caused by an abnormal expansion of CAG repeats in exon 1 of the huntingtin (Htt) gene (Huntington's Disease Collaborative Research Group, 1993). In HD, the principal neuropathology is the loss of medium-sized spiny neurons (MSNs) in the striatum (Vonsattel and DiFiglia, 1998). Prominent laminar thinning and white matter/neuronal loss in the cerebral cortex also occur as the disease progresses (Rosas et al., 2006). Although significant strides have been made since the discovery of the gene, most studies have focused on examination of mechanistic changes that occur in the striatum and cerebral cortex (Rebec et al., 2006; Miller et al., 2008; Walker et al., 2008; Cummings et al., 2009; Cepeda et al., 2010). In particular, altered intrinsic and synaptic properties observed in striatal neurons are likely to affect information processing along the entire cortico-basal ganglia-thalamo-cortical loop (Cepeda et al., 2007).
MSNs are striatal output neurons that give rise to two distinct pathways: the direct and the indirect. Direct pathway MSNs project to the substantia nigra pars reticulata (SNr), whereas indirect pathway MSNs project to the external segment of the globus pallidus (GPe). MSNs of the indirect pathway appear to be affected earlier in HD than the direct pathway MSNs, and this is thought to cause chorea (Reiner et al., 1988; Albin et al., 1992). However, little is known about how MSN dysfunction affects the target neurons of the two output regions. Limitations have been caused by our inability to tease apart the influence of the two pathways using traditional techniques, such as electrical stimulation. This limitation has been overcome by the introduction of genetically engineered mice expressing Cre in specific neuronal populations, that is, dopamine (DA) D1 (for the direct pathway), D2 or adenosine 2A (A2A) (for the indirect pathway) receptor-expressing MSNs, combined with optogenetic techniques that allow selective activation of each population (Zhang et al., 2006; Gong et al., 2007; Durieux et al., 2009).
In the present study, we used in vitro electrophysiology and optogenetics to examine how the communication between MSNs of the direct and indirect pathways with their respective targets and among each subgroup in the striatum are affected with disease progression in two mouse models of HD: the R6/2 and the YAC128. The R6/2 was the first and most widely used transgenic mouse model. It contains exon 1 of the mutant HD gene and produces an aggressive phenotype similar to juvenile HD. R6/2 mice become fully symptomatic by 2 months of age (Mangiarini et al., 1996). The second model we used, the YAC128, consists of full-length human mutant Htt in a yeast artificial chromosome containing 128 CAG repeats (Slow et al., 2003). The YAC128 model displays a less severe phenotype than the R6/2, similar to adult-onset HD, and it takes ∼1 year to fully develop the phenotype. Symptomatic R6/2 mice (>2 months of age) and both presymptomatic (2 months) and symptomatic (12 months) YAC128 mice were examined. For all groups, the membrane and synaptic properties of both GPe and SNr were examined.
Materials and Methods
Animals.
All experimental procedures were performed in accordance with the Public Health Service Guide for the care and use of laboratory animals and were approved by the Institutional Animal Care and Use Committee at the University of California–Los Angeles. DA D1-Cre (RRID:MMRRC_030989-UCD), D2-Cre (RRID:MMRRC_032108-UCD), A2A-Cre (RRID:MMRRC_036158-UCD), and YAC128 mice were obtained from our colony at the University of California–Los Angeles. R6/2 mice were obtained from The Jackson Laboratory and our own colony. D1-, D2-, and A2A-Cre mice were crossed with wild-type (WT) female C57BL/6xCBA mice transplanted with R6/2 ovaries or with YAC128 mice to generate R6/2, YAC128, and WT littermates expressing D1-, D2-, or A2A-Cre. All mice were genotyped twice: once at weaning and again after electrophysiological recordings. CAG repeat lengths for R6/2 mice averaged ∼155 repeats. Every effort was made to minimize pain, discomfort, and the number of mice used. Both male and female mice were used. There were no consistent differences between sexes on all measures examined and data were pooled.
Cell visualization and electrophysiology.
Detailed procedures for slice preparation and cell visualization have been published previously (Cepeda et al., 2013; Holley et al., 2015). Briefly, mice were deeply anesthetized with isoflurane and killed. The brain was rapidly removed and placed in either ice-cold high sucrose slice solution (D1-Cre mice) containing the following (in mm): 208 sucrose, 2.5 KCl, 1.25 NaH2PO4, 26 NaHCO3, 1.3 MgCl2, 8 MgSO4, and 10 glucose or ice-cold NMDG solution (D2-Cre mice) containing the following (in mm): 102 NMDG, 3 KCl, 1.25 NaH2PO4, 30 NaHCO3, 20 HEPES, 0.5 CaCl2, 10 MgSO4, 85 HCl, and 40 glucose. In our hands, high sucrose slice solution produced a higher yield of SNr neurons, whereas NMDG-based solution was better suited for GPe recordings. Either coronal (D1-Cre) or sagittal (D2-Cre) slices were cut (300 μm) with a microslicer (VT1000S; Leica Microsystems) and transferred to an incubating chamber with ACSF containing the following (in mm): 130 NaCl, 3 KCl, 1.25 NaH2PO4, 26 NaHCO3, 2 CaCl2, 2 MgCl2, and 10 glucose, oxygenated with 95% O2-5% CO2, pH 7.2–7.4, 290–310 mOsm. Recordings began after at least 1 h incubation at room temperature. The microscope (Carl Zeiss Axioskop) was equipped with differential interference contrast optics and infrared illumination. Cells were visualized with an infrared-sensitive CCD camera (Hamamatsu C2400). Cell-attached and whole-cell patch-clamp recordings in voltage-clamp mode were obtained with a MultiClamp 700B Amplifier (Molecular Devices) and pClamp (version 10.2). Patch pipettes (3–5 mΩ) contained a Cs-methanesulfonate-based internal solution with the following salt concentrations (in mm): 130 Cs-methanesulfonate, 10 CsCl, 4 NaCl, 1 MgCl2, 5 MgATP, 5 EGTA, 10 HEPES, 5 GTP, 10 phosphocreatine, and 0.1 leupeptin, pH 7.2 with CsOH, 270 mOsm. The internal solution also contained biocytin (0.2%) for subsequent morphological cell characterization. Pipette access resistances were <25 mΩ. Burst activity was determined visually in cell-attached mode. The criterion to identify a burst was a firing rate of 4–6 spikes in 1 s, followed by a variable period of silence (Akopian et al., 2016).
Basic membrane properties of SNr and GPe neurons were determined in whole-cell voltage-clamp mode with a depolarizing step voltage command (5 mV) and using the membrane test function integrated in the pClamp software. Neurons were initially voltage-clamped at −70 mV, then the holding potential (Vhold) was stepped to 10 mV to record sIPSCs in gap-free mode (filtered at 1 kHz using Clampex 10.2 software). sIPSCs were analyzed off-line with the automated detection protocol within the Mini-Analysis program (Justin Lee, Synaptosoft, version 6.0) and subsequently checked manually for accuracy. Event analyses were performed blind to genotype. The threshold amplitude for the detection of an event (10 pA for sIPSCs) was set above the root mean square noise (<4 pA at Vhold = 10 mV). sIPSCs with peak amplitudes between 10 and 100 pA were grouped, aligned by half-rise time, and normalized by peak amplitude to calculate event kinetics. For each cell, grouped events were averaged to calculate mean amplitudes, rise times, and decay times.
Optogenetic stimulation of direct and indirect pathway striatal neurons.
We used optical stimulation to activate selectively MSNs to determine their relative contribution to GABA synaptic activity in SNr and GPe neurons. The excitatory opsin, channelrhodopsin-2 (ChR2), and its reporter gene enhanced yellow fluorescent protein (EYFP) were inserted in a double-floxed inverted open reading frame viral vector (AAV2-DIO-ChR2-EYFP) (Gene Transfer Vector Core, University of Iowa, Iowa City, IA). AAV2-DIO-ChR2-EYFP was stereotaxically injected into the striatum of 1-month-old WT and R6/2 mice, 1-month-old WT and YAC128 (presymptomatic) mice, or 11-month-old WT and YAC128 (symptomatic) mice crossed with D1-Cre and D2- or A2A-Cre mice (C57BL/6J background) (1 μl/site, 3.0 × 10⁹ vg/μl, 0.2 μl/min) using the following coordinates: 1.0 mm anterior and 2.0 mm lateral to bregma, at a depth of 3.1 mm from the dura. After Cre recombination, ChR2-EYFP was selectively expressed in D1-Cre, D2- or A2A-Cre neurons. The expression of these proteins was visualized by EYFP fluorescence. A slow ramp protocol (−70 to 10 mV, then holding at 10 mV) was used to examine evoked GABA responses in SNr or GPe neurons. A brief LED (CoolLED) pulse (470 nm) consistently stimulated the terminals of MSNs expressing ChR2-EYFP surrounding the patched SNr or GPe neurons. All experiments comparing SNr or GPe neuronal responses from WT, R6/2, and YAC128 mice used the same intensity and duration of the light stimulus (1 mW, 0.5 ms, 1/30 s frequency).
Immunohistochemistry.
After recordings, slices containing biocytin-filled neurons were fixed in PFA for 8 h before being placed in 30% sucrose in 1× PBS until processed for immunostaining. Slices were processed immunohistochemically for TH in the SN to help determine whether responses of DA and non-DA neurons were different. Similarly, in the GPe, slices were processed immunohistochemically for parvalbumin (PV) to determine whether responses of neurons that expressed this protein were different. The slices were washed 3× with 1× PBS, permeabilized with 1× PBS/0.7% Triton, then transferred to a blocking solution (1× PBS/0.5% Triton/5% normal goat serum; Sigma-Aldrich) for 4 h at room temperature. Slices were then incubated overnight at 4°C with either a chicken-anti-TH antibody (1:1500, catalog #TYH, Aves Labs, Oregon, RRID:AB_10013440) or rabbit-anti-PV antibody (1:1500, catalog # PV27, Swant, RRID:AB_2631173) in blocking solution for SNr or GPe neurons, respectively. Slices were washed 5× in 1× PBS followed by incubation in blocking solution containing either goat-anti-chicken-594 (1:1000, catalog #A-11042, Invitrogen, RRID:AB_142803) or goat-anti-rabbit-594 (1:1000, catalog #A-11037, Invitrogen, RRID:AB_2534095) and the fluorophore AlexaFluor streptavidin-Marina blue (1:1000, catalog #S11221, Invitrogen). The samples were mounted on glass slides and examined on an ApoTome confocal microscope (Carl Zeiss). Neurons were imaged at ×20 and ×40 magnification. Colocalization of streptavidin blue with either the TH or PV antibody was used to help characterize recorded cells.
Statistical analyses.
Unless otherwise noted, values reported are mean ± SE. Differences between group means were assessed with appropriate statistical tests for two groups (Student's t test). Amplitude-frequency and cumulative interevent interval (IEI) or amplitude distributions were compared with two-way repeated-measures ANOVAs with one repeated and one independent measure followed by Bonferroni post hoc t tests. Differences in proportions were assessed with χ2 or Fisher Exact tests depending on sample size. Differences were considered statistically significant when p < 0.05. All statistical analyses were performed with Microsoft Excel or Sigma Plot 12.0.
Results
Striatal viral injections and cell types recorded in SNr and GPe
The AAV2-DIO-ChR2-EYFP viral vector was injected in the dorsolateral striatum (Fig. 1A). Injections covered primarily the lateral extent of the striatum in the dorsoventral direction and extended for 3 or 4 slices or ∼1.2 mm in the anteroposterior direction. Three to 4 weeks after the injection, EYFP fluorescence was detected in the SNr of D1-Cre mice and in the GPe of D2/A2A-Cre mice (Fig. 1B,C). The distribution of direct and indirect pathway terminals was homogeneous and restricted to SNr or GPe.
Figure 1.
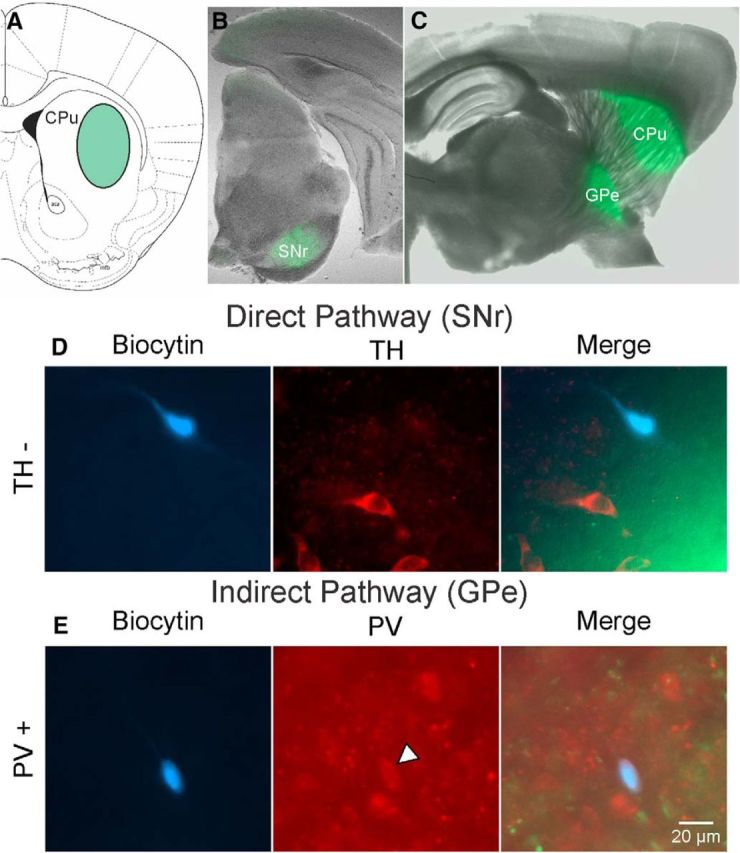
Striatal viral injection/expression and recorded cell types in SNr and GPe. A, Coronal section (bregma, anteroposterior 0.98 mm) (Franklin and Paxinos, 1997) showing the injection site of AAV2-DIO-ChR2-EYFP in the dorsolateral striatum (green oval). B, EYFP expression in SNr of a D1-Cre mouse. C, EYFP expression in striatum (injection site) and GPe (recording site) of D2-Cre mouse. D, Left, Biocytin-filled cell recorded in the SNr (blue cell). Middle, Immunofluorescence with TH antibody shows several stained cells. Right, Overlay shows the absence of TH fluorescence in the biocytin-filled cell, indicating that it was not DA-producing. Right, Green EYFP fluorescence indicates the site of termination of direct pathway axons. E, Left, Cell recorded in the GPe and filled with biocytin (blue cell). Middle, Immunostaining using anti-PV antibody demonstrates many neurons in GPe express PV, including the recorded neuron (arrowhead). Right, Overlay shows the biocytin-filled neuron expressing PV. Light green EYFP fluorescence from indirect pathway MSN terminals is also shown. Calibration applies to all panels in D, E.
Diverse classes of neurons coexist in the SNr, with GABAergic and DAergic cells being the most abundant. In rats, both cell types display a compartmental and complementary distribution within the SNr (González-Hernández and Rodríguez, 2000). To determine which type of neuron was primarily recorded, in a subset of neurons from WT and R6/2 animals, we used double immunostaining for the cell marker biocytin and for TH, which characteristically labels DAergic neurons (Fig. 1D). Based on IHC detection, the majority of recorded neurons double-labeled in the SNr were TH-negative (73%, 14 of 19), indicating that most of the neurons recorded were putative GABAergic cells and a smaller population were likely DAergic. We did not find significant differences in responses of neurons that did or did not express TH, and data were pooled. IHC detection of biocytin and PV indicated that slightly more than half of recorded double-labeled neurons in GPe (54%, 7 of 13) were PV-positive, the so-called prototypical cells (Fig. 1E). The rest were probably the archypallidal, striatal-projecting GPe neurons expressing Lim homeobox 6 (Lhx6), Neuronal PAS domain (Npas), or Forkhead box protein P2 (FoxP2) (Mastro et al., 2014; Abdi et al., 2015; Glajch et al., 2016). Overall, we did not find consistent differences in responses of GPe neurons which did or did not express PV, and data were pooled.
Passive membrane properties of SNr neurons are altered in R6/2 mice
First, we examined changes in passive membrane properties of SNr neurons from symptomatic R6/2 mice (>2 months of age) compared with WT littermates. SNr neurons in R6/2 mice showed a significant decrease in cell membrane capacitance (t(84) = 2.488, p = 0.015) and a significant increase in membrane input resistance (t(84) = −2.29, p = 0.025) but no change in decay time constant (Table 1). These findings probably indicate decreases in somatic size and of dendritic processes and spines, which led to a decrease in cell membrane area and channels, as has been observed in striatum and cortex of symptomatic R6/2 mice (Klapstein et al., 2001).
Table 1.
Passive membrane properties
| Capacitance (pF) | Input resistance (mΩ) | Tau (ms) | |
|---|---|---|---|
| SNr neurons in WT and R6/2 mice | |||
| WT (n = 41) | 79.05 ± 4.97 | 571.09 ± 52.20 | 1.49 ± 0.11 |
| R6/2 (n = 45) | 64.83 ± 3.16* | 800.29 ± 84.10* | 1.40 ± 0.09 |
| GPe neurons in WT and R6/2 mice | |||
| WT (n = 32) | 73.78 ± 6.07 | 865.09 ± 77.98 | 1.70 ± 0.15 |
| R6/2 (n = 33) | 65.30 ± 5.75 | 889.27 ± 87.48 | 1.32 ± 0.13 |
| SNr neurons in WT and YAC128 mice | |||
| WT (2 mo, n = 12) | 79.25 ± 10.20 | 645.42 ± 70.12 | 1.21 ± 0.13 |
| YAC128 (2 mo, n = 12) | 77.83 ± 8.00 | 723.50 ± 87.09 | 1.37 ± 0.17 |
| WT (12 mo, n = 17) | 75.76 ± 7.99 | 756.35 ± 93.65 | 1.41 ± 0.21 |
| YAC128 (12 mo, n = 25) | 66.28 ± 5.66 | 689.16 ± 64.89 | 1.34 ± 0.17 |
| GPe neurons in WT and YAC128 mice | |||
| WT (2 mo, n = 12) | 61.92 ± 8.36 | 1014.75 ± 144.99 | 0.95 ± 0.12 |
| YAC128 (2 mo, n = 6) | 62.17 ± 12.16 | 1140.00 ± 89.44 | 1.19 ± 0.22 |
| WT (12 mo, n = 27) | 73.44 ± 5.27 | 1022.41 ± 117.89 | 1.46 ± 0.15 |
| YAC128 (12 mo, n = 23) | 66.52 ± 4.32 | 1042.39 ± 98.27 | 1.19 ± 0.14 |
*p < 0.05 difference from WTs.
Firing properties of SNr neurons
Firing properties of SNr neurons were determined in cell-attached mode. Most cells fired spontaneously, but a few did not display any action potentials for the length of the recording (2–3 min). The proportion of silent neurons was slightly greater in WT (6 of 30, 20%) compared with R6/2 mice (5 of 33, 15.5%), but the difference was not statistically significant (p = 0.43, Fisher exact). The vast majority of cells displayed rhythmic firing (Fig. 2A) with low (<2 and <4 Hz), medium (<6 and <8 Hz), and high (>8 Hz) frequencies. Only rarely SNr cells fired in bursts (1 in WT and 2 in R6/2 mice). Rhythmic firing was not altered in SNr neurons from R6/2 mice, as demonstrated by similar coefficients of variation (0.32 ± 0.05 for WT and 0.31 ± 0.07 for R6/2, t(50) = 0.0691, p = 0.95). The average firing frequency was not significantly different in cells from WT compared with R6/2 mice (5.5 ± 1.0 Hz, n = 24 vs 3.7 ± 0.7 Hz, n = 28, respectively; t(50) = 1.475, p = 0.15) (Fig. 2B). However, a higher percentage of low-frequency firing neurons was seen in R6/2 compared with WT mice (Fig. 2C).
Figure 2.
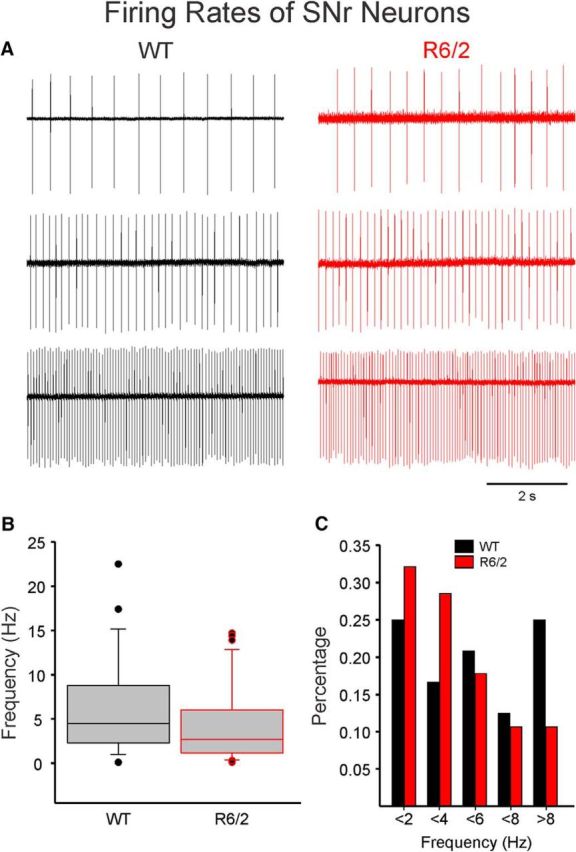
Firing rates of SNr neurons. A, SNr neurons were recorded in cell-attached mode. Most neurons displayed rhythmic firing at low, medium, and high frequencies. B, Box-and-whisker plots represent the median frequency (Hz) of SNr neurons from WT and R6/2 mice. The frequencies were not significantly different. C, Histogram of percentage of cells firing at different frequencies. In R6/2 mice, more cells with lower firing rates were encountered. However, the difference was not statistically significant.
The amplitude of synaptic responses evoked by optical stimulation of direct pathway MSN terminals is reduced in SNr neurons
Use of the Cre-recombinase system to express ChR2 in direct pathway MSNs (D1 receptor-expressing) allowed for selective photoactivation of their terminals in the SNr. As MSN projections are GABAergic, it is expected that stimulation of MSN terminals would induce inhibitory responses in SNr neurons (i.e., reduce spontaneous firing rates). As a proof of concept, we tested the effect of photoactivation of direct pathway on spontaneous firing in a subset of SNr neurons from a WT mouse (n = 2). In cell-attached mode, long-duration pulses of blue light (470 nm, 5 s, 1 mW) completely inhibited neuron firing of SNr cells (Fig. 3A). Firing resumed several seconds after the light pulse.
Figure 3.

Optogenetic activation of direct pathway terminals disrupts firing of SNr neurons. A, Top, SNr neuron firing rhythmically was recorded in cell-attached mode. Bottom, A 5 s blue light pulse (470 nm, 1 mW) completely inhibited firing. Firing resumed several seconds after the light pulse was discontinued. B, A ramp voltage command (from −70 to 10 mV, bottom) was used to increase the driving force of activation of GABAA receptors. To completely isolate GABA responses, the external solution also contained glutamate receptor antagonists (NBQX and AP-5). A blue light pulse (470 nm, 0.5 ms, 1 mW) evoked a large GABA response at 10 mV. C, The amplitude of the GABA response increased proportionally as light intensity increased (from 0.5 to 5 mW, 1/30 s frequency).
In whole-cell voltage-clamp mode, optogenetic activation of direct pathway MSN terminals reliably evoked responses mediated by activation of GABAA receptors in SNr neurons. To isolate these responses, the slice was bathed with a combination of AMPA and NMDA receptor antagonists (NBQX, 10 μm; AP-5, 50 μm, respectively), and the cell was slowly depolarized using a ramp voltage command from −70 to 10 mV (Fig. 3B). As the intensity of the light increased (from 0.5 to 4 mW), the amplitude of the response increased accordingly (Fig. 3C). As a verification that responses evoked by light were primarily due to activation of GABAA receptors, bicuculline, a GABAA receptor antagonist (10 μm), blocked ∼93% of the response (n = 5 cells) (Fig. 4A1).
Figure 4.
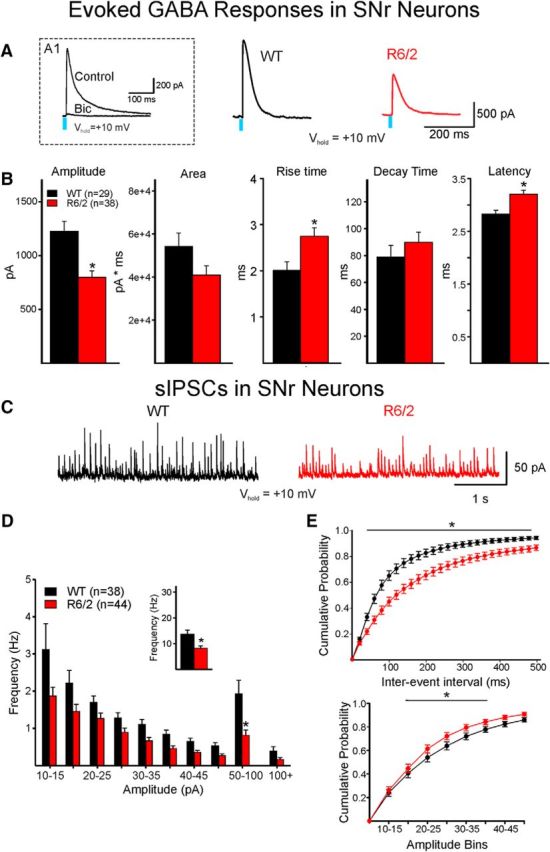
Optically evoked and spontaneous GABA synaptic currents in SNr neurons. A, GABA responses were evoked by optical stimulation of terminals of direct pathway neurons in WT and R6/2 mice. A1, Inset, The response was almost completely blocked by bicuculline (10 μm), demonstrating that it was specifically mediated by activation of GABAA receptors. Right, Traces show that the amplitude of the GABA response in an SNr neuron from an R6/2 mouse was decreased compared with the response of an SNr neuron from a WT mouse. B, Bar graphs represent significant differences in mean response amplitude (decreased), mean rise time (increased), and mean latency (increased) in SNr neurons from R6/2 compared with WT mice. Although mean response area was decreased, the difference did not reach statistical significance, possibly due to a small, nonsignificant mean increase in decay time. C, Sample traces of sIPSCs in cells from WT and R6/2 mice. Both frequency and amplitude were decreased in the R6/2 neuron. D, Amplitude-frequency histogram showing that the sIPSC frequency in SNr cells from R6/2 mice was significantly reduced across multiple amplitude bins. Inset, The average frequency of sIPSCs in R6/2 cells was significantly decreased. E, Cumulative IEI distributions of sIPSCs (top) show significantly higher percentage of short intervals (i.e., higher frequency) in WT compared with R6/2 neurons. In contrast, a higher percentage of low-amplitude sIPSCs (15–35 pA) occurred in R6/2 compared with WT neurons (bottom). *p < 0.05.
For genotype comparisons, we chose a single light intensity (∼60% of maximum, 1 mW, 1/30 s). At this intensity, there was a significant decrease in the amplitude of GABAA receptor-mediated responses in SNr neurons from R6/2 mice compared with WTs (n = 29 WT and n = 38 R6/2, t(65) = 3.747, p = 0.0004) (Fig. 4A,B). The area under the curve also was reduced, but the difference did not reach statistical significance (t(65) = 1.867, p = 0.066). Interestingly, these effects were more pronounced in the low-frequency firing units (putative DA neurons). Decay times were similar. However, the latency of the response and its rise time (10%–90%) were significantly increased in cells from R6/2 mice (t(63) = −3.516, p = 0.0004 and t(61) = −2.771, p = 0.007, respectively) (Fig. 4B). The increase in latency coupled with the increase in rise times suggest perturbations in GABA release from direct pathway MSN terminals in R6/2 mice.
The frequency and amplitude of sIPSCs in SNr neurons are reduced in HD mice
We also examined sIPSCs in SNr neurons (Vh = 10 mV) in the presence of glutamate receptor blockers where all spontaneous synaptic currents are mediated by GABAA receptors, as these currents are completely blocked with GABAA receptor antagonists, such as bicuculline or picrotoxin (data not shown). The average frequency of sIPSCs was significantly decreased in SNr neurons from R6/2 mice compared with WTs (t(80) = 2.042, p = 0.04) (Fig. 4C,D, inset). Although there was a trend for a significant genotype and amplitude-frequency interaction, the difference did not reach statistical significance (F(9,720) = 1.407, p = 0.181). However, Bonferroni post hoc tests demonstrated a significant decrease in frequency occurred at the 50–100 pA bin (t = 3.839, p < 0.001) (Fig. 4D). SNr neurons from WT mice showed a significant increase in the proportion of short-duration IEIs compared with those of R6/2 mice, which supports reduced GABA release probability in the R6/2 (F(24,1944) = 9.020, p < 0.001) (Fig. 4E). We also examined the amplitude and kinetics of spontaneous synaptic currents in SNr neurons from WT and R6/2 mice. There was a significant reduction in average amplitude of events in neurons from R6/2 compared with WTs (19.8 ± 0.9 vs 23.4 ± 1.2 pA, respectively; t(80) = 2.479, p = 0.02), which supports the optogenetic results. The cumulative amplitude distributions also demonstrated significant differences in the 15–35 pA amplitude bins (F(9,720) = 4.953, p < 0.001) (for individual Bonferroni post hoc test values, see Fig. 4E). There was also an increase in rise time (2.2 ± 0.1 vs 2.6 ± 0.2 ms for WT and R6/2, respectively; t(79) = −2.088, p = 0.04) consistent with increased rise time of evoked responses. In contrast, decay time and half-amplitude duration were not significantly different (data not shown).
The frequency and amplitude of mIPSCs in SNr cells are similar in R6/2 and WT mice
mIPSCs were examined by applying TTX, in the presence of NBQX and AP-5, to slices from symptomatic R6/2 and WT mice. TTX reduced the frequency of sIPSCs in both WT and R6/2 mice (38 ± 13% in WT, n = 9; and 54 ± 8% in R6/2, n = 10). There was still a slight reduction in frequency in R6/2 versus WT SNr neurons, but the difference was no longer significant (8.52 ± 2.76 vs 6.54 ± 1.65 Hz WT and R6/2, respectively; t(17) = 0.669, p = 0.52). The rightward shift in the IEI distribution, indicating reduced frequency, did not occur after application of TTX, suggesting that reduced sIPSC frequencies are action potential-dependent and not due to spontaneous (quantal) GABA release. Although a small percentage of sIPSCs in SNr neurons may depend on striatal activity, a major contribution to synaptic inputs is from intrinsic GABAergic cells in SNr and SNc (Deniau et al., 2007). This is consistent with the fact that the firing frequency of SNr neurons was slightly reduced in R6/2 mice compared with WTs. However, GABA release from other sources, including MSNs and GPe neurons, cannot be ruled out. GPe neurons project to the SNr and can exert inhibitory control (Smith and Bolam, 1989). In a previous study of GPe neurons in R6/2 mice, we found that, although the overall spontaneous firing frequency of these neurons was not different compared with littermate controls, the number of action potentials evoked by depolarizing current pulses was reduced (Akopian et al., 2016).
Passive membrane properties of GPe neurons in R6/2 mice
Different types of neurons can be found in the GPe (Kita and Kitai, 1991). The most common, Type A, is GABAergic, expresses PV, projects to the subthalamic nucleus, and displays delayed rectification caused by a prominent hyperpolarization-activated current (Ih). One-third of neurons (Type B) have no Ih and display a fast monophasic action potential afterhyperpolarization. A smaller percentage of neurons, Type C, are probably cholinergic, have no Ih, and display prolonged biphasic afterhyperpolarizations (Cooper and Stanford, 2000). In a previous study, we characterized the basic passive and active membrane properties of both Type A and Type B neurons in the GPe of R6/2 mice (Akopian et al., 2016). In the present study, consistent with our previous results, passive cell membrane properties of GPe neurons from symptomatic R6/2 mice showed no significant differences in membrane capacitance, input resistance, or decay time constant (Table 1) compared with those of WT mice when all cell types were combined. As our recordings were in voltage-clamp mode, using Cs-methanesulfonate as the internal solution, no attempt was made to separate cell types based on typical electrophysiological properties observed in current-clamp mode and using K-gluconate as the internal solution.
Synaptic inputs from indirect pathway MSNs are increased in duration in GPe neurons
AAV-ChR2-EYFP was injected into D2-Cre mice. EYFP expression projected from the striatum to the GPe (Fig. 1C). Optically evoked GABA responses in GPe neurons were similar in amplitude (Fig. 5A,B). However, a significant increase in decay time and area occurred in cells from R6/2 mice compared with those of WTs (t(42) = −2.399, p = 0.02 and t(42) = −2.745, p = 0.01, respectively) (Fig. 5A,B). R6/2 cells with longer decay times generally did not express PV (PV-positive cells had an average decay time of 27 ± 10 ms, n = 4; and PV-negative cells had an average decay time of 96 ± 19 ms, n = 5; t(7) = −2.994, p = 0.02) and fired at slower rates than cells with decay times comparable with those of WTs. This suggests that cells with long decay times represent a particular subset of GPe neurons (i.e., PV-negative).
Figure 5.
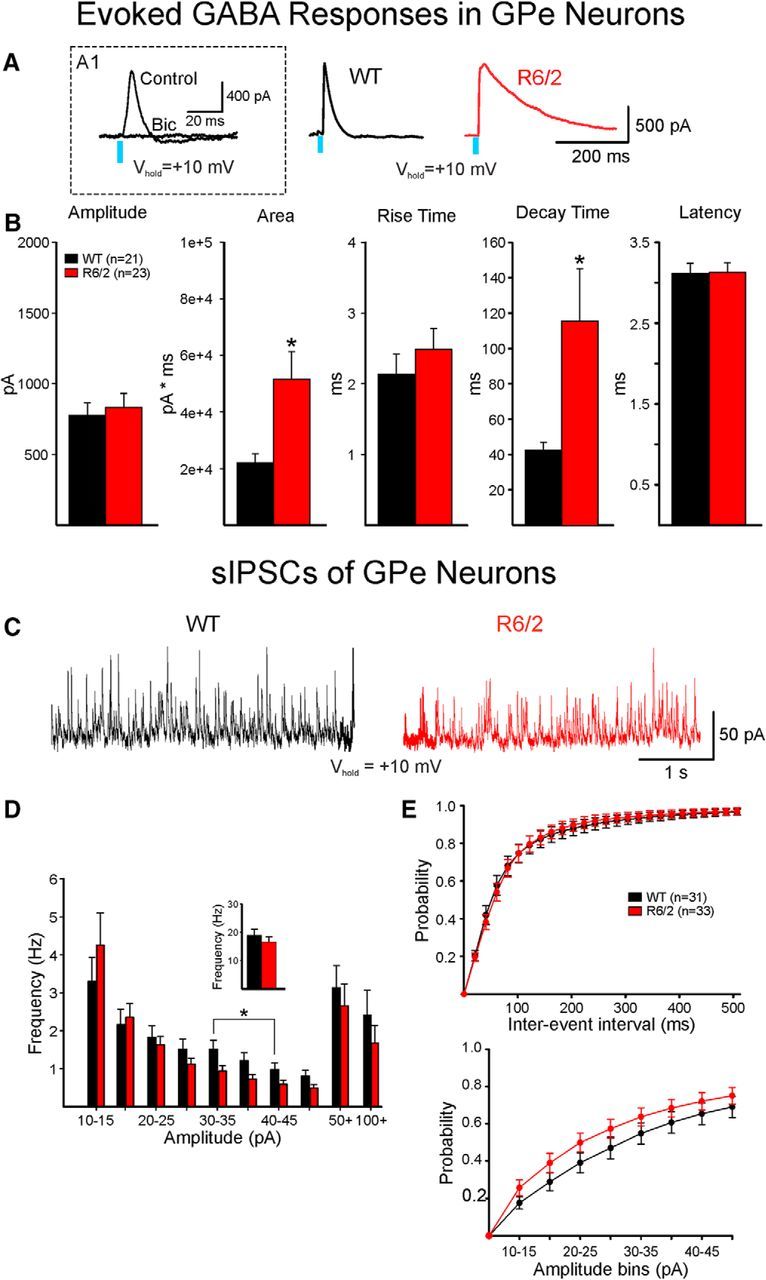
Optically evoked and spontaneous GABA synaptic currents in GPe neurons. A, GABA responses were evoked by optical stimulation of terminals of indirect pathway neurons in WT and R6/2 mice. A1, Inset, The response was completely blocked by bicuculline (10 μm), demonstrating that it was specifically mediated by activation of GABAA receptors. Right, Traces show that the duration of the GABA response in a GPe neuron from an R6/2 mouse was markedly increased compared with the response of a GPe neuron from a WT mouse. B, Bar graphs show that the mean areas and decay times of the responses were significantly increased in GPe neurons from R6/2 mice. Mean amplitudes, rise times, and latencies were unchanged. C, Samples of sIPSC traces recorded in WT and R6/2 mice. D, Although the amplitude-frequency histogram (left) showed significant reduction in frequency in the 30–45 pA amplitude bins, this reduction was offset by an increased frequency of small-amplitude synaptic events. Inset, No difference in mean IPSC frequency between R6/2 and WT GPe neurons. E, The cumulative IEI and amplitude distributions were similar. *p < 0.05.
Because D2 receptors also are expressed by striatal interneurons that could affect the findings, we used the A2A-Cre line, which only expresses Cre in indirect pathway MSNs to further validate outcomes. Similar findings occurred as the amplitude of evoked GABA responses was not significantly different (973 ± 134 vs 1215 ± 77 pA for WT, n = 10; and R6/2, n = 12; respectively; t(20) = −1.625, p = 0.12), although there was a significant increase in decay time (60 ± 10 vs 127 ± 27 ms for WT and R6/2, respectively; t(20) = −2.151, p = 0.044) and area (39,912 ± 10,252 vs 77,387 ± 13,841 pA × ms for WT and R6/2, respectively; t(20) = −2.10, p = 0.048).
Spontaneous synaptic activity in GPe neurons
There was no change in overall frequency of sIPSCs of GPe neurons in R6/2 compared with those of WTs (Fig. 5C,D, inset). The amplitude-frequency histogram showed no significant differences (Fig. 5D). Similarly, no significant differences in cumulative distributions of IEIs (Fig. 5E, top) or amplitudes (Fig. 5E, bottom) in GPe neurons from R6/2 mice were observed. Although the kinetics of the sIPSCs showed no significant differences, there was a nonsignificant increase in decay time in neurons from R6/2 mice compared with those of WTs (18.63 ± 2.1 vs 25.5 ± 3.5 ms for WT and R6/2, respectively; t(50) = −1.623, p = 0.11), which is consistent with the longer decay of optically evoked responses. Further analysis of average sIPSC amplitude distributions of GPe neurons from both R6/2 and WT mice demonstrated that these neurons displayed two different patterns of activity. One population of cells (Type 1) displayed amplitude-frequency histograms with one peak (unimodal) and had relatively small average amplitudes of events (Fig. 6A), whereas the second population (Type 2) exhibited two peaks (bimodal): one peak associated with relatively small average amplitudes and the second peak associated with larger average amplitude of events (Fig. 6C). In addition, events in Type 1 cells appeared random, whereas events in Type 2 cells appeared more rhythmic or semirhythmic. In both WT and R6/2 mice, the percentage of Type 2 cells was lower than Type 1 cells. Type 2 cells in WT mice made up 27.6% (8 of 29), and in R6/2 mice the percentage of Type 2 cells was 34.6% (9 of 26). In R6/2 mice, sIPSC frequency of Type 1 cells was significantly higher compared with those of WTs (Fig. 6B). In contrast, the average frequency of Type 2 cells was significantly lower for R6/2 compared with those of WTs (Fig. 6D). There were no significant differences in average sIPSC amplitudes when Type 1 and Type 2 cells in R6/2 mice were compared with Type 1 and Type 2 neurons of WTs, respectively.
Figure 6.

GPe neurons displayed two patterns of sIPSCs. A, Type 1 cells displayed unimodal amplitude-frequency histograms with low-amplitude, randomly occurring synaptic events. B, Cumulative IEI distributions of Type 1 cells from R6/2 mice have significantly more short-interval events (higher frequency) compared with those of WT cells. Inset, Mean frequencies of sIPSCs in R6/2 Type 1 neurons were significantly greater than those of Type 1 WT cells. C, Type 2 cells displayed bimodal amplitude-frequency histograms with small and semirhythmic large-amplitude events. D, Cumulative IEI distributions show that cells from WT mice have significantly more short-interval events compared with R6/2 cells. Inset, Mean sIPSC frequency of Type 2 cells was significantly decreased in R6/2 compared with WT cells. Thus, the two types of sIPSCs in GPe neurons changed in opposite directions in R6/2 mice. *p < 0.05.
The frequency and amplitude of mIPSCs in GPe neurons are similar in R6/2 and WT mice
mIPSCs were examined by applying TTX in the presence of NBQX and AP-5 to slices from R6/2 mice. TTX reduced the frequency of IPSCs equivalently in both WT and R6/2 mice (−54.44 ± 6.78% WT, n = 13 vs −48.36 ± 7.88% R6/2, n = 11). There also were no changes in cumulative mIPSC IEIs, amplitudes, or event kinetics when genotypes were compared.
Similar and contrasting alterations occur in YAC128 mice
Whereas basic membrane properties of SNr neurons were altered in R6/2 mice, in the YAC128 mice at both stages, there were no significant changes in cell membrane capacitance, input resistance, or decay time constant (Table 1), suggesting a milder phenotype in this mouse model. In YAC128 symptomatic mice, most SNr neurons fired spontaneously (WT, n = 14; YAC128, n = 21). Only 3 cells in each group were silent. Similar to R6/2 mice, there was a nonsignificant reduction in mean firing rates of SNr neurons from YAC128 mice (6.9 ± 1.4 vs 4.1 ± 0.9 Hz in WT and YAC128, respectively; t(33) = 1.885, p = 0.07). The coefficient of variation also was not significantly altered in YAC128 mice (0.27 ± 0.07 vs 0.39 in WT and YAC128, respectively; t(33) = −1.050, p = 0.28). Together, these findings indicate that although some similarities between R6/2 and YAC128 mice were observed, other changes only occurred in R6/2 mice. Such an outcome could be due to the more aggressive phenotype in the R6/2 mice.
Synaptic alterations in SNr and GPe neurons were consistent in both models. Responses of SNr neurons from YAC128 mice (12 months) showed a significant decrease in amplitude (t(23) = 2.154, p = 0.04) and a decrease in area, but no change in decay time (Fig. 7A,B). In addition, the rise time of the response was significantly increased in cells from YAC128 mice (t(23) = −2.597, p = 0.016) (Fig. 7B). In contrast, the presymptomatic YAC128 group (2 months) showed no significant changes in any of these measures compared with WT littermates [amplitude: 1167 ± 221 vs 1037 ± 150 pA; area: 49,745 ± 10,295 vs 48,498 ± 7580 pA × ms; decay time: 82 ± 12.4 vs 100.2 ± 7.2 ms in WT (n = 10) vs YAC128 (n = 11), respectively]. Similarly, and consistent with data from R6/2 mice, the average frequency of sIPSCs was significantly decreased in SNr neurons from YAC128 mice compared with WTs (t(40) = 2.970, p = 0.005) (Fig. 7C,D, inset). The amplitude-frequency distributions showed that decreased frequencies occurred at the 10–30 pA bins (F(9,360) = 6.808, p < 0.001) (Fig. 7D). In contrast, mean amplitudes were not significantly different (21.6 ± 1.6 pA for WTs, n = 17 and 23.3 ± 1.7 pA for YAC128, n = 25). Also similar to data from R6/2 mice, SNr neurons from WT mice showed a significant increase in the proportion of short-duration IEIs compared with those from YAC128 mice (F(24,960) = 3.782, p < 0.001) (Fig. 7E). In contrast, the cumulative amplitude distributions were not significantly different (Fig. 7E).
Figure 7.
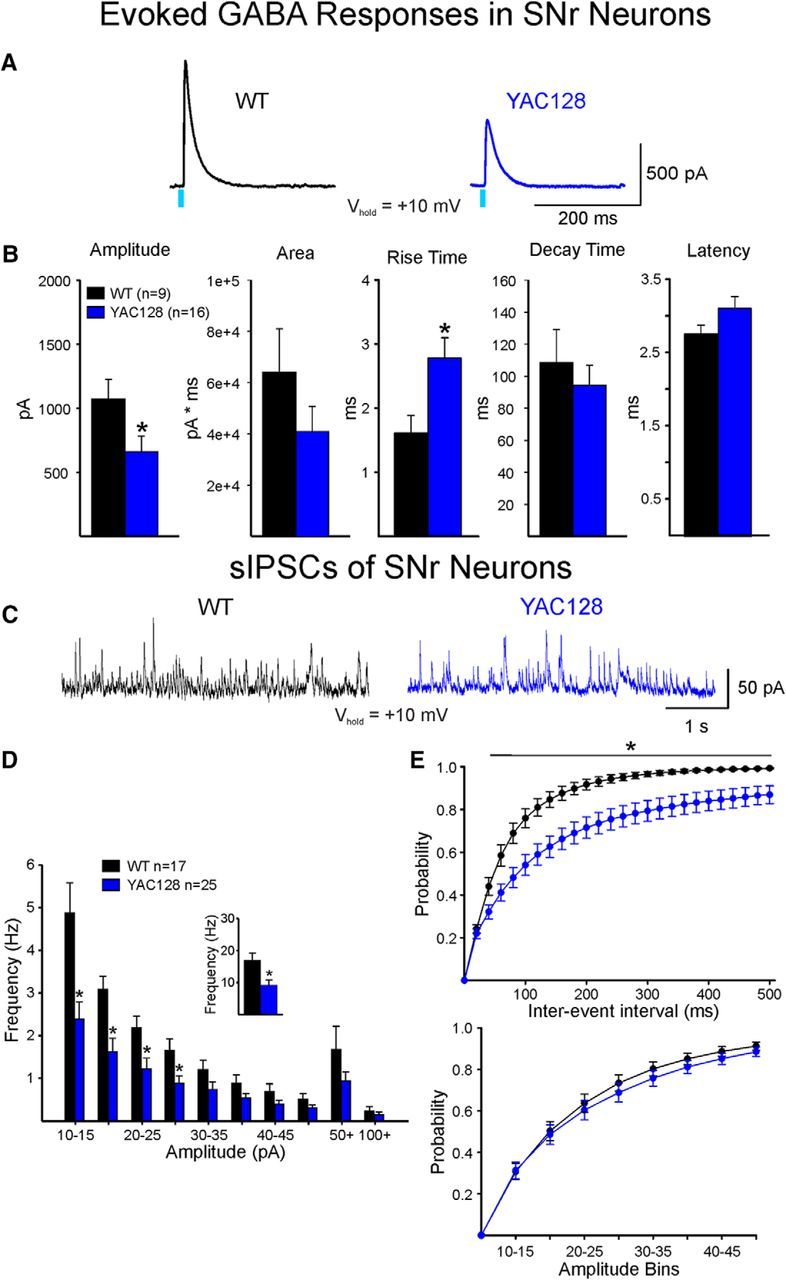
Optically evoked and spontaneous GABA synaptic currents in SNr neurons from WT and symptomatic YAC128 mice. A, GABA responses were evoked by optical stimulation of terminals of direct pathway neurons in WT and symptomatic YAC128 mice. Right, Traces show that the amplitude of the GABA response in a SNr neuron from a YAC128 mouse was decreased compared with the response of a SNr neuron from a WT mouse, similar to results obtained in R6/2 mice. B, Bar graphs represent significant differences in mean response amplitude (decreased) and mean rise time (increased) in SNr neurons from YAC128 compared with WT mice. Mean latency was increased, but the difference was not significant. Although mean response area was decreased, the difference did not reach statistical significance. C, Sample traces of sIPSCs in cells from WT and YAC128 mice. Frequency was decreased in the YAC128 neuron. D, Amplitude-frequency histogram showing that the sIPSC frequency in SNr cells from YAC128 mice was significantly reduced across multiple amplitude bins (Bonferroni post hoc tests yielded p values of <0.001, <0.001, 0.011, and 0.04 for 10–15, 15–20, 20–25, and 25–30 pA, respectively). Inset, Mean frequency of sIPSCs in YAC128 cells was significantly decreased. E, Cumulative IEI distributions of sIPSCs (top histograms) show significantly higher percentage of short intervals (i.e., higher frequency) in WT compared with YAC128 neurons. Cumulative amplitude histograms were similar in WT and YAC128 SNr neurons (bottom histograms). *p < 0.05.
Consistent with no changes in passive membrane properties of GPe neurons in R6/2 mice, cells from GPe in YAC128 mice showed no significant changes at either stage (Table 1). Responses of GPe neurons to optical stimulation of indirect pathway MSN terminals in YAC128 (12 months) showed a significant increase in decay time as well as area (t(32) = −2.323, p = 0.03 and t(32) = −2.588, p = 0.014, respectively) (Fig. 8A,B). In contrast, presymptomatic YAC128 mice (2 months) showed no change in amplitude, area, or decay time [amplitude: 852.9 ± 202.1 vs 801.1 ± 181.5 pA; area 32,365 ± 8828 vs 26,334 ± 9571 pA × ms; decay time 41.2 ± 6.4 vs 54.3 ± 14.9 ms in WT (n = 11) vs YAC128 (n = 6), respectively]. Similarly, there was no change in overall frequency of sIPSCs in YAC128 12 months (Fig. 8C,D) or YAC128 2 months group compared with the corresponding WT groups or in the cumulative distributions of IEIs (Fig. 8E, top) or amplitudes (Fig. 8E, bottom). However, in 12 month YAC128, the Bonferroni post hoc test showed an increase in frequency of 10–15 pA amplitude events (t = 2.262, p = 0.024) (Fig. 8D).
Figure 8.
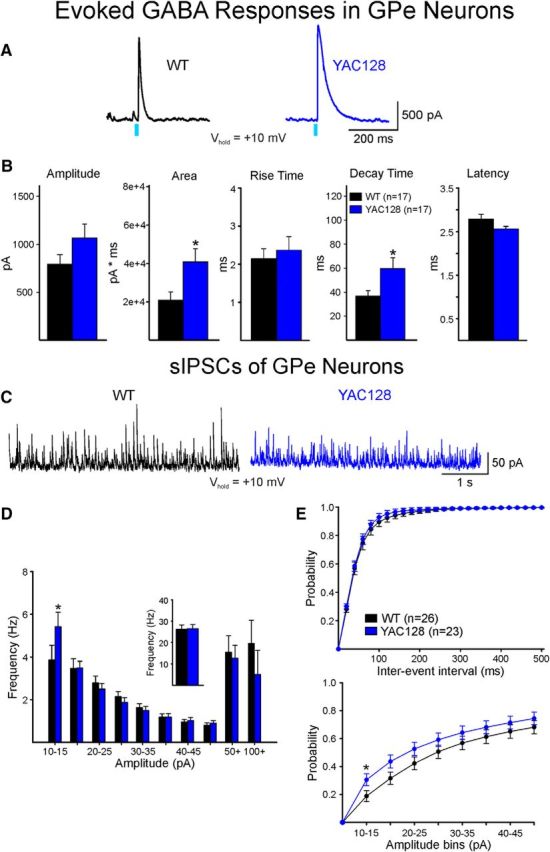
Optically evoked and spontaneous GABA synaptic currents in GPe neurons from WT and symptomatic YAC128 mice. A, GABA responses were evoked by optical stimulation of terminals of indirect pathway neurons in WT and YAC128 mice. Right, Traces show that the duration of the GABA response in a GPe neuron from a YAC128 mouse was increased compared with the response of a GPe neuron from a WT mouse. B, Bar graphs show that area and decay time were significantly increased in GPe cells from symptomatic YAC128 mice. There also was a significant decrease in latency. C, Sample traces of sIPSCs in GPe neurons from WT and YAC128 mice. D, The amplitude-frequency histogram shows that, although there is a significant increase in small-amplitude sIPSCs, this increase is offset by a reduction in large-amplitude events. In consequence, the mean frequencies were similar (inset). E, Top, Cumulative interevent histograms were similar. Bottom, there was only one amplitude bin (10–15 pA) that was significantly increased. *p < 0.05.
Intrastriatal communication between direct and indirect MSNs is altered in R6/2 mice
To explore whether synaptic communication between direct and indirect pathway MSNs within the striatum also occurs, in only R6/2 and WT littermates we recorded from indirect pathway MSNs (D2 neurons) in D1-Cre mice and vice versa (direct pathway MSNs recorded in D2- or A2A-Cre mice). These recordings showed that the evoked response of direct pathway MSNs on indirect pathway MSNs showed no significant differences in amplitude, area, or decay (Fig. 9A,B). In contrast, responses evoked by activation of indirect pathway MSNs (recording direct pathway MSNs) showed a significant increase in amplitude (t(15) = −2.885, p = 0.01) and a nonsignificant increase in area, but no change in decay time (Fig. 9C,D). This finding suggests increased decay time of responses evoked in GPe neurons may be partially caused by a postsynaptic mechanism. Interestingly, the latency of the response was significantly decreased in R6/2 mice (t(15) = 2.475, p = 0.026).
Figure 9.
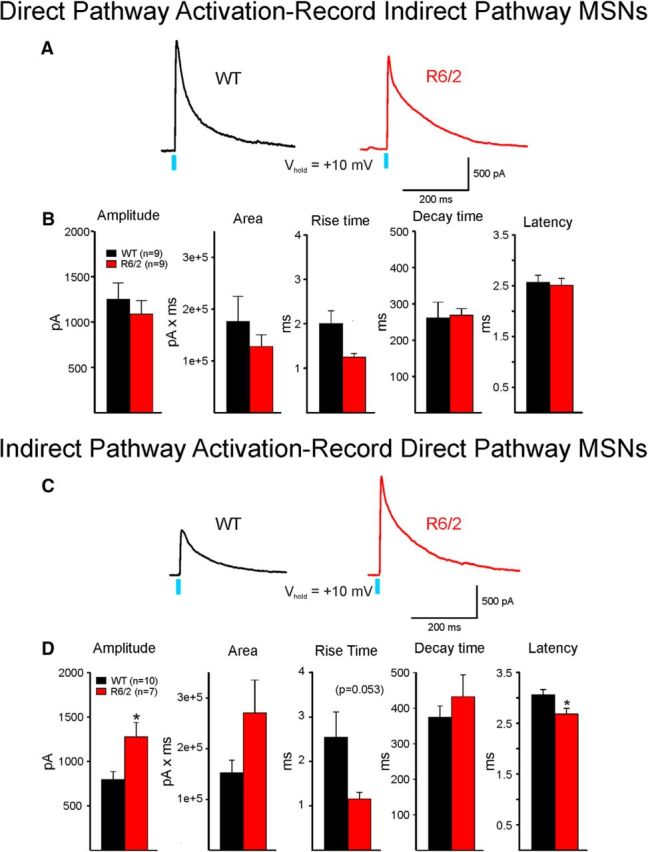
Intrastriatal communication between direct and indirect pathway MSNs. A, GABA responses evoked by optical stimulation of intrastriatal direct pathway terminals were recorded in nonfluorescent, putative indirect pathway MSNs from WT and R6/2 mice. B, Bar graphs represent that no significant differences in mean amplitude, area, rise times, decay times, or latency occurred. C, GABA responses evoked by optical activation of intrastriatal indirect pathway terminals were recorded in nonfluorescent, putative direct pathway MSNs from WT and R6/2 mice. D, Bar graphs represent that the amplitude of the response was significantly increased in direct pathway MSNs from R6/2 mice. The area also was increased, but the difference did not reach statistical significance (p = 0.07). The increase in rise time was almost statistically significant, whereas the latency was significantly reduced. The decay times were similar. *p < 0.05.
Discussion
The present results demonstrate, for the first time, that striatal synaptic communication with direct and indirect pathway output structures is significantly altered in symptomatic HD mice, albeit in different ways. Optical stimulation of direct pathway terminals produced lower-amplitude GABAA receptor-mediated responses in SNr neurons from symptomatic R6/2 and YAC128 mice. In contrast, optical stimulation of indirect pathway terminals induced longer-duration GABAA receptor-mediated responses in GPe neurons. In addition, the average frequency of sIPSCs was significantly reduced in SNr neurons, whereas no changes were found in GPe neurons. Interestingly, responses induced by activation of indirect pathway MSNs displayed larger amplitudes in direct pathway MSNs from R6/2 compared with WT mice, whereas responses induced by activation of direct pathway MSNs were similar in indirect pathway MSNs in R6/2 and WT mice.
Intrinsic membrane properties of SNr and GPe neurons
In R6/2 mice, cell membrane capacitance of SNr neurons was reduced and membrane input resistance was increased. These changes are similar to previous results in striatum and cerebral cortex (Klapstein et al., 2001; Laforet et al., 2001; Cummings et al., 2006). Altered membrane properties in SNr neurons could be associated with morphological changes, such as reduced somatic area or dendritic segment loss. In YAC128 mice, however, such changes in the SNr did not occur, suggesting that the phenotype could be milder. GPe neurons showed no differences in cell membrane properties in any group, confirming our previous findings (Akopian et al., 2016). However, no attempt was made to separate the diverse types of neurons within the GPe.
GABA responses in direct and indirect pathway output structures
The significant decrease in the amplitude of GABA responses in SNr neurons from symptomatic R6/2 and YAC128 mice could be due to a reduction in GABA release from presynaptic terminals or a reduction of postsynaptic SNr GABAA receptors. GABA release also may be delayed in the SNr as mean latencies were consistently greater. In addition, the frequency of sIPSCs of SNr neurons was significantly reduced, and this reduction appeared to be activity-dependent, at least in the R6/2 model, as the frequency of mIPSCs was not significantly altered. Also, similar to optically evoked IPSCs, the mean amplitude of sIPSCs was reduced. If we assume that changes in frequency are dependent on presynaptic mechanisms and changes in amplitude are more dependent on postsynaptic mechanisms, the most parsimonious explanation of the reduction in GABAergic responses in SNr neurons is that there are contributions from a combination of presynaptic and postsynaptic mechanisms (reduced GABA inputs, reduced release probability, and/or reduced density of GABAA receptors in the postsynaptic membrane). Although the source of reduced synaptic activity is not possible to determine when recording spontaneous synaptic events, there are several possibilities. One possibility is that the decrease is caused by reduced GABA release. However, in our recording conditions, MSNs are not present. Another potential source is from within the SNr, via intrinsic axon collaterals releasing GABA (Mailly et al., 2003; Cebrián et al., 2005). Our cell-attached recordings indicated considerable pacemaker activity, and a slight reduction in firing rates of SNr neurons partially supports such a conclusion. A third source emanates from the GPe, which sends a dense projection to SNr cells and exerts a strong inhibitory control (Smith and Bolam, 1989).
The major change in indirect pathway GPe neurons in both symptomatic R6/2 and YAC128 mice was a significant increase in decay time and area of the evoked GABAergic response. The increased decay time could be due to reduced reuptake of GABA at the synapse as a result of altered GABA transporters or could be due to changes in GABAA receptor subunits expressed in the postsynaptic GPe neurons. In general, GPe neurons with long decay times did not express PV and fired at slower rates than PV-expressing neurons, raising the possibility that such cells could be the recently characterized archypallidal neurons, which express Lhx6, Npas, or FoxP2 (Mastro et al., 2014; Abdi et al., 2015; Glajch et al., 2016) and preferentially send projections to the striatum and the SN pars compacta.
Evidence for potential changes in GABA transport in GPe of HD models is still lacking. A study in normal rodents found that GAT-1 is mainly localized in unmyelinated axons, whereas GAT-3 is almost exclusively found in glial processes in the GPe (Jin et al., 2011). As a deficit in astrocytic glutamate transporters (e.g., GLT-1) has been consistently observed in HD striatum (Behrens et al., 2002; Faideau et al., 2010), one may assume that GABA transporters could also be altered in the GPe of HD mice. However, there is considerable evidence for alterations in postsynaptic GABA receptors in mouse models as well as in human HD. Such changes appear to be regionally specific as GABAA receptor subunits in striatum are increased (Cepeda et al., 2004; Du et al., 2017), whereas in mouse models of HD, the density of GABAA receptor subunits in the GPe is significantly decreased (Du et al., 2016). A reduction in GABAA receptor α1 subunits in GPe could explain the slower kinetics of optically evoked responses as well as increased decay time of mIPSCs in R6/2 mice, at least during the presymptomatic stage (Du et al., 2016). In contrast to changes observed in mouse models, studies in human HD tissue have reported that there is a major increase in GABAA and GABAB receptors (along with increased expression of GABAA α, β, γ subunits) in both direct and indirect pathway output regions, findings that were interpreted as compensation triggered by the loss of striatal GABA input (Thompson-Vest et al., 2003; Allen et al., 2009; Waldvogel and Faull, 2015; Waldvogel et al., 2015). One possibility for the difference between human and mouse findings is that subunit expression examined in postmortem human tissue is contaminated by years of medication (Du et al., 2016). Another possibility is the degree of degeneration as in very symptomatic patients there is extensive degeneration of striatal output neurons, whereas in the mouse models the degeneration is markedly reduced.
Direct and indirect pathway communication in striatum
Although the striatum has been studied extensively in HD, little has been done to examine whether internal direct and indirect pathway communication is altered. The present results show that whereas direct pathway communication with the indirect pathway appears unchanged in R6/2 mice, indirect pathway communication with the direct pathway displays evidence of an increase. In a previous study, using dual-patch recordings, we found that the percentage of connected MSN pairs was reduced in R6/2 mice, whereas the success rate between indirect pathway and direct pathway cells was increased (Cepeda et al., 2013), providing supporting evidence for the present findings. The difference between GABAergic responses evoked by activation of the same pathways in the striatum and in the output target nuclei emphasizes the specificity and complexities of the presynaptic and postsynaptic changes induced in the HD mouse models.
Limitations
The present results have typical limitations inherent to the use of mouse models as well as the viral tools and optogenetics. With currently available models, it is difficult to assess translational aspects, particularly in terms of potential therapies (Beaumont et al., 2016). Most mouse models do not replicate chorea, the hallmark of manifest HD (Levine et al., 2004). Instead, they display motor deficits and bradykinesia. One also may argue that there was differential viral expression of the optogenetic constructs in the genetic models and their WT littermates, which led to the present outcomes. This is unlikely because results differed for direct and indirect pathways and were generally similar in two markedly differing models. In addition, our previous studies using viral injection of opsin constructs do not support differential expression or transport between genotypes (Cepeda et al., 2013; Parievsky et al., 2017). Finally, we need to emphasize that currently it is very difficult to determine which changes occur as a consequence of circuit alterations versus cell autonomous changes. Most likely both mechanisms are involved (Veldman and Yang, 2018).
Conclusions and implications
Reduced inhibition onto neurons in the SNr, possibly including a subpopulation of DA neurons, indicates that these cells may become hyperactive during HD progression. Importantly, neuropathologic studies in human HD determined that, during the early stages discrete islands of neuronal loss and astrocytosis appear in the striosomes almost exclusively, whereas in the late stages, cell loss increasingly occurs in the matrix compartment (Hedreen and Folstein, 1995). As MSNs from the striosomes project to the DA cells in the SNc and presumably also to the subset of DA neurons in the SNr, it is possible to speculate that early degeneration of these inhibitory neurons produces hyperactivity of the DA pathway, contributing to chorea and other early clinical manifestations of HD (Cepeda et al., 2014). However, evidence from human and animal models supports biphasic changes in DA release, high DA in early stages, and low DA in late stages (Cepeda et al., 2014). A recent study, however, shed some light on this seemingly paradoxical finding (Dallérac et al., 2015). This study reported an early and sustained downregulation of SK3 channels, which regulate the slow hyperpolarization, in DA neurons leading to hyperexcitability and increased DA release. Remarkably, downregulation of SK3 channels persisted even in the presence of a significant reduction of DA release in the late stages of the disease, arguing that hyperexcitability of DA neurons and the release of DA can be dissociated in HD, due to the fact that mutant Htt can directly affect release mechanisms.
The role of the indirect pathway in HD progression is more complex. While the commonly accepted assumption is that loss of indirect pathway MSNs is an early event in HD and could explain manifest motor symptoms, including chorea (Reiner et al., 1988; Albin et al., 1992; Sapp et al., 1995), the mechanism whereby loss of indirect pathway MSNs leads to GPe disinhibition remains unknown. At least in animal models, increased firing rates of GPe neurons do not occur (Akopian et al., 2016; Beaumont et al., 2016). Instead, reduced pacemaking ability, increased coefficients of variation, and a greater tendency to burst firing occur (Akopian et al., 2016). The present findings show that the decay phase of IPSCs evoked by activation of indirect pathway terminals is significantly increased in a population of GPe neurons. One speculation is that increased decay times contribute to disrupted pacemaking, increased coefficients of variation and prolonged pauses in firing (Akopian et al., 2016; Beaumont et al., 2016), as well as disrupted feedback to the striatum.
Based on the present results, we hypothesize that the normal balance between direct and indirect pathways is disrupted in HD mouse models. Under normal conditions, the balance in tilted toward the direct pathway (i.e., more charge, expressed as area under the curve, flows to the SNr), whereas in HD this balance is lost (Fig. 10). This imbalance could explain some phenotypic changes in HD mouse models. More electrical charge in SNr neurons could facilitate movement, whereas more charge in the GPe would produce bradykinesia, a typical symptom during late stages of the disease. If this is the case, we propose that pharmacological or optogenetic manipulation of direct or indirect pathway neurons would improve movement. Interestingly, selective activation or inhibition of specific subgroups of GPe neurons restores movement in a model of Parkinson's disease (Mastro et al., 2017). Similar manipulations could be proposed in HD mice to restore the direct and indirect pathway normal balance.
Figure 10.

Relative charge in SNr and GPe. The relative charge carried by chloride ions through GABAA receptors (expressed as area under the curve) after activation of direct and indirect pathway terminals in SNr and GPe neurons was compared in WT and HD mice. In WTs, the relative charge in SNr was >2 times greater than in GPe, which is more conducive to movement. In contrast, in HD mice, this relationship was disrupted so that the relative charges were more similar, which could decrease the potential for movement and lead to bradykinesia. *p < 0.05.
Footnotes
This work was supported by National Institutes of Health Grant NS41574 to M.S.L. and Grant NS93813 to J.B. We thank Dr. Sandra M. Holley for critical review of the manuscript; Jacob Bethel for help with the data analysis; and Donna Crandall for help with the illustrations.
The authors declare no competing financial interests.
References
- Abdi A, Mallet N, Mohamed FY, Sharott A, Dodson PD, Nakamura KC, Suri S, Avery SV, Larvin JT, Garas FN, Garas SN, Vinciati F, Morin S, Bezard E, Baufreton J, Magill PJ (2015) Prototypic and arkypallidal neurons in the dopamine-intact external globus pallidus. J Neurosci 35:6667–6688. 10.1523/JNEUROSCI.4662-14.2015 [DOI] [PMC free article] [PubMed] [Google Scholar]
- Akopian G, Barry J, Cepeda C, Levine MS (2016) Altered membrane properties and firing patterns of external globus pallidus neurons in the R6/2 mouse model of Huntington's disease. J Neurosci Res 94:1400–1410. 10.1002/jnr.23889 [DOI] [PMC free article] [PubMed] [Google Scholar]
- Albin RL, Reiner A, Anderson KD, Dure LS 4th, Handelin B, Balfour R, Whetsell WO Jr, Penney JB, Young AB (1992) Preferential loss of striato-external pallidal projection neurons in presymptomatic Huntington's disease. Ann Neurol 31:425–430. 10.1002/ana.410310412 [DOI] [PubMed] [Google Scholar]
- Allen KL, Waldvogel HJ, Glass M, Faull RL (2009) Cannabinoid (CB(1)), GABA(A) and GABA(B) receptor subunit changes in the globus pallidus in Huntington's disease. J Chem Neuroanat 37:266–281. 10.1016/j.jchemneu.2009.02.001 [DOI] [PubMed] [Google Scholar]
- Beaumont V, Zhong S, Lin H, Xu W, Bradaia A, Steidl E, Gleyzes M, Wadel K, Buisson B, Padovan-Neto FE, Chakroborty S, Ward KM, Harms JF, Beltran J, Kwan M, Ghavami A, Häggkvist J, Tóth M, Halldin C, Varrone A, et al. (2016) Phosphodiesterase 10A inhibition improves cortico-basal ganglia function in Huntington's disease models. Neuron 92:1220–1237. 10.1016/j.neuron.2016.10.064 [DOI] [PubMed] [Google Scholar]
- Behrens PF, Franz P, Woodman B, Lindenberg KS, Landwehrmeyer GB (2002) Impaired glutamate transport and glutamate-glutamine cycling: downstream effects of the Huntington mutation. Brain 125:1908–1922. 10.1093/brain/awf180 [DOI] [PubMed] [Google Scholar]
- Cebrián C, Parent A, Prensa L (2005) Patterns of axonal branching of neurons of the substantia nigra pars reticulata and pars lateralis in the rat. J Comp Neurol 492:349–369. 10.1002/cne.20741 [DOI] [PubMed] [Google Scholar]
- Cepeda C, Starling AJ, Wu N, Nguyen OK, Uzgil B, Soda T, André VM, Ariano MA, Levine MS (2004) Increased GABAergic function in mouse models of Huntington's disease: reversal by BDNF. J Neurosci Res 78:855–867. 10.1002/jnr.20344 [DOI] [PubMed] [Google Scholar]
- Cepeda C, Wu N, André VM, Cummings DM, Levine MS (2007) The corticostriatal pathway in Huntington's disease. Prog Neurobiol 81:253–271. 10.1016/j.pneurobio.2006.11.001 [DOI] [PMC free article] [PubMed] [Google Scholar]
- Cepeda C, Cummings DM, André VM, Holley SM, Levine MS (2010) Genetic mouse models of Huntington's disease: focus on electrophysiological mechanisms. ASN Neuro 2:e00033. 10.1042/AN20090058 [DOI] [PMC free article] [PubMed] [Google Scholar]
- Cepeda C, Galvan L, Holley SM, Rao SP, André VM, Botelho EP, Chen JY, Watson JB, Deisseroth K, Levine MS (2013) Multiple sources of striatal inhibition are differentially affected in Huntington's disease mouse models. J Neurosci 33:7393–7406. 10.1523/JNEUROSCI.2137-12.2013 [DOI] [PMC free article] [PubMed] [Google Scholar]
- Cepeda C, Murphy KP, Parent M, Levine MS (2014) The role of dopamine in Huntington's disease. Prog Brain Res 211:235–254. 10.1016/B978-0-444-63425-2.00010-6 [DOI] [PMC free article] [PubMed] [Google Scholar]
- Cooper AJ, Stanford IM (2000) Electrophysiological and morphological characteristics of three subtypes of rat globus pallidus neurone in vitro. J Physiol 527:291–304. 10.1111/j.1469-7793.2000.t01-1-00291.x [DOI] [PMC free article] [PubMed] [Google Scholar]
- Cummings DM, Milnerwood AJ, Dallérac GM, Waights V, Brown JY, Vatsavayai SC, Hirst MC, Murphy KP (2006) Aberrant cortical synaptic plasticity and dopaminergic dysfunction in a mouse model of Huntington's disease. Hum Mol Genet 15:2856–2868. 10.1093/hmg/ddl224 [DOI] [PubMed] [Google Scholar]
- Cummings DM, André VM, Uzgil BO, Gee SM, Fisher YE, Cepeda C, Levine MS (2009) Alterations in cortical excitation and inhibition in genetic mouse models of Huntington's disease. J Neurosci 29:10371–10386. 10.1523/JNEUROSCI.1592-09.2009 [DOI] [PMC free article] [PubMed] [Google Scholar]
- Dallérac GM, Levasseur G, Vatsavayai SC, Milnerwood AJ, Cummings DM, Kraev I, Huetz C, Evans KA, Walters SW, Rezaie P, Cho Y, Hirst MC, Murphy KP (2015) Dysfunctional dopaminergic neurones in mouse models of Huntington's disease: a role for SK3 channels. Neurodegener Dis 15:93–108. 10.1159/000375126 [DOI] [PubMed] [Google Scholar]
- Deniau JM, Mailly P, Maurice N, Charpier S (2007) The pars reticulata of the substantia nigra: a window to basal ganglia output. Prog Brain Res 160:151–172. 10.1016/S0079-6123(06)60009-5 [DOI] [PubMed] [Google Scholar]
- Du Z, Chazalon M, Bestaven E, Leste-Lasserre T, Baufreton J, Cazalets JR, Cho YH, Garret M (2016) Early GABAergic transmission defects in the external globus pallidus and rest/activity rhythm alteration in a mouse model of Huntington's disease. Neuroscience 329:363–379. 10.1016/j.neuroscience.2016.05.027 [DOI] [PubMed] [Google Scholar]
- Du Z, Tertrais M, Courtand G, Leste-Lasserre T, Cardoit L, Masmejean F, Halgand C, Cho YH, Garret M (2017) Differential alteration in expression of striatal GABAAR subunits in mouse models of Huntington's disease. Front Mol Neurosci 10:198. 10.3389/fnmol.2017.00198 [DOI] [PMC free article] [PubMed] [Google Scholar]
- Durieux PF, Bearzatto B, Guiducci S, Buch T, Waisman A, Zoli M, Schiffmann SN, de Kerchove d'Exaerde A (2009) D2R striatopallidal neurons inhibit both locomotor and drug reward processes. Nat Neurosci 12:393–395. 10.1038/nn.2286 [DOI] [PubMed] [Google Scholar]
- Faideau M, Kim J, Cormier K, Gilmore R, Welch M, Auregan G, Dufour N, Guillermier M, Brouillet E, Hantraye P, Déglon N, Ferrante RJ, Bonvento G (2010) In vivo expression of polyglutamine-expanded huntingtin by mouse striatal astrocytes impairs glutamate transport: a correlation with Huntington's disease subjects. Hum Mol Genet 19:3053–3067. 10.1093/hmg/ddq212 [DOI] [PMC free article] [PubMed] [Google Scholar]
- Franklin KBJ, Paxinos G (1997) The Mouse Brain in Stereotaxic Coordinates. San Diego, CA: Academic Press. [Google Scholar]
- Glajch KE, Kelver DA, Hegeman DJ, Cui Q, Xenias HS, Augustine EC, Hernández VM, Verma N, Huang TY, Luo M, Justice NJ, Chan CS (2016) Npas1+ pallidal neurons target striatal projection neurons. J Neurosci 36:5472–5488. 10.1523/JNEUROSCI.1720-15.2016 [DOI] [PMC free article] [PubMed] [Google Scholar]
- Gong S, Doughty M, Harbaugh CR, Cummins A, Hatten ME, Heintz N, Gerfen CR (2007) Targeting cre recombinase to specific neuron populations with bacterial artificial chromosome constructs. J Neurosci 27:9817–9823. 10.1523/JNEUROSCI.2707-07.2007 [DOI] [PMC free article] [PubMed] [Google Scholar]
- González-Hernández T, Rodríguez M (2000) Compartmental organization and chemical profile of dopaminergic and GABAergic neurons in the substantia nigra of the rat. J Comp Neurol 421:107–135. 10.1002/(SICI)1096-9861(20000522)421:1%3C107::AID-CNE7%3E3.0.CO;-F [DOI] [PubMed] [Google Scholar]
- Haddad MS, Cummings JL (1997) Huntington's disease. Psychiatr Clin North Am 20:791–807. 10.1016/S0193-953X(05)70345-2 [DOI] [PubMed] [Google Scholar]
- Harper PS, Jones L (2002) Huntington's disease: genetic and molecular studies. In Huntington's disease (Bates GP, Harper PS, Jones L, eds), pp 113–158. Oxford, UK: Oxford UP. [Google Scholar]
- Hedreen JC, Folstein SE (1995) Early loss of neostriatal striosome neurons in Huntington's disease. J Neuropathol Exp Neurol 54:105–120. 10.1097/00005072-199501000-00013 [DOI] [PubMed] [Google Scholar]
- Holley SM, Joshi PR, Parievsky A, Galvan L, Chen JY, Fisher YE, Huynh MN, Cepeda C, Levine MS (2015) Enhanced GABAergic inputs contribute to functional alterations of cholinergic interneurons in the R6/2 mouse model of Huntington's disease. eNeuro 2:e0008. 10.1523/ENEURO.0008-14.2015 [DOI] [PMC free article] [PubMed] [Google Scholar]
- Huntington's Disease Collaborative Research Group (1993) A novel gene containing a trinucleotide repeat that is expanded and unstable on Huntington's disease chromosomes. Cell 72:971–983. 10.1016/0092-8674(93)90585-E [DOI] [PubMed] [Google Scholar]
- Jin XT, Paré JF, Smith Y (2011) Differential localization and function of GABA transporters, GAT-1 and GAT-3, in the rat globus pallidus. Eur J Neurosci 33:1504–1518. 10.1111/j.1460-9568.2011.07636.x [DOI] [PMC free article] [PubMed] [Google Scholar]
- Kita H, Kitai ST (1991) Intracellular study of rat globus pallidus neurons: membrane properties and responses to neostriatal, subthalamic and nigral stimulation. Brain Res 564:296–305. 10.1016/0006-8993(91)91466-E [DOI] [PubMed] [Google Scholar]
- Klapstein GJ, Fisher RS, Zanjani H, Cepeda C, Jokel ES, Chesselet MF, Levine MS (2001) Electrophysiological and morphological changes in striatal spiny neurons in R6/2 Huntington's disease transgenic mice. J Neurophysiol 86:2667–2677. 10.1152/jn.2001.86.6.2667 [DOI] [PubMed] [Google Scholar]
- Laforet GA, Sapp E, Chase K, McIntyre C, Boyce FM, Campbell M, Cadigan BA, Warzecki L, Tagle DA, Reddy PH, Cepeda C, Calvert CR, Jokel ES, Klapstein GJ, Ariano MA, Levine MS, DiFiglia M, Aronin N (2001) Changes in cortical and striatal neurons predict behavioral and electrophysiological abnormalities in a transgenic murine model of Huntington's disease. J Neurosci 21:9112–9123. 10.1523/JNEUROSCI.21-23-09112.2001 [DOI] [PMC free article] [PubMed] [Google Scholar]
- Levine MS, Cepeda C, Hickey MA, Fleming SM, Chesselet MF (2004) Genetic mouse models of Huntington's and Parkinson's diseases: illuminating but imperfect. Trends Neurosci 27:691–697. 10.1016/j.tins.2004.08.008 [DOI] [PubMed] [Google Scholar]
- Mailly P, Charpier S, Menetrey A, Deniau JM (2003) Three-dimensional organization of the recurrent axon collateral network of the substantia nigra pars reticulata neurons in the rat. J Neurosci 23:5247–5257. 10.1523/JNEUROSCI.23-12-05247.2003 [DOI] [PMC free article] [PubMed] [Google Scholar]
- Mangiarini L, Sathasivam K, Seller M, Cozens B, Harper A, Hetherington C, Lawton M, Trottier Y, Lehrach H, Davies SW, Bates GP (1996) Exon 1 of the HD gene with an expanded CAG repeat is sufficient to cause a progressive neurological phenotype in transgenic mice. Cell 87:493–506. 10.1016/S0092-8674(00)81369-0 [DOI] [PubMed] [Google Scholar]
- Mastro KJ, Bouchard RS, Holt HA, Gittis AH (2014) Transgenic mouse lines subdivide external segment of the globus pallidus (GPe) neurons and reveal distinct GPe output pathways. J Neurosci 34:2087–2099. 10.1523/JNEUROSCI.4646-13.2014 [DOI] [PMC free article] [PubMed] [Google Scholar]
- Mastro KJ, Zitelli KT, Willard AM, Leblanc KH, Kravitz AV, Gittis AH (2017) Cell-specific pallidal intervention induces long-lasting motor recovery in dopamine-depleted mice. Nat Neurosci 20:815–823. 10.1038/nn.4559 [DOI] [PMC free article] [PubMed] [Google Scholar]
- Miller BR, Walker AG, Shah AS, Barton SJ, Rebec GV (2008) Dysregulated information processing by medium spiny neurons in striatum of freely behaving mouse models of Huntington's disease. J Neurophysiol 100:2205–2216. 10.1152/jn.90606.2008 [DOI] [PMC free article] [PubMed] [Google Scholar]
- Parievsky A, Moore C, Kamdjou T, Cepeda C, Meshul CK, Levine MS (2017) Differential electrophysiological and morphological alterations of thalamostriatal and corticostriatal projections in the R6/2 mouse model of Huntington's disease. Neurobiol Dis 108:29–44. 10.1016/j.nbd.2017.07.020 [DOI] [PMC free article] [PubMed] [Google Scholar]
- Rebec GV, Conroy SK, Barton SJ (2006) Hyperactive striatal neurons in symptomatic Huntington R6/2 mice: variations with behavioral state and repeated ascorbate treatment. Neuroscience 137:327–336. 10.1016/j.neuroscience.2005.08.062 [DOI] [PubMed] [Google Scholar]
- Reiner A, Albin RL, Anderson KD, D'Amato CJ, Penney JB, Young AB (1988) Differential loss of striatal projection neurons in Huntington disease. Proc Natl Acad Sci U S A 85:5733–5737. 10.1073/pnas.85.15.5733 [DOI] [PMC free article] [PubMed] [Google Scholar]
- Rosas HD, Tuch DS, Hevelone ND, Zaleta AK, Vangel M, Hersch SM, Salat DH (2006) Diffusion tensor imaging in presymptomatic and early Huntington's disease: selective white matter pathology and its relationship to clinical measures. Mov Disord 21:1317–1325. 10.1002/mds.20979 [DOI] [PubMed] [Google Scholar]
- Sapp E, Ge P, Aizawa H, Bird E, Penney J, Young AB, Vonsattel JP, DiFiglia M (1995) Evidence for a preferential loss of enkephalin immunoreactivity in the external globus pallidus in low grade Huntington's disease using high resolution image analysis. Neuroscience 64:397–404. 10.1016/0306-4522(94)00427-7 [DOI] [PubMed] [Google Scholar]
- Slow EJ, van Raamsdonk J, Rogers D, Coleman SH, Graham RK, Deng Y, Oh R, Bissada N, Hossain SM, Yang YZ, Li XJ, Simpson EM, Gutekunst CA, Leavitt BR, Hayden MR (2003) Selective striatal neuronal loss in a YAC128 mouse model of Huntington disease. Hum Mol Genet 12:1555–1567. 10.1093/hmg/ddg169 [DOI] [PubMed] [Google Scholar]
- Smith Y, Bolam JP (1989) Neurons of the substantia nigra reticulata receive a dense GABA-containing input from the globus pallidus in the rat. Brain Res 493:160–167. 10.1016/0006-8993(89)91011-1 [DOI] [PubMed] [Google Scholar]
- Thompson-Vest NM, Waldvogel HJ, Rees MI, Faull RL (2003) GABA(A) receptor subunit and gephyrin protein changes differ in the globus pallidus in Huntington's diseased brain. Brain Res 994:265–270. 10.1016/j.brainres.2003.09.051 [DOI] [PubMed] [Google Scholar]
- Veldman MB, Yang XW (2018) Molecular insights into cortico-striatal miscommunications in Huntington's disease. Curr Opin Neurobiol 48:79–89. 10.1016/j.conb.2017.10.019 [DOI] [PMC free article] [PubMed] [Google Scholar]
- Vonsattel JP, DiFiglia M (1998) Huntington disease. J Neuropathol Exp Neurol 57:369–384. 10.1097/00005072-199805000-00001 [DOI] [PubMed] [Google Scholar]
- Waldvogel HJ, Faull RL (2015) The diversity of GABA(A) receptor subunit distribution in the normal and Huntington's disease human brain. Adv Pharmacol 73:223–264. 10.1016/bs.apha.2014.11.010 [DOI] [PubMed] [Google Scholar]
- Waldvogel HJ, Kim EH, Tippett LJ, Vonsattel JP, Faull RL (2015) The neuropathology of Huntington's disease. Curr Top Behav Neurosci 22:33–80. 10.1007/7854_2014_354 [DOI] [PubMed] [Google Scholar]
- Walker AG, Miller BR, Fritsch JN, Barton SJ, Rebec GV (2008) Altered information processing in the prefrontal cortex of Huntington's disease mouse models. J Neurosci 28:8973–8982. 10.1523/JNEUROSCI.2804-08.2008 [DOI] [PMC free article] [PubMed] [Google Scholar]
- Zhang J, Zhang L, Jiao H, Zhang Q, Zhang D, Lou D, Katz JL, Xu M (2006) c-fos facilitates the acquisition and extinction of cocaine-induced persistent changes. J Neurosci 26:13287–13296. 10.1523/JNEUROSCI.3795-06.2006 [DOI] [PMC free article] [PubMed] [Google Scholar]