Figure 6.
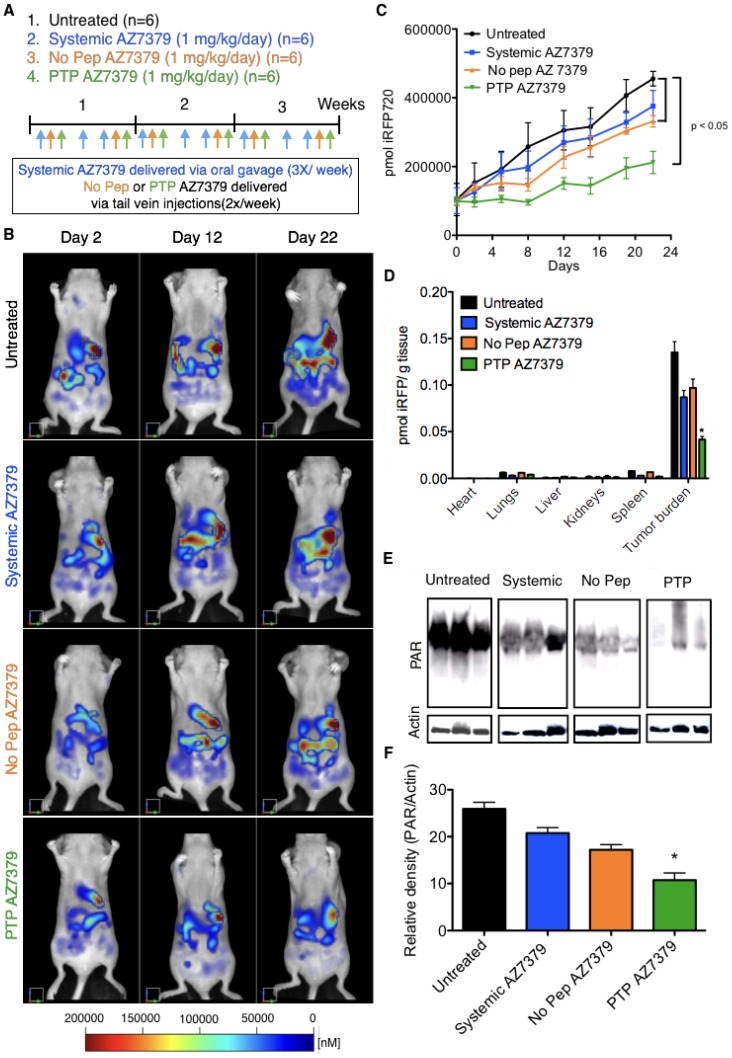
PTP liposomes delay tumor growth of OVCAR8 cells expressing iRFP. (A) Experimental design for measuring PD following AZ7379 delivery. There were 4 groups: 1) untreated (n=6), 2) systemic AZ7379 (n=6), 3) No Pep AZ7379 (n=6), 4) PTP liposomes AZ7379 (n=6). Systemic AZ7379 was delivered three times a week by oral gavage and liposomal groups 3 and 4 were delivered twice a week via tail vein injections. (B) FMT images of mice from different treatment groups at days 2, 12, and 22 after treatment. (C) Tumor volume was measured every week following treatment by imaging the mice via FMT and plotted over time to determine the efficacy of each treatment (p< 0.05). (D) Ex vivo FMT images of organs after 3 weeks of treatment. iRFP fluorescence was normalized to the weight of the organs and represented as pmol of iRFP per g tissue. Tumor burden included tumor isolated from the omentum and diaphragm, which were the majors regions where tumor mass was observed. (E) PAR and actin were quantified from tumor lysates by Western blot. The Western blot images represent lysates from 3 animals of each group chosen randomly from this study. (F) PAR expression was normalized to actin expression in the same lysates/ blot (* represents p< 0.05).

