

SUMMARY
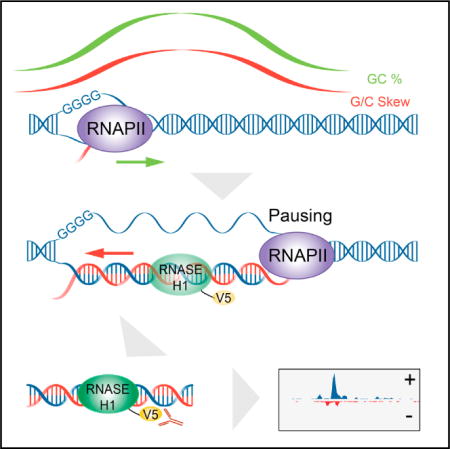
R-loop, a three-stranded RNA/DNA structure, has been linked to induced genome instability and regulated gene expression. To enable precision analysis of R-loops in vivo, we develop an RNase-H-based approach; this reveals predominant R-loop formation near gene promoters with strong G/C skew and propensity to form G-quadruplex in non-template DNA, corroborating with all biochemically established properties of R-loops. Transcription perturbation experiments further indicate that R-loop induction correlates to transcriptional pausing. Interestingly, we note that most mapped R-loops are each linked to a nearby free RNA end; by using a ribozyme to co-transcriptionally cleave nascent RNA, we demonstrate that such a free RNA end coupled with a G/C-skewed sequence is necessary and sufficient to induce R-loop. These findings provide a topological solution for RNA invasion into duplex DNA and suggest an order for R-loop initiation and elongation in an opposite direction to that previously proposed.
Graphical abstract
In Brief Chen et al. developed R-ChIP to map R-loops genome-wide with high resolution. Most captured R-loops are associated with gene promoters and dynamically correlated with transcriptional pausing. They further demonstrated that a free RNA end coupled with a preferred G/C skew sequence is required to promote R-loop formation.
INTRODUCTION
During transcription, nascent RNA exiting from the RNA channel of polymerase may anneal back to template DNA, forming a three-stranded structure known as R-loop (Santos-Pereira and Aguilera, 2015). R-loops are ubiquitously present across organisms from bacteria to mammals, believed to have multifaceted effects on cell fitness (Skourti-Stathaki and Proudfoot, 2014). R-loops are thought to retard elongation of RNA polymerase (Huertas and Aguilera, 2003) and DNA replisome (Tuduri et al., 2009), which may underlie genome instability induced by transcription and replication conflicts (Hamperl et al., 2017). Besides various pathological effects, R-loops have been shown to promote class-switch recombination (CSR) in activated B cells (Yu et al., 2003), help maintain open chromatin for epigenetic regulation (Powell et al., 2013), and facilitate the recruitment of transcription factors (Chen et al., 2015). R-loops have also been linked to transcription termination in certain cases (Skourti-Stathaki et al., 2014; Skourti-Stathaki et al., 2011). These findings suggest that R-loops have important biological functions under both physiological and pathological conditions.
R-loop formation has been extensively characterized at biochemical levels. The size of R-loops ranges from 150 to 500 bp, as directly visualized by electron microscopy (EM) (Duquette et al., 2004). R-loops appear to predominately occur immediately downstream of gene promoters, as demonstrated on several endogenous genes by bisulfate sequencing (Ginno et al., 2012). Most importantly, R-loop formation shows a strong sequence preference with high G/C ratio in the non-template DNA strand, known as G/C skew [calculated as (G−C)/(G+C)] (Ginno et al., 2012, 2013). G-rich non-template sequences may form certain structure to favor R-loop formation, although it is still under debate whether a postulated G-quadruplex is involved (Duquette et al., 2004; Roy et al., 2008), whereas C-rich template sequences are thought to permit stronger RNA/DNA base-pairing to compete with DNA/DNA base-pairing in order to enhance and stabilize R-loop formation (Sugimoto et al., 1995). R-loop is clearly a consequence of transcription, and recent studies have linked transcriptional induction to enhanced R-loop formation under physiological conditions (Stork et al., 2016). However, for unknown reason or mechanism, transcriptional output does not seem to correlate to R-loop levels on individual genes (Stork et al., 2016; Wahba et al., 2016). Excessive R-loop formation may also result from defects in RNA export (Huertas and Aguilera, 2003) or pre-mRNA splicing (Li and Manley, 2005), indicating that the commitment of nascent RNA to co-transcriptional RNA-processing pathways in a timely manner helps prevent excessive R-loop formation in normal cells (Bonnet et al., 2017). Despite these advances, many pressing questions remain in understanding R-loop biology with respect to its formation and dynamics in relationship to regulated gene expression, especially at the genome scale (Chédin, 2016).
Detection of R-loops has been largely based on the use of a monoclonal antibody (S9.6) specific for RNA/DNA hybrids (Boguslawski et al., 1986). In recent years, this affinity probe has been coupled with deep sequencing to detect R-loops genome-wide in yeast (Chan et al., 2014; El Hage et al., 2014; Wahba et al., 2016), plant (Xu et al., 2017), and mammals (Ginno et al., 2012, 2013; Nadel et al., 2015; Sanz et al., 2016; Stork et al., 2016). The majority of these methods use the S9.6 antibody to capture RNA/DNA hybrids from restriction digested genomic DNA followed by deep sequencing of captured DNA (DNA:RNA immunoprecipitation [DRIP] sequencing [DRIP-seq] and its derivatives) or RNA (DNA:RNA immunoprecipitation followed by cDNA conversion [DRIPc]-seq and its derivatives) (Chédin, 2016). Because of limited resolution with restriction digestion, additional efforts have also been made to use sonication to increase R-loop mapping resolution (Halász et al., 2017; Nadel et al., 2015); however, such treatment may destroy some fragile R-loops in the absence of fixation. These technical problems may thus account for various inconsistent results in the literature. For example, a published R-loop profile showed a metagene peak near gene promoters (Chen et al., 2015), but other studies suggested R-loops are more spread in gene bodies (Ginno et al., 2012, 2013; Stork et al., 2016), and yet another work revealed a metagene peak 1.5 Kb downstream of transcription start sites (TSSs) (Sanz et al., 2016). While most mapped R-loops are linked to G/C skew, a recent report even detected A/T skew underlying mapped R-loops in yeast (Wahba et al., 2016).
Because location matters for understanding R-loop biology, we sought to develop an in vivo strategy for R-loop profiling based on RNase H, a gold standard for R-loop recognition in the cell. By expressing a catalytically dead RNASEH1 followed by strand-specific amplification of immunoprecipitated (IPed) DNA (termed R-ChIP), we efficiently captured R-loops associated with all key sequence features established by biochemistry (Duquette et al., 2004; Roy and Lieber, 2009; Roy et al., 2008; Sugimoto et al., 1995). Transcriptional perturbation experiments revealed a dynamic link of R-loop induction with RNAPII pausing at gene promoters. We also noted the proximity of most mapped R-loops to free RNA ends. We pursued this intriguing association by using an engineered ribozyme system to show the functional requirement of a free RNA end coupled with a G/C-skewed sequence for promoting de novo R-loop formation. These findings have important implications in the requirement for R-loop initiation and elongation as well as the contribution of R-loops to transcriptional control.
RESULTS
In Vivo R-loop Profiling Using Catalytically Dead RNASEH1
Current R-loop profiling methods appear to have an intrinsic limitation in pinpointing the exact location of R-loops in individual genomic fragments captured by S9.6 according to a recent analysis (Halász et al., 2017). Diminished signals upon RNase H digestion may reflect the absence of R-loop for capture but do not necessarily show where a specific R-loop(s) is in individual restriction fragments. Although RNase H has been previously explored to capture RNA/DNA hybrids in vitro (DRIVE-seq), the capture efficiency appears quite poor compared to S9.6 (Ginno et al., 2012). Because RNase H may recognize R-loops more efficiently and with higher specificity in the cell than in test tube and a catalytically dead RNase H has been demonstrated to target R-loops in vivo (Tresini et al., 2015), we were motivated to explore this in vivo R-loop capture strategy to understand the mechanism for R-loop formation.
Mammalian cells express two RNase H enzymes, one of which (RNASEH1) is composed of a single polypeptide, thus convenient for molecular manipulation. Because RNase H is known to target both the nucleus and mitochondrion (Cerritelli et al., 2003), we first constructed two forms of human RNASEH1 mutant proteins fused with a nuclear localization signal (NLS) at the N terminus for exclusive targeting to the nuclear genome and a V5 tag at the C terminus to enable efficient IP (Figure 1A). The D210N mutation abolishes the catalytic activity of RNASEH1, whereas a combination of three specific mutations (W43A, K59A, K60A) in the binding domain prevents the enzyme from binding to RNA/DNA hybrids (Nowotny et al., 2007, 2008). A quadruple mutant that carries all four mutations (WKKD) thus inactivates both binding and catalytic activities of RNASEH1, which provides an ideal negative control. We introduced both wild-type (WT) and mutant RNASEH1 (D210N and WKKD) into HEK293T cells, all expressed at comparable levels (Figure S1A). Immunocytochemistry showed exclusive nuclear localization of all tagged RNASEH1 proteins with selective enrichment in the nucleolus (Figure 1B), consistent with extensive R-loops on rDNA loci (Chan et al., 2014; El Hage et al., 2014; Wahba et al., 2016). Despite overexpression, neither WT nor mutant RNASEH1 caused any measureable defects in cell proliferation and cell-cycle progression, in line with previous reports (Chen et al., 2015; Stork et al., 2016). In theory, a catalytically dead RNASEH1 may bind to R-loop and prevent its resolution, but we did not detect obvious impact on nascent RNA production measured by global run-on sequencing (GRO-seq) when comparing cells with or without expressing the D210N mutant (data not shown).
Figure 1. Genome-wide R-loop Profiling by Strand-Specific R-ChIP.
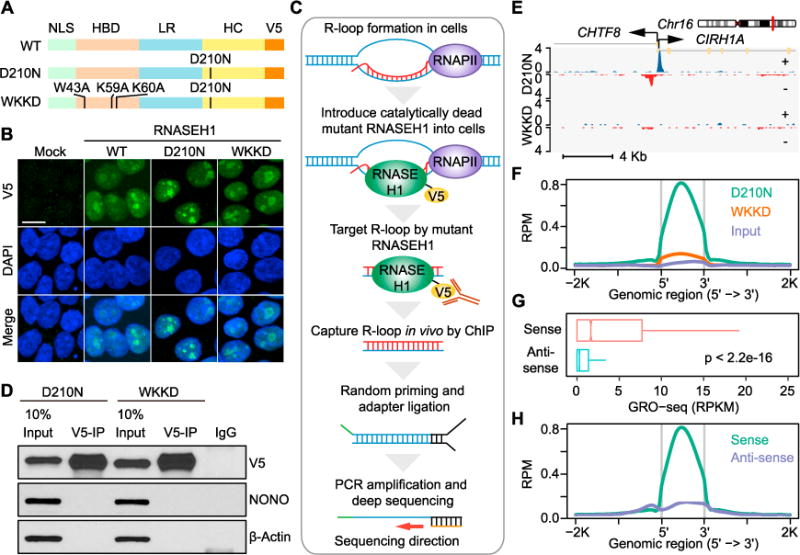
(A) Design of RNASEH1 expression vectors. NLS, nuclear localization signal; HBD, RNA/DNA hybrid binding domain; LR, linker region; HC, RNA/DNA hybrid catalytic domain; V5, V5 tag.
(B) Localization of exogenously expressed wild-type (WT) and mutant (D210N and WKKD) RNASEH1 in HEK293T cells by immunocytochemistry. Green: V5, Blue: DAPI; scale bar, 20 μm.
(C) Schematic presentation of the R-ChIP strategy.
(D) Immunoprecipitation of exogenously expressed RNASEH1 (D210N and WKKD mutants) by using anti-V5 antibody with similar efficiency. The levels of RNASEH1 were analyzed by western blotting relative to invariant nuclear protein NONO and cytoplasmic protein β-actin.
(E) A representative genomic region showing the R-ChIP signals in cells expressing D210N or WKKD mutant proteins. Blue: + strand, Red: − strand.
(F) The signal intensity profiles of R-ChIP within the peak regions in HEK293T cells expressing D210N versus WKKD relative to input.
(G) The signal intensity of GRO-seq from the same (sense) or opposite (anti-sense) strand of individual R-ChIP peak regions. Wilcoxon test was used to calculate the p value.
(H) The strand specificity of R-ChIP signals. The signals associated with a R-ChIP peak were divided into sense (in the same orientation of the peak) and anti-sense (in the opposite orientation of the peak) groups for comparison.
See also Figure S1.
Next, we designed a strand-specific strategy to analyze captured R-loops in vivo. As illustrated in Figure 1C, we first performed chromatin immunoprecipitation (ChIP) with an anti-V5 antibody. The IPed DNA part of the RNA/DNA hybrid was next converted to double-strand DNA (dsDNA) by using an adaptor-containing random primer followed by ligation to another double-stranded adaptor for PCR amplification and deep sequencing. Although both D210N and WKKD mutant proteins were IPed with equal efficiency with anti-V5 (Figure 1D), ChIP-qPCR analysis revealed strong signals at TSS regions of multiple genes in cells expressing D210N but not WKKD (Figure S1B), indicating that the catalytically dead RNASEH1 can specifically target R-loops in vivo. We thus proceeded with deep sequencing of R-ChIP libraries, yielding a total of 49 million 40-nt reads (22.6 million uniquely mapped reads after removing PCR duplicates) from three biological replicates, and demonstrated high global reproducibility by pairwise comparison of independent R-ChIP libraries (Figure S1C).
Using a standard ChIP-seq peak calling method (see STAR Methods), we identified 12,906 specific peaks based on total input control. As expected, we detected specifically enriched signals with D210N, but not WKKD, on a specific example (Figure 1E) as well as globally (Figure 1F). Because of some low levels of ChIP-seq signals with WKKD, we subtracted such background and found that out of 12,906 R-ChIP peaks, 12,521 (97%) still remained as significant peaks. The mapped R-loops were in line with the orientation of locally transcribed RNAs detected by GRO-seq (Figure 1G) and showed remarkable strand specificity (Figure 1H). To further validate specific D210N binding events in the genome, we also engineered a HEK293T cell line expressing a truncated form of RNASEH1 with the catalytic domain deleted (DHC, see Figures S1A and S1D) and found that this DHC mutant generated specific R-ChIP signals essentially identical to those detected with D210N (Figures S1D and S1E). Together, these data strongly suggest that R-ChIP efficiently and faithfully captures R-loops in vivo.
Strong Sequence Preference and Unique Genomic Distribution of Mapped R-loops
We first used our R-ChIP data to determine the R-loop size in comparison with that directly visualized under EM. We found a median peak size of 199 bp by the narrow peak calling strategy of MACS2 (Feng et al., 2012) and a larger size (318 bp) by the broad peak calling strategy (Figure 2A). The vast majority (89.5%) of broad peaks encompassed narrow peaks (Figure S2A), and those uniquely identified by only one of the peak calling strategies were in general associated with weaker R-ChIP signals (Figure S2B). Therefore, the R-loop size range deduced by R-ChIP is similar to that observed under EM and by bisulfate sequencing (Duquette et al., 2004; Yu et al., 2003).
Figure 2. Sequence Features and Genomic Distribution of R-ChIP Signals.
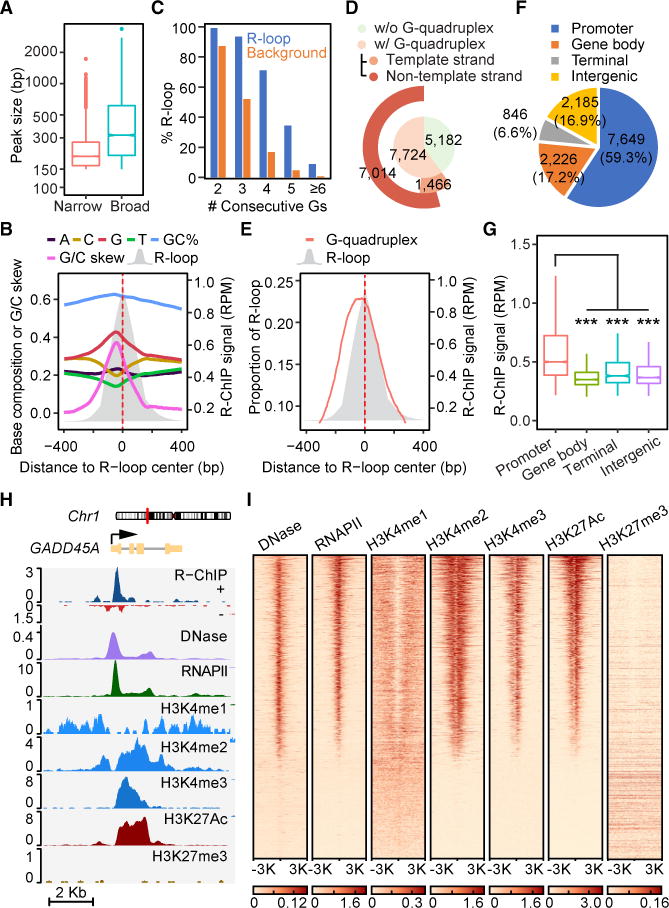
(A) The size distribution of R-ChIP peaks determined by the narrow or broad peak calling strategies of MACS2. See also Figure S2.
(B) Base composition, G/C content, and G/C skew associated with a composite R-loop map.
(C) Percentages of total R-loops according to associated consecutive G numbers (G-clusters) in the ±50 bp flanking region of the G/C skew summit in comparison with background.
(D) Coincidence between R-ChIP mapped R-loops and potential G-quadruplex forming regions, emphasizing predominant overlap with G-quadruplex forming regions on the non-template DNA strand.
(E) R-loop profile relative to sequences that have the potential to form G-quadruplex.
(F) The genomic distribution of R-ChIP mapped R-loops. Various genomic regions are color coded according to the labels on the top.
(G) The signal intensity distribution of R-ChIP peaks in different genomic regions.
(H) A representative genomic region covering the GADD45A gene locus, showing R-ChIP signals relative to open chromatin (DNase-seq), RNAPII occupancy, and various chromatin marks.(I) The heatmap presentation of DNase-seq signals and ChIP-seq signals for RNAPII, H3K4me1, H3K4me2, H3K4me3, H3K27ac, and H3K27me3 in regions ±3 Kb from R-loop centers.
We next analyzed the sequence preference associated with R-loops. We found strong G/C skew in the non-template DNA within mapped R-loop regions (Figure 2B). We further noted a peak in G distribution near the front of R-loops, with many containing 3–5 consecutive G residues (Figures 2B and 2C), consistent with the formation of G-quadruplex or some distorted structure to separate non-template from template DNA to promote R-loop formation (Duquette et al., 2004; Stork et al., 2016). By comparing with the published G-quadruplex profile from in vitro folded DNA fragments (Chambers et al., 2015), we found a substantial overlap with our in vivo mapped R-loops, and the sequences that have the potential to form G-quadruplex were preferentially distributed in the non-template DNA strand (Figure 2D), which were also located at the front of mapped R-loops (Figure 2E). These data reveal a tight association of G-rich clusters in the non-template DNA with the potential of R-loop formation genome-wide.
In light of the remarkable agreement between in vivo R-loops mapped with R-ChIP and all biochemical properties known to promote R-loop formation and stabilization established in vitro, we next determined the genomic distribution of newly mapped R-loops. Although the association of R-loops with gene promoters has been a general consensus in the field, the existing R-loop maps also suggest their prevalent distribution in gene bodies and gene ends (Ginno et al., 2012, 2013; Sanz et al., 2016; Stork et al., 2016). We found that more than half of R-ChIP mapped peaks (7,649, 59.3%) resided in promoter proximal regions (±1 Kb from TSS) (Figure 2F). Additional R-loops were mapped to various locations within gene bodies (2,226, 17.2%), near gene terminal (846, 6.6%), or in intergenic regions (2,185, 16.9%). However, the average signal intensity at promoters was significantly higher than that in other genomic regions (Figure 2G). Therefore, despite strong potential of G-quadruplex formation in numerous regions in gene bodies, these observations suggest that the bulk of gene body sequences are prohibitive to R-loop formation, implying other critical requirements for efficient R-loop formation near TSSs. Overall, most detected R-loop peaks were coincident with open chromatin based on DNase I hypersensitivity, RNAPII occupancy, and multiple active chromatin marks (Figures 2H and 2I), suggesting that active gene promoters are major hotspots for R-loop formation in the genome.
Systematic Comparison with S9.6-Captured R-loops
To enable direct and qualitative comparisons with previous R-loop profiles, we constructed highly reproducible R-ChIP libraries from K562 cells (Figure S3A), on which the DRIP-seq experiment was previously performed (Sanz et al., 2016). Using the broad peak calling strategy (which is more effective in analyzing DRIP-seq peaks), we found a marked difference in R-loop size (Figure 3A), as exemplified on the JUN locus (Figure 3B). Importantly, we found only ~1/3 overlapped R-loop peaks between R-ChIP and DRIP-seq, among which ~30% DRIP-seq peaks (749) contained multiple R-ChIP peaks (Figure 3C), either on the same (251, 33.5%) or the opposite (498, 66.5%) strand. While most R-ChIP peaks were associated with promoter and intergenic regions, DRIP-seq peaks were almost evenly distributed in promoter, gene body, and terminal regions, with only a small number of peaks (4.3% of total) in intergenic regions (Figure 3D).
Figure 3. Systematic Comparison of R-loops Captured by the Catalytically Dead RNASEH1 versus S9.6.
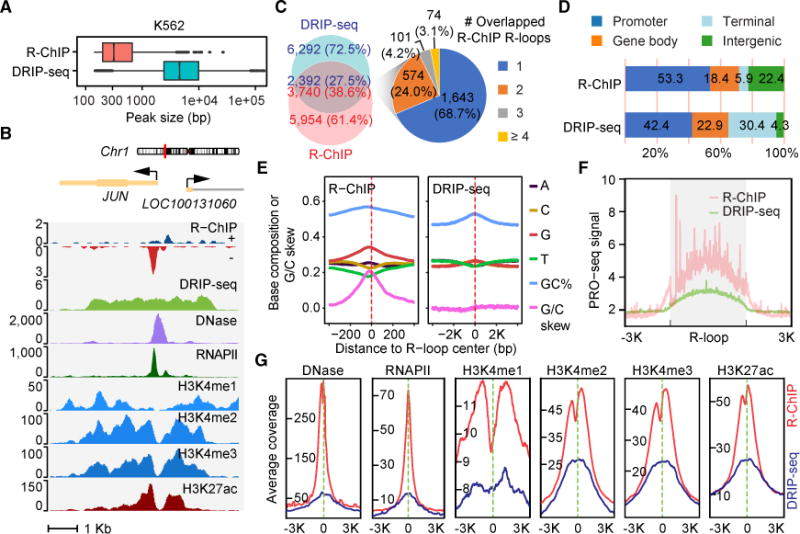
(A) The size distribution of R-loops determined by R-ChIP (n = 9,694) and DRIP-seq (n = 8,684) in K562 cells.
(B) A representative genomic region covering the JUN locus, showing R-ChIP in comparison with DRIP-seq signals relative to various chromatin marks in K562 cells.
(C) Left: overlap of peaks identified by R-ChIP and DRIP-seq. Right: R-ChIP and DRIP-seq overlapped peaks were divided into 4 groups according to the number of R-ChIP peaks covered by a single DRIP-seq peak. Each group in the pie chart is color coded according to the labels on the right.
(D) The genomic distribution of R-loops mapped with R-ChIP and DRIP-seq.
(E) The sequence features associated with R-loops mapped with R-ChIP and DRIP-seq. Note the 10-fold difference in R-loop size detected by R-ChIP versus DRIP-seq.
(F) The signal intensity profiles of PRO-seq over the composite peak based on R-ChIP or DRIP-seq.
(G) The signal intensity profiles of various chromatin marks in regions ±3 Kb from the center of R-ChIP or DRIP-seq mapped R-loops.
See also Figures S3 and S4.
The overall R-ChIP peaks showed much higher G content and G/C skew compared to those detected by DRIP-seq (Figure 3E). Because R-loop is induced by transcription, we compared RNAPII activities detected by precision nuclear run-on sequencing (PRO-seq) (Core et al., 2014), finding more pronounced transcription activities within R-ChIP peaks relative to DRIP-seq peaks (Figure 3F). Compared to DRIP-seq, R-loops mapped with R-ChIP also showed much stronger coincidence with open chromatin (Figure 3G). The characteristics of strong G/C skew, linkage to transcription, and association with open chromatin were also evident on R-loops uniquely mapped with R-ChIP but largely absent among those uniquely detected by DRIP-seq (Figures S3B–S3D). The poor performance of DRIP-seq is likely due to limited resolution. Therefore, we next used the same data-processing pipeline to analyze the DRIPc-seq data from NT2 cells, which in principle might have improved specificity and resolution by sequencing R-loop-associated RNAs (Sanz et al., 2016). Because of different cell types analyzed, we selected commonly expressed genes for comparison, finding 30% overlap between R-loops mapped with R-ChIP and DRIPc-seq. Compared to R-ChIP-captured R-loops (see Figures 2B and 2I), DRIPc-seq peaks showed little G/C skew (Figure S4A, top panel) and poor association with active histone marks (Figure S4B). Furthermore, as RDIP-seq might have increased resolution by including a sonication step (Nadel et al., 2015), we also compared our data with RDIP-seq data generated on HEK293T cells. We found even less (~10%) overlap between the two datasets, likely because ~60% of R-ChIP-captured R-loops were associated with TSSs, compared to only ~5% with RDIP-seq as reported earlier (Nadel et al., 2015). Again, RDIP-seq peaks showed only slight G/C skew enrichment (Figure S4A, bottom panel) and weak association with active chromatin marks (Figure S4C). These data demonstrated the robustness of R-ChIP compared to several major S9.6 antibody-based R-loop mapping methods.
Other R-loop Hotspots in the Human Genome
Besides well-known R-loop hotspots in rDNA loci (data not shown), we observed that the vast majority of expressed tRNA genes showed R-loops in both HEK293T and K562 cells (Figures 4A, and 4B, and S5A). While this is consistent with the DRIP-derived data from budding yeast detectable after depleting RNASEH1/2 (Chan et al., 2014; El Hage et al., 2014; Wahba et al., 2016), we noted that neither DRIP-seq nor DRIPc-seq captured tRNA-generated R-loops in normal mammalian cells (Figure S5B) (Sanz et al., 2016). To rule out the possibility that enriched tRNAs were due to non-specific binding of abundant cellular tRNAs with RNASEH1 during IP, we treated the IPed materials with RNase A before library preparation and obtained the same results (Figure S5C), while parallel R-ChIP with purified yeast total tRNA yielded no signals (Figure S5C). Interestingly, unlike other RNA-induced R-loops, which showed strong strand specificity, most tRNA-induced R-loops produced both sense and anti-sense signals (Figures 4A, 4C, top panel, S5A, and S5D). This likely reflects sequence complementarity within tRNA sequences, allowing them to separately anneal to both template and non-template DNA strands, as modeled (Figure 4C, bottom panel).
Figure 4. Other R-loop Hotspots in the Human Genome.
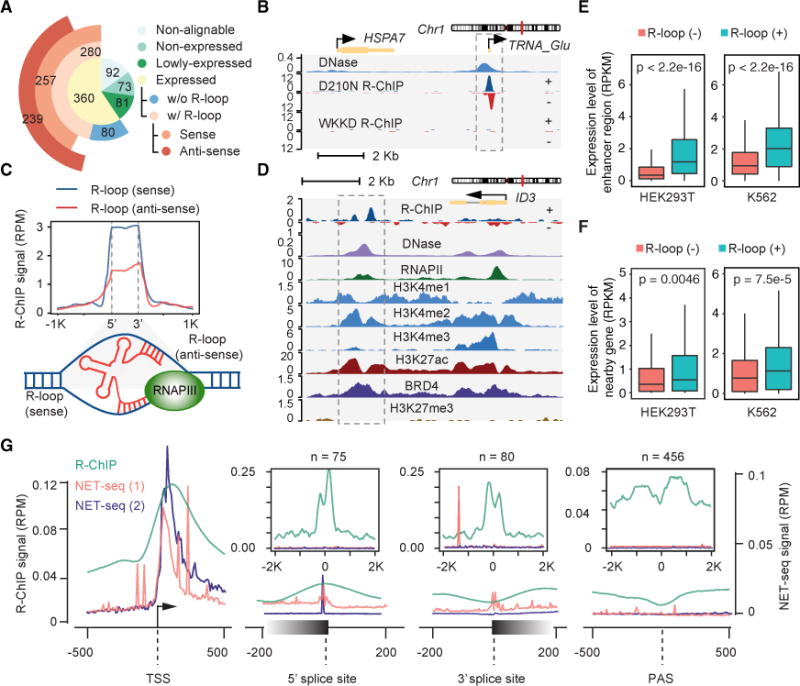
(A) The number of tRNA genes in different categories according to reads alignability, expression level, and association with the R-loop captured by R-ChIP in HEK293T cells. See also Figures S5A–S5C.
(B) A representative genomic region, showing R-ChIP enrichment at both sense and anti-sense strands of the TRNA_Glu gene locus in HEK293T cells.
(C) Top: the signal intensity profile of R-loops on sense (non-template) and anti-sense (template) strands of tRNA genes, respectively. Bottom: a model showing R-loop formation through the interaction of a nascent tRNA transcript with both sense and anti-sense strands of DNA. See also Figure S5D.
(D) A representative genomic region, showing R-ChIP captured R-loops downstream of the ID3 gene in comparison with various chromatin marks.
(E) eRNA production levels associated with R-loop (−) versus (+) enhancers in HEK293T and K562 cells. Wilcoxon test was used to calculate indicated p values.
(F) Transcription levels of neighboring genes ±50 Kb from R-loop (−) versus (+) enhancers in HEK293T and K562 cells. Wilcoxon test was used to calculate indicated p values.
(G) R-ChIP signal intensities in comparison with nascent transcription levels detected by NET-seq (1: Mayer et al., 2015 on HEK293T cells; 2: Nojima et al., 2015 on HeLa cells) at TSSs, 5′ and 3′ splice sites, and poly(A) sites. The inserts display the signal intensity profiles of R-ChIP mapped R-loops (n = the number of R-loops) associated with 5′ splice sites, 3′ splice sites, and poly(A) sites. In each case, R-loops that were also associated with other genomic regions, e.g., promoter and enhancer regions, were excluded. Note the absence of RNAPII pausing at poly(A) sites or any of internal R-loops. See also Figure S5E.
We also mapped R-loops in various intergenic regions, many of which were associated with active enhancers defined by BRD4 and H3K27ac ChIP-seq signals, as exemplified on a specific intergenic locus downstream of the ID3 gene (Figure 4D). Although active enhancers are known to produce divergent enhancer RNA (eRNA) transcripts, we often detected R-ChIP signals predominantly on one side of enhancers, similar to divergent promoters and contrary to active tRNA loci. This may reflect the presence of G/C-skewed sequences on one side of promoters and enhancers. To globally analyze R-loop formation on enhancers, we used H3K27ac signals to define active enhancers and found that 5.3% (288 out of 5,473) and 4.5% (281 out of 6,184) potential enhancers were able to generate R-loops in HEK293T and K562 cells, respectively. Interestingly, relative to enhancers not linked to R-loop formation [R-loop (−)], enhancers associated with R-loops [R-loop (+)] showed higher expression of eRNAs (Figure 4E) and nearby genes (Figure 4F), as detected by GRO-seq in HEK293T (current study) and PRO-seq in K562 cells (Core et al., 2014). Therefore, R-loops also tend to occur on some highly active enhancers in the genome.
As mentioned above, we also detected various R-loops within gene bodies after filtering out potential enhancer-associated signals. Previous studies showed RNAPII pausing at 5′ and 3′ splice sites as well as near poly(A) sites (red and blue lines in Figure 4G) (Mayer et al., 2015; Nojima et al., 2015). We found <100 R-ChIP peaks associated with 5′ or 3′ splice sites and 500 peaks near poly(A) sites, but, contrary to the expectation, most of those R-loops were not associated with internal RNAPII pausing events detected by native elongating transcript sequencing (NET-seq) (Figure 4G) or by PRO-seq (data not shown), despite the fact that these internal R-loops showed typical G/C skew (Figure S5E). These observations indicate that internal RNAPII pausing hotspots are not linked to R-loop formation.
R-loop Induction in Response to Transcriptional Perturbation
We next focused on understanding a puzzle about diminished, rather than increased, R-loop upon treating cells with the transcription inhibitor 5,6-dichloro-1-β-D-ribofuranosylbenzimidazole (DRB) (Sanz et al., 2016), a drug known to block transcriptional elongation in gene body but increase RNAPII pausing at TSS by inhibiting the RNAPII C-terminal domain (CTD) kinase pTEFb (Jonkers and Lis, 2015). We first performed R-ChIP-qPCR on several gene promoters upon DRB treatment (2 hr), observing elevated R-loops in all cases (Figure 5A). Careful comparison between our data and those reported earlier (Sanz et al., 2016) revealed that the previous study placed PCR primers on DRIPc-seq mapped R-loop peaks, which were ~1.5 Kb away from each promoter, whereas our PCR primers were designed to interrogate individual gene promoters according to R-ChIP mapped R-loop peaks at TSSs. This explains diminished R-loop signals from the previous study because DRB is known to block RNAPII elongation beyond major pausing sites near TSSs.
Figure 5. Elevated RNAPII Pausing at TSS Allows for Increased R-loop Formation.
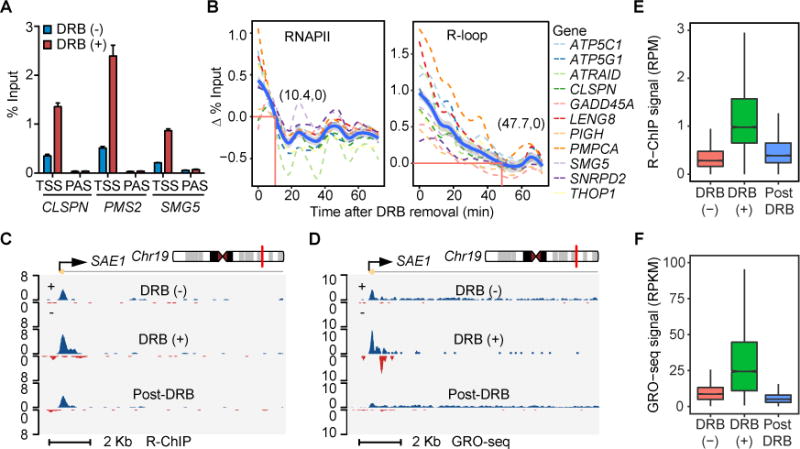
(A) Induction of TSS-associated R-loops upon DRB treatment (2 hr) on three representative genes detected by R-ChIP-qPCR. Results were calculated as the percentage of input and presented as mean ± SEM (n = 3 technical replicates).
(B) Dynamics of the RNAPII occupancy and R-loop level following DRB removal at TSS regions of 11 representative genes by RNAPII ChIP-qPCR and R-ChIP-qPCR. Cells were first treated with DRB for 2 hr and then collected every 6 min after DRB removal. Thick blue line: average RNAPII ChIP-qPCR and R-ChIP-qPCR values of 11 genes. Red lines indicate the time point, at which the average RNAPII occupancy or R-loop level returned to the baseline level in untreated cells. The associated numbers indicate the time (min) for returning to the baseline.
(C and D) A representative genomic region covering the TSS region of SAE1, showing R-ChIP (C) and GRO-seq (D) signals in response to DRB treatment [DRB(+)] and removal (Post-DRB).
(E and F) Signal intensity distribution of overall R-loop levels detected by R-ChIP (E) and RNAPII activities by GRO-seq (F) at TSSs in response to DRB treatment [DRB(+)] and removal (Post-DRB).
See also Figure S6.
This observation prompted us to further investigate R-loop dynamics in relationship to transcriptional pause release after washing away DRB. On 11 gene promoters, we performed ChIP-qPCR for RNAPII and R-ChIP-qPCR to detect R-loop decay at different time points up to 72 min after removing DRB (Figure 5B). Interestingly, we found that RNAPII binding decreased ahead of R-loop resolution in all cases, as indicated by differential decay rate on individual gene promoters as well as the averaged curves (thick blue lines) based on all 11 genes we surveyed (Figure 5B). Encouraged by these findings, we further extended the analysis globally by generating highly reproducible R-ChIP libraries on mock-treated HEK293T cells [DRB(−)] or cells treated with DRB for 2 hr [DRB(+)] or after DRB removal for 30 min [post-DRB] (Figure S6A). As shown on a specific example (SAE1), DRB treatment induced R-loop at TSS and DRB removal returned the R-loop to the original level (Figure 5C). We also performed GRO-seq to monitor transcriptionally engaged RNAPII under these conditions, confirming DRB-induced pausing at TSS and resumed RNAPII elongation after DRB removal, as indicated by reduced nascent RNA signals at TSS and restored signals in gene body (Figure 5D). These trends held for all expressed genes from global analysis (Figures 5E and 5F). As demonstrated on the 11 genes surveyed by R-ChIP-qPCR (Figure S6B), we also observed a large amount of remaining R-ChIP signals compared to largely cleared GRO-seq signals from TSSs (Figure S6C). These data suggest that, while R-loop induction is coupled with RNAPII pausing at TSSs, R-loop resolution is not required for RNAPII pause release (note that most remaining R-loops were unlikely to result from newly recruited RNAPII because of small amounts of nascent RNAs generated after DRB removal, see Figure 5D).
R-loop Dynamics Linked to Transcriptional Activities at TSSs
The data presented above established a potential link between R-loop and transcription. However, R-loop levels do not seem to correlate with transcriptional outputs (Stork et al., 2016). We envisioned that such lack of correlation might reflect a link of R-loop dynamics to local transcriptional activities, but not the ultimate transcriptional output, the latter of which might be collectively determined by regulatory steps both at and beyond gene promoters. Despite the fact that we only generated the data before DRB treatment, after DRB treatment and after DRB washout, which did not permit us to deduce real kinetics of R-loop formation and resolution genome-wide, we felt that the data might still enable us to test the hypothesis by obtaining potential correlative evidence. We therefore first divided overall R-loop peak regions into three classes based on R-loop intensities (high, medium, and low) in order to compare with the underlying sequence features. Interestingly, we found that neither G% nor G/C skew was strongly correlated with R-loop levels, although these sequence features were correlated with the efficiency of R-loop formation (see Figure 2B), and, in contrast, the G/C content was positively linked to R-loop levels at the steady state (Figure 6A).
Figure 6. Correlation of R-loop Levels with G/C Content and RNAPII Pausing at TSSs.
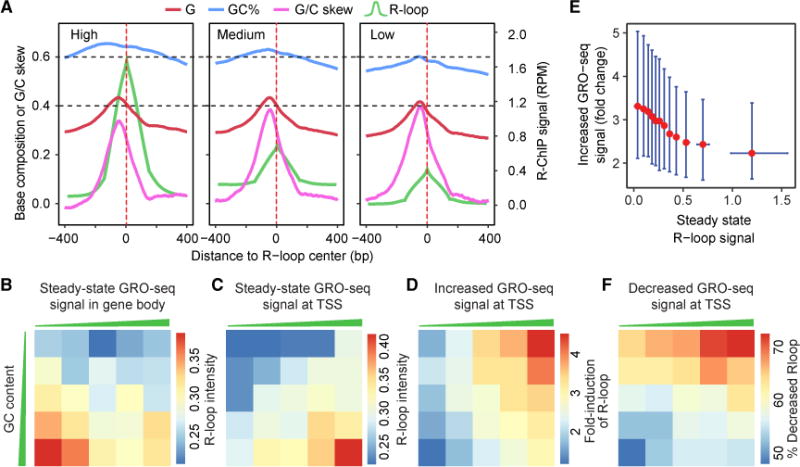
(A) R-loops were divided into three groups according to the R-ChIP signal intensity (green). The sequence features associated with each group are shown.
(B) Division of promoter proximal regions (−30 to +300 bp from TSSs) into five groups according to local G/C content levels (y axis) and comparison with the overall transcriptional output measured by GRO-seq in gene bodies (x axis) in association with the median peak intensity of TSS-associated R-loops (color-coded squares).
(C) Comparison between TSS-associated R-loop levels and TSS-associated transcription activities in different G/C groups.
(D) Comparison between induced R-loop and induced GRO-seq signals at TSSs in different G/C groups after DRB treatment (2 hr).
(E) Comparison between DRB-induced GRO-seq signals and steady-state R-loop levels at TSSs. Data are shown as median and interquartile range.
(F) Comparison between decrease in R-loop levels and decline in GRO-seq signals in different G/C groups after DRB removal for 30 min.
We next segregated actively transcribed genes associated with detectable R-loop formation at TSSs (n = 8,502) into five classes according to their G/C content within R-ChIP mapped R-loop regions. In line with the previous report (Stork et al., 2016), we found little correlation between R-loop levels and overall gene expression at the steady state (Figure 6B). Interestingly, when focusing on GRO-seq signals at TSSs, we detected a strong correlation between transcriptional activities and R-loop intensities at each G/C content bin, i.e., at a similar range of G/C content, GRO-seq signals were proportional to R-loop intensities, and, at a similar range of GRO-seq signals, G/C contents were positively linked to R-loop levels (Figure 6C).
In response to DRB treatment, induced GRO-seq signals at TSSs were also positively correlated with the fold induction of R-loops, and, interestingly, the less G/C content was, the higher induction became (Figure 6D). This is likely due to the possibility that promoters with high G/C content are already associated with high R-loop levels before DRB treatment, thus preventing additional RNAPII engagement, which has been recently demonstrated with an in vitro transcription system (Belotserkovskii et al., 2017). To further examine this possibility, we analyzed induced GRO-seq signals upon DRB treatment in relationship to steady-state R-loops and, indeed, observed a global inverse relationship (Figure 6E). After DRB removal, we observed that R-loop decline also positively tracked the reduction of GRO-seq signals at TSSs, and, again, the G/C content was inversely correlated with R-loop resolution, as expected from the contribution of G/C content to R-loop stability (Figure 6F). Combined, these data suggest that, despite the lack of correlation between R-loop levels and transcriptional outputs, there is a general link between R-loop formation and the RNAPII pausing status at TSS regions in a G/C content-dependent manner, although such correlation varies on individual genes.
Requirement for a Free RNA End to Promote R-loop Formation
During our analysis of R-ChIP signals, we curiously noted that the majority of R-ChIP mapped R-loops were each associated with a nearby free RNA end (Figure 7A). This makes sense from topological consideration because a free RNA end would enable efficient RNA invasion into duplexed DNA behind an elongating RNA polymerase (see Discussion). To directly determine the requirement for such free RNA end to promote R-loop formation, we engineered a ribozyme to co-transcriptionally generate a free RNA end within a transcription unit driven by the CMV promoter and terminated by a build-in poly(A) site in the vector (Figure 7B). As a control, we introduced a point mutation in the ribozyme, which compromises both the activity and specificity of the ribozyme as characterized previously (Fong et al., 2009). Because R-loop formation also requires a critical sequence context, we selected an R-loop-promoting G-rich sequence characterized earlier (Zhang et al., 2014) and another R-loop-promoting sequence from one of the endogenous genes (CPSF7) we identified from our R-ChIP mapping data and separately inserted them into the plasmid downstream of the ribozyme to mimic the R-loop prone sequence context.
Figure 7. Requirement of a Free RNA End for Promoting R-loop Formation and Proposed Model for R-loop Initiation and Elongation.
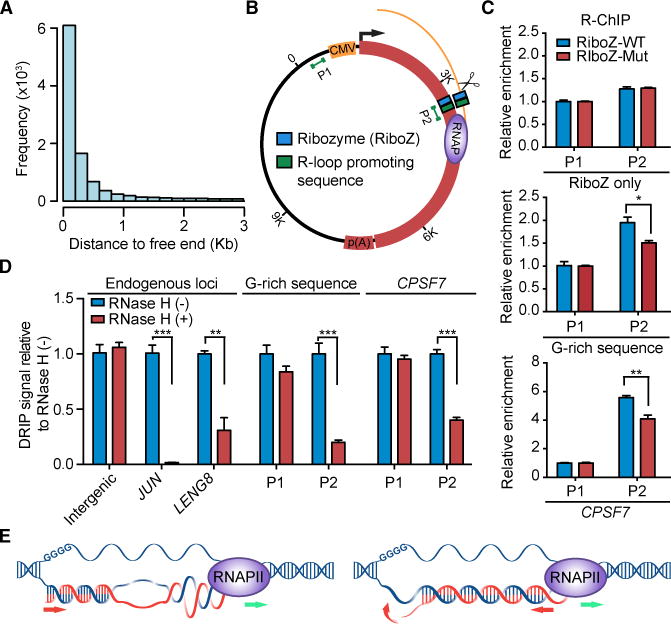
(A) The distance distribution of known free RNA ends relative to R-ChIP mapped R-loops.
(B) The R-loop reporter plasmid: WT or mutant hepatitis d ribozyme with or without a R-loop-promoting sequence were cloned into ~2.6 Kb downstream of the CMV promoter in a pcDNA5-based expression vector carrying part of the luciferase gene fused to the 3′UTR of the FUBP1 gene. Two pairs of primers targeting a promoter upstream region (P1) and the potential R-loop forming region (P2) were used for R-ChIP and DRIP analyses, as indicated.
(C) R-ChIP-qPCR results on RNASEH1/D210N-expressing HEK293T cells transfected with plasmid containing WT or mutant ribozyme without any R-loop-promoting sequence (top), with a G-rich R-loop-promoting sequence (middle), or with a R-loop-promoting sequence from CPSF7 (bottom). Results were calculated as fold enrichment of signals at the P2 region relative to total input and then normalized against control signals from the P1 region. Data are presented as mean ± SEM (n = 4 technical replicates). *p < 0.05; **p < 0.01, unpaired Student’s t test.
(D) DRIP-qPCR analysis on HEK293T cells transfected with plasmid containing WT ribozyme and individual R-loop-promoting sequences. Purified DNA from each sample was mock-treated or treated with RNase H before DRIP. Examined are one intergenic control region and two endogenous R-loop prone gene promoters identified by R-ChIP, as well as P1 and P2 regions on individual transfected plasmids. Results were calculated as relative DRIP-qPCR signals after setting signals from mock-treated samples as 1 and presented as mean ± SEM (n = 4 or 5 technical replicates). **p < 0.01; ***p < 0.001, unpaired Student’s t test. See also Figure S7 for stepwise data processing and normalization against the spike-in control.
(E) Current and revised models for R-loop formation and elongation.
Based on this experimental design, we generated six constructs containing the WT or mutant ribozyme with or without R-loop-promoting sequences. Given that plasmids bearing pro-R-loop features could efficiently produce R-loops in transfected cells, which were directly visible under EM (Duquette et al., 2004), we transfected these constructs into HEK293T cells expressing the catalytically dead RNASEH1 to capture R-loops by R-ChIP followed by real-time PCR analysis of a promoter upstream region (P1, as a negative control) and the predicted R-loop forming region (P2). We found that, without inserting any R-loop-promoting sequence, neither WT nor mutant ribozyme was sufficient to trigger R-loop formation (Figure 7C, upper panel). After inserting the G-rich sequence (Figure 7C, middle panel) or the R-loop-promoting sequence from CPSF7 (Figure 7C, bottom panel), we detected the induced R-loop on both constructs containing the WT ribozyme. The level of R-loops was significantly reduced, but not diminished, with the mutant ribozyme (Figure 7C), likely due to aberrant RNA fragmentation activities of the mutant ribozyme as reported earlier (Fong et al., 2009).
To validate the detected R-loops, we wished to use an entirely independent strategy for R-loop detection. Although DRIP suffers from poor resolution in genome-wide analysis of R-loops, it is suitable for detecting R-loops in specific loci. We therefore transfected the plasmids into HEK293T cells and subjected purified DNA to RNase H treatment followed by IP with the S9.6 antibody. To control for non-specific binding on S9.6 beads, we performed a parallel spike-in experiment with purified DNA from mock-transfected cells mixed with individual plasmids. By first normalizing the total input followed by subtracting the background IP signals (Figure S7), we demonstrated RNase H-sensitive R-loop that was only detectable at the ribozyme inserted region on both plasmid reporters (Figure 7D). These data not only demonstrate the requirement of a free 5′ RNA end for inducing R-loop formation, but also suggest a revised model for R-loop initiation and elongation, as illustrated in Figure 7E (see Discussion).
DISCUSSION
Distinct R-loop Profiles Generated by R-ChIP versus S9.6 Antibody-Based Methods
In the current study, we present R-ChIP based on the use of a catalytically dead RNASEH1. The mapped R-loops show the expected strand specificity and are tightly linked to G/C content and G/C skew, fully agreeing with all biochemical properties established in vitro. With little doubt about the specificity of S9.6, previous antibody-based R-loop mapping methods suffer from poor resolution due to relatively large restriction fragments captured by the antibody. With DRIP-seq, for example, as long as an R-loop is present within a fragment, the entire fragment will contribute to sequenced signals. DRIPc-seq is a major improvement by sequencing-associated RNAs; however, any residual RNA tightly associated with chromatin would contribute to the background. In promoter-proximal regions, because RNAs are predominantly associated with the transcribed side of promoters, the averaged center of RNA-containing genomic fragments likely corresponds to the observed “peak” ~1.5 Kb downstream of TSS, and, as a result, the ensemble peak is misaligned with H3K4me1 and H3K27ac marks (Sanz et al., 2016). Attempts have also been made to improve the resolution of antibody-based methods by sonicating isolated DNA (Nadel et al., 2015), which may damage R-loops, thus compromising the data quality. In contrast, R-ChIP takes full advantage of an RNase H, which is evolved to recognize R-loops in vivo, and by expressing a catalytically dead version of the enzyme, R-ChIP enables R-loop capture by using a standard ChIP-seq protocol, which involves both fixation to stabilize R-loop/RNase H complex and sonication to increase the resolution. However, R-ChIP requires expressing a mutant RNase H in cells, which limits its application in certain biological systems.
Free RNA End to Invade Duplex DNA for R-loop Formation
Besides TSSs, we did not observe prevalent R-loops in 5′ and 3′ splice sites or near poly(A) sites. None of these R-loops were linked to natural RNAPII pausing events based on recent NET-seq experiments (Mayer et al., 2015; Nojima et al., 2015), implying that many R-loops mapped in gene bodies might reflect other activities, such as DNA replication. The infrequent formation of internal R-loops appears due to the lack of nearby free RNA ends, which we demonstrated to be required for de novo R-loop formation in a favorable sequence context. This is actually pertinent to the current model for R-loop initiation and elongation (Roy and Lieber, 2009). As depicted in Figure 7E, R-loop has been thought to initiate at a region containing G clusters in the non-template DNA strand and then elongate in the direction of RNAPII polymerization. Given the fact that RNA/DNA hybrids in R-loops have a plectonemic (helix) rather than a paranemic (parallel) structure in RNASEH1 crystals (Nowotny et al., 2007), this would create a major topological problem because, once anchored at the “initiation” site, every right helical turn established with nascent RNA would also introduce a “left” helical turn incapable of forming continuous base pairs with template DNA (Figure 7E, left panel).
The presence of a nearby free RNA end, such as the 5′ end of transcripts produced at promoter-proximal regions, solves this topological constraint. We thus propose a revised model for R-loop initiation and elongation (Figure 7E, right panel). Newly emerged nascent RNA from an elongating RNA polymerase may be in constant search for available sequences in template DNA to anneal back, but only when encountering a G/C-skewed sequence where the RNA/DNA hybrid would become sufficiently stable and then elongate further upstream until confronting with non-permissive DNA duplex. In this sense, the upstream G cluster originally thought to initiate R-loop formation may actually act to maintain a relative permissive DNA conformation for R-loop elongation.
This revised model is consistent with relatively rare R-loops in gene bodies as well as near poly(A) sites because splicing-related RNA cleavage events are all tightly coupled to exon-lariat or exon-exon ligation within the spliceosome. Similarly, polyade-nylation-produced 3′ RNA end may be occupied by the polyade-nylation machinery, and the exposed 5′ end is quickly degraded by the exonuclease XRN2 (Skourti-Stathaki et al., 2011). Therefore, according to this model, it is conceivable that occasional R-loop may form within gene bodies, either as a result of some splicing mistakes or due to pre-mature transcription termination, both of which may lead to RNA breaks to produce free ends for R-loop formation. It will be of great interest to link those internal R-loops to potential regulatory aspects of gene expression in future studies.
R-loop Formation and Transcriptional Pausing
Transcriptional pause and release at promoter-proximal regions has been recognized to be a highly regulated process in gene expression (Core et al., 2008), but it has been unclear why some genes show more pausing than others, which has been thought to be controlled by gene-specific regulatory mechanisms (Jonkers and Lis, 2015). Our data now suggest that R-loop levels are dependent on G/C content, and, within similar G/C content, TSS-associated R-loops are proportional to GRO-seq signals near gene promoters. Therefore, R-loop formation in conjunction with G/C content may contribute to RNAPII pausing or vice versa.
Our analysis of R-loop formation and resolution dynamics suggests that transcriptionally induced nascent RNA positively correlates with R-loop induction at TSS. Interestingly, the higher the original R-loop level is, the less nascent RNA could be further induced at promoters. This is consistent with the prevention of new RNAPII from entering those promoters (Belotserkovskii et al., 2017). Interestingly, however, we found that R-loop resolution is not a prerequisite for transcriptional pause release, suggesting that R-loop resolution and transcriptional pause release are independently regulated processes in the cell.
STAR★METHODS
Detailed methods are provided in the online version of this paper and include the following:
KEY RESOURCES TABLE
| REAGENT or RESOURCE | SOURCE | IDENTIFIER | |
|---|---|---|---|
| Antibodies | |||
| Rabbit polyclonal anti-V5 | Santa Cruz | sc-83849-R | |
| Mouse monoclonal anti-NONO | Santa Cruz | sc-166702 | |
| Mouse monoclonal anti-β-Actin | Sigma-Aldrich | A2228 | |
| Mouse monoclonal anti-RNAPII | EMD Millipore | 05-623-Z | |
| Mouse monoclonal S9.6 antibody | Kerafast | ENH001 | |
| Chemicals, Peptides, and Recombinant Proteins | |||
| SIGMAFAST Protease Inhibitor Cocktail Tablets | Sigma-Aldrich | S8830-2TAB | |
| Glycogen | Thermo Fisher | FERR0561 | |
| Formaldehyde | Sigma-Aldrich | 252549-100ML | |
| Protein A/G magnetic beads | Thermo Fisher | PI88802 | |
| Proteinase K | NEB | P8107S | |
| RiboLock RNase inhibitor | Thermo Fisher | FEREO0382 | |
| RNase A | Thermo Fisher | EN0531 | |
| Phi29 DNA polymerase | NEB | M0269S | |
| Klenow Fragment (3′–5′ exo-) | NEB | M0212S | |
| T4 DNA ligase | NEB | M0202S | |
| FastStart Universal SYBR Green Master (ROX) 2X | Roche | 4913850001 | |
| 5,6-Dichlorobenzimidazole 1-β-D-ribofuranoside (DRB) | Sigma-Aldrich | D1916-50MG | |
| Br-UTP | Sigma-Aldrich | B7166-5MG | |
| M6101 RQ1 RNase-Free DNase | Promega | M6101 | |
| Antarctic Phosphatase | NEB | M0289S | |
| BrdU antibody conjugated agarose beads | Santa Cruz | sc-32323 AC | |
| T4 Polynucleotide Kinase | NEB | M0201S | |
| E. coli Poly(A) Polymerase | NEB | M0276S | |
| SuperScript III First-Strand Synthesis System | Thermo Fisher | 18080051 | |
| Exonuclease I | NEB | M0293S | |
| Circligase II | Epicentre | CL9021K | |
| APE 1 | NEB | M0282S | |
| Phusion High-Fidelity DNA Polymerase | NEB | M0530S | |
| SYBR Gold Nucleic Acid Gel Stain | Thermo Fisher | S-11494 | |
| HindIII-HF | NEB | R3104S | |
| BsrGI-HF | NEB | R3575S | |
| XbaI | NEB | R0145S | |
| SspI-HF | NEB | R3132S | |
| RNase H | NEB | M0297S | |
| Critical Commercial Assays | |||
| PureLink PCR Micro Kit | Thermo Fisher | K310050 | |
| PureLink Quick Gel Extraction Kit | Thermo Fisher | K210012 | |
| Deposited Data | |||
| Sequencing data of R-ChIP experiments | This study | GEO: GSE97072 | |
| Sequencing data of GRO-seq experiments | This study | GEO: GSE97072 | |
| Experimental Models: Cell Lines | |||
| Human: HEK293T cells | Laboratory of Steve Dowdy | N/A | |
| Human: K562 Cells | ATCC | CCL-243 | |
| Oligonucleotides | |||
| Primers for R-ChIP-qPCR and ChIP-qPCR experiments | This study | See Table S2 | |
| Software and Algorithms | |||
| Bowtie2 | Langmead and Salzberg, 2012 | http://bowtie-bio.sourceforge.net/bowtie2/index.shtml | |
| Samtools | Li et al., 2009 | http://samtools.sourceforge.net/ | |
| Bedtools | Quinlan and Hall, 2010 | http://bedtools.readthedocs.io/en/latest/ | |
| R | N/A | https://www.r-project.org/ | |
| Ngsplot | Shen et al., 2014 | https://github.com/shenlab-sinai/ngsplot | |
| Deeptools | Ramirez et al., 2014 | http://deeptools.readthedocs.io/en/latest/ | |
| Step One Software v2.3 | Thermo Fischer | https://www.thermofisher.com/de/de/home/technicalresources/software-downloads/StepOne-and-StepOnePlus-Real-Time-PCR-System.html |
CONTACT FOR REAGENT AND RESOURCE SHARING
Please direct any requests for further information and resources to the Lead Contact, Xiang-Dong Fu (xdfu@ucsd.edu), Department of Cellular and Molecular Medicine, University of California, San Diego.
EXPERIMENTAL MODEL AND SUBJECT DETAILS
Cell Lines and Cell Culture Conditions
HEK293T cells were from a common laboratory stock (gift of Dr. Steve Dowdy’s lab); K562 cells were purchased from ATCC (ATCC#: CCL-243). HEK293T cells were grown in DMEM supplemented with 10% FBS and 1 × penicillin-streptomycin; K562 cells were cultured in RPMI1640 with 10% FBS, 2 mM sodium pyruvate and 1 × penicillin-streptomycin.
Antibodies
Antibodies recognizing the V5 tag (sc-83849-R, 1:5000 dilution for western blotting, 2.5 μg for R-ChIP) and NONO (sc-166702, 1:3000 dilution for western blotting) were purchased from Santa Cruz Biotechnology; anti-β-Actin (A2228, 1:5000 dilution for western blotting) was from Sigma; anti-RNA polymerase II, clone CTD4H8 (05-623-Z, 5 μg for ChIP) was from Millipore; S9.6 antibody (ENH001) was from Kerafast.
METHOD DETAILS
Plasmid Construction
Human RNASEH1 cDNA with mitochondrial localization signal sequence replaced by the nuclear localization signal sequence was cloned into ppyCAG expression vector (gift from Dr. Juan Calos Izpisua Belmonte’s laboratory). Site-directed mutagenesis was performed to generate both D210N and WKKD (W43A, K59A, K60A and D210N) mutants (Nowotny et al., 2008; Nowotny et al., 2007). The V5 tag sequence was added to the C terminus of RNASEH1 by PCR. To generate stable RNASEH1 overexpressing cell lines, HEK293T and K562 cells were transfected with the ppyCAG-RNASEH1 vector followed by hygromycin selection (100–200 μg/ml) 2 days after transfection. To generate the expression unit containing the hepatitis δ ribozyme plus a R-loop promoting sequence, we used a pcDNA5-based vector carrying part of the luciferase gene fused to the 3′UTR of the FUBP1 gene. WT or mutant (C to T at 60 nt) hepatitis δ ribozyme sequence with or without a R-loop promoting sequence was cloned into the expression unit ~2.6 Kb downstream of the CMV promoter. RT-qPCR was performed to verify the production of the expected transcript.
Immunocytochemistry
Cells cultured on cover glasses were fixed with 4% paraformaldehyde for 20 min followed by permeabilization with 0.1% Triton X-100 in PBS for 20 min, both at 4°C. After washing three times with PBS, cells were incubated with blocking buffer (1% BSA and 1% FBS in PBS) for 1 hr and then with anti-V5 antibody (1:500 dilution) for another 1 hr, both at room temperature. After washing with PBS, 2nd fluorescence-conjugated antibody (Alexa Fluor 488 Goat anti-Rabbit IgG, 1:500 dilution, Thermo Fisher) diluted with blocking buffer was added and incubated for another 1 hr at room temperature. Cells were stained with DAPI for 30 min and mounted onto slides for imaging under an Olympus FV1000 confocal microscope with a 60 × oil objective (NA 1.6).
Immunoprecipitation and Western Blotting
For immunoprecipitation, 5 μg of anti-V5 antibody per sample was conjugated to protein A/G magnetic beads (Thermo Fisher) by incubation with rotation for 1 hr at 4°C. Cells were washed with cold PBS and then lysed in lysis buffer (50 mM Tris pH 8.0, 150 mM NaCl and 1% NP-40) for 30 min on ice. Cell debris was removed by centrifugation at 13000 rpm for 15 min at 4°C. The supernatant was mixed with antibody conjugated beads and incubated for 2 hr at 4°C with rotation. Beads were then washed three times with lysis buffer and boiled for 5 min in SDS loading buffer. The supernatant was collected for western blotting.
Western blotting was performed according to standard protocol. Briefly, proteins were resolved in SDS-PAGE gels and transferred to nitrocellulose membrane. After blocking for 1 hr with 5% non-fat milk in TBST buffer (50 mM Tris-HCl, 150 mM NaCl and 0.05% Tween 20 pH 7.6), the membrane was incubated with primary antibody overnight at 4°C, followed with HRP-conjugated secondary antibody for 1 hr at room temperature. ECL substrate (Thermo Fisher) was then applied to the membrane for imaging by autoradiography.
Strand-specific R-ChIP Library Construction
R-ChIP experiments were performed on cells expressing RNASEH1/D210N or/WKKD mutant protein by using a standard ChIP protocol with modifications (Ji et al., 2013). Briefly, approximately 0.5–1 × 10⁷ cells were crosslinked with 1% formaldehyde for 10–15 min at room temperature. Fixation was stopped by adding Glycine at the final concentration 125 mM and incubation for 15 min at room temperature. After washing plates twice with PBS, cells were scraped off and the nuclei were extracted with cell lysis buffer (10 mM Tris-HCl pH 8.0, 10 mM NaCl, 0.5% NP-40 and 1 X protease inhibitor cocktail), and then suspended in nuclei lysis buffer (50 mM Tris-HCl pH 8.0, 10 mM EDTA, 1% SDS and 1 X protease inhibitor cocktail). Chromatin DNA was sheared to 250–600 bp in size by sonication. 5% chromatin fragment was saved as input and the remaining was incubated with magnetic beads conjugated with anti-V5 antibody overnight at 4°C. Beads were sequentially washed three times with TSEI (20 mM Tris-HCl pH 8.0, 150 mM NaCl, 1% Triton X-100, 0.1% SDS, 2 mM EDTA and 1 X protease inhibitor cocktail), three times with TSEII (20 mM Tris-HCl pH 8.0, 500 mM NaCl, 1% Triton X-100, 0.1% SDS, 2 mM EDTA and 1 X protease inhibitor cocktail), once with TSEIII (10 mM Tris-HCl pH 8.0, 250 mM LiCl, 1% NP-40, 1% Deoxycholate, 1 mM EDTA and 1 X protease inhibitor cocktail) and once with TE buffer (10 mM Tris-HCl pH 8.0 and 1 mM EDTA). The protein-chromatin complex was eluted with elution buffer (10 mM Tris-HCl pH 8.0, 1% SDS and 1 mM EDTA) and decrosslinked by incubation overnight at 65°C. After sequential RNase A and Proteinase K treatment, the precipitated hybrid fragment was cleaned by phenol twice and phenol:chloroform:isoamyl alcohol once, followed by ethanol precipitation. The recovered fragment was either subjected to qPCR or library construction.
To generate strand-specific R-ChIP library for deep sequencing, DNA from precipitated RNA/DNA hybrids was used as the template to generate dsDNA by random priming using a tail-containing N9 primer (5′-/invddt/CAAGCAGAAGACGGCATACGA GNNNNNNNNN-3′). An “A” base was then added to the 3′ end and the adaptor from illumina was ligated only to one end of the resultant dsDNA as the other end contained a 5′ overhang introduced by the N9 primer. After purification, 16–18 cycles of PCR were performed and PCR products in the size range of 130–350 bp were gel-isolated and purified. Deep sequencing was performed on the illumina HiSeq 2500 system according to the manufacturer’s instruction. The sequenced fragments represent the DNA part of the captured R-loop region (Figure 1C).
DRB Treatment and R-ChIP-qPCR
DRB treatment was carried on HEK293T cells. The culture medium was replaced with fresh medium one day before DRB treatment. DRB was directly added to the medium at the final concentration 100 mM and cells were incubated for 2 hr. To wash off DRB, the DRB-containing medium was aspirated; cells were washed with PBS and then cultured in fresh medium. Plates were handled one by one at a 6 min interval to collect cells 6 to 72 min after DRB removal. R-ChIP-qPCR experiments were performed the same way as R-ChIP. qPCR reactions were set up by mixing precipitated DNA with FastStart Universal SYBR Green Master (Roche) and run using the StepOnePlus Real-Time PCR System (Thermo Fisher). All of the primer pairs used for qPCR in this study are listed in Table S1.
R-ChIP Data Analyses
Raw R-ChIP sequence reads were mapped to the human genome (hg19) via default local mode of Bowtie2 (Langmead and Salzberg, 2012), and repeatedly mapped reads, reads with low mapping quality (−q 30) and PCR duplicates were discarded according to Sam-tools (Li et al., 2009). Statistics of R-ChIP libraries were summarized in Table S2. For each replicate, the read coverage over each 3 Kb window of the whole genome was computed for evaluation of reproducibility. Once the high reproducibility was established, reads from individual biological replicates were merged, extended to 150 nt (which corresponds to the average size of gel-isolated DNA fragments), and then separated according to their strand information. We used MACS2 with default settings to call narrow (or broad when necessary) R-loop peaks (Feng et al., 2012). Only confident R-loop peaks with ≥ 5 folds enrichment and with q-value ≤ 0.001 (or 0.0001 for broad peak) over background were kept for subsequent analyses.
GENCODE Version 19 was used for genomic region annotation of mapped R-loop peaks. Specially, the promoter region was defined as −1,000 to +1,000 bp from TSS, and terminal region as −1,000 to +1,000 bp from the poly(A) site, and gene body region as the remaining genic region. If one R-loop peak is overlapped with multiple genomic regions, it will be assigned to promoter or terminal region if its summit is closest to TSS or the poly(A) site, and is within a distance of ≤ 1 Kb, or to gene body if its summit is ≥ 1 Kb from both TSS and poly(A) site. tRNA gene annotation was based on tRNAscan-SE v.1.23 (Lowe and Eddy, 1997). The signal intensity of R-loop peak was quantified as average read coverage over peak region, and corrected with background signal as estimated by input control. To analyze positional sequence features, we first aligned the summit (for narrow peaks) or center (for broad peaks) of all R-loops, and calculated the nucleotide composition and G/C skew (defined as (G−C)/(G+C)) along a 51 bp sliding window, which were averaged among all mapped R-loops.
To study the dynamics of R-loop formation and resolution, we performed R-ChIP sequencing experiments under different DRB treatment conditions [DRB (−), DRB (+) and Post-DRB] and called a unified set of R-loop peaks by merging all of these R-ChIP data. The R-loop induction level after DRB treatment was defined as the net fold change of R-loop signal intensity before [DRB (−)]. Similarly, the R-loop decline level was calculated as the percentage of decreased R-loop signal intensity after DRB removal (Post-DRB) in comparison to [DRB (+)].
GRO-seq Library Construction
Global run-on followed by next-generation sequencing (GRO-seq) was carried out as previously described with a few modifications (Ji et al., 2013). Briefly, confluent HEK293T cells in 10-cm plates were washed three times with cold 1 X PBS and then incubated in swelling buffer (10 mM Tris-HCl pH 7.5, 2 mM MgCl2 and 3 mM CaCl2) for 5 min on ice. Cells were harvested and re-suspended in 1 mL lysis buffer (10 mM Tris-HCl pH 7.5, 2 mM MgCl2, 3 mM CaCl2, 10% Glycerol and 0.5% IGEPAL) with gentle swirling and incubation for 5 min on ice. The volume of cell suspension was brought to 10 mL with the same buffer for nuclei extraction. The resultant nuclei were washed once with 10 mL lysis buffer and re-suspended in 100 μL freezing buffer (40% Glycerol, 5 mM MgCl2, 0.1 mM EDTA and 50 mM Tris-HCl pH 8.3) with gentle pipetting.
For run-on assay, re-suspended nuclei were mixed with the same volume of run-on reaction buffer (10 mM Tris-HCl pH 8.0, 5 mM MgCl2, 300 mM KCl, 1 mM DTT, 200 U/ml RNaseOut, 1% Sarkosyl, 500 μM ATP, 500 μM GTP, 500 μM Br-UTP and 2 μM CTP) and incubated for 5 min at 30°C. The run-on reaction was stopped by adding 750 μL TRIzol LS reagent (Thermo Fisher). RNA was then extracted by acidic phenol/chloroform (pH 4.5, Thermo Fisher), precipitated with ethanol and re-suspended in 20 μL H2O. RNA was next subjected to base hydrolysis by adding 5 μL 1 M NaOH for 5 min on ice and then neutralized by adding 25 μL 1 M Tris-Cl (pH 6.8). Treatments of DNase I (Promega) followed by antarctic phosphatase (NEB) were carried out according to the manufacturer’s instructions. Before immunopurification, RNA was heated to 65°C for 5 min and then kept on ice. Anti-BrdU agarose beads (Santa Cruz, 70 μl/RNA sample) were first equilibrated by washing twice with binding buffer (0.25 X SSPE, 1 mM EDTA, 0.05% Tween 20 and 37.5 mM NaCl) and then incubated in blocking buffer (1 X binding buffer, 0.1% PVP and 1 μg/ml BSA) for 1 hr at 4°C with rotation. After blocking, beads were washed twice with 500 μL binding buffer and mixed with RNAs in binding buffer for 1 hr with rotation at 4°C. After binding, beads were washed once with binding buffer, once with low salt buffer (0.2 X SSPE, 1 mM EDTA and 0.05% Tween 20) and twice with high salt buffer (0.25 X SSPE, 1 mM EDTA, 0.05% Tween 20 and 150 mM NaCl). Finally, BrU-incorporated RNAs were eluted twice with 100 μL elution buffer (20 mM DTT, 150 mM NaCl, 50 mM Tris-HCl pH 7.5, 1 mM EDTA and 0.1% SDS) and combined.
The BrU-RNA was end-repaired by T4 PNK (NEB) and then subjected to poly(A) tailing reaction with poly(A) polymerase (NEB) for 30 min at 37°C. Tailed RNA was reverse transcribed into cDNA by using superscript III (Thermo Fisher) and the GRO-seq RT primer (5′-pAGATCGGAAGAGCGTCGTGTAG;GCAGAAGACGGCATACGAGATTTTTTTTTTTTTTTTTTTTVN-3′), where p indicates 5′ phosphate; ‘;’ indicates the abasic dSpacer furan, and VN indicates degenerate nucleotides. The cDNA products were treated with Exonuclease I (NEB) for 1 hr at 37°C to eliminate excessive primers. RNA was eliminated by adding 2 μL 1 M NaOH and incubation for 20 min at 98°C. The hydrolysis reaction was stopped by adding 2 μL 1 M HCl. The resultant cDNA was resolved in 10% polyacrylamide TBE-urea gel and the fraction in the size range of 100–400 bp was excised and recovered in DNA gel elution buffer (10 mM Tris-HCl pH 8.0, 1 mM EDTA pH 8.0, 0.1% Tween 20 and 300 mM NaCl) for 2 hr at room temperature. The eluted cDNA was precipitated with ethanol for circularization. cDNA was re-suspended in 10 μL reaction buffer [6 μL H2O, 1 μL CircLigase buffer, 2 μL 5 M Betaine, 0.5 μL 50 μM MnCl2 and 0.5 μL CircLigase II (Epicentre)] and circularization was performed according to the manufacturer’s instruction. Circular single-stranded DNA was re-linearized by adding 3.3 μL re-linearization mix [100 mM KCl, 2 mM DTT] and 1.5 μL APE 1 (NEB) and incubation for 1.5 hr at 37°C.
Re-linearized DNA template was amplified by PCR using Phusion High-Fidelity enzyme (NEB), and primers oNTI200 (5′-CAAGCA GAAGACGGCATACGA-3′) and oNTI201 (5′-AATGATACGGCGACCACCGAGATCTACACNNNNNACACTCTTTCCCTACACGACGCTCTTCCGATCT-3′), where NNNNN indicates the index sequence for multiplexing sequencing samples. PCR was performed with an initial denaturation at 98°C, followed by 12 cycles of 10 s denaturation at 98°C, 15 s annealing at 60°C, and 15 s extension at 72°C. The PCR products were resolved in a non-denaturing 10% polyacrylamide TBE gel and libraries in the size range of 130–250 bp were recovered. Deep sequencing was performed on the illumina HiSeq 2500 platform following manufacturer’s instructions.
GRO-seq Data Analyses
Raw GRO-seq reads were mapped to the human genome (hg19) via default local mode of Bowtie2 (Langmead and Salzberg, 2012), and only non-redundant reads (−q 2) were kept with Samtools. Statistics of GRO-seq libraries were summarized in Table S2. The expression level in promoter proximal regions was quantified as RPKM in the region −30 to +300 bp from TSS, while the overall gene expression level was defined as RPKM in the downstream region from +300 bp of TSS to gene end. Active genes were defined as previously reported (Ji et al., 2013).
Public Data Analyses
All public datasets were from previous publications (Chambers et al., 2015; Core et al., 2014; Gao et al., 2012; Liu et al., 2013; Mayer et al., 2015; Nadel et al., 2015; Nojima et al., 2015; Sanz et al., 2016) and ENCODE projects and were summarized in Table S3. To perform direct comparison between R-ChIP and DRIP-seq, we downloaded and mapped K562 DRIP-seq data with the same parameter settings as that for R-ChIP. DRIP-seq mapped R-loop peaks were then identified by default broad peak calling strategy of MACS2. RDIP-seq data from HEK293T cell and DRIPc-seq data from NT2 cells were mapped by Bowtie2. Low quality reads (−q 30) and PCR duplicates were filtered out with Samtools. Specially, only paired-end reads aligned concordantly were kept for RDIP-seq. Peak calling was done according to MACS2 in a strand-specific manner. The genomic region annotation of R-loop peaks detected by RDIP-seq and DRIPc-seq was done as described above for R-ChIP data analysis. H3K27Ac ChIP-seq data were used to define active enhancer regions (Lovén et al., 2013) and the GRO-seq signal intensity over each enhancer region was taken as eRNA expression level. Genes with a distance of ≤ 50 Kb to a specific enhancer were considered as genes regulated by that enhancer (Whyte et al., 2013). The alignability information of tRNA regions was downloaded from CRG Alignability Track of UCSC genome browser. Alignable tRNAs require ≥ 140 nt uniquely alignable read covering tRNA regions. The tRNA expression level was quantified by GRO-seq and expressed tRNAs with RPKM ≥ 10 were used to relate with R-loop formation. All genomic region comparisons, e.g., the positional overlap of G4-structure regions (Chambers et al., 2015) with R-loop regions, were carried out with Bedtools (Quinlan and Hall, 2010). All graphs related to sequencing data analysis were plotted by R (https://www.r-project.org), ngsplot (Shen et al., 2014) and deeptools (Ramírez et al., 2014).
S9.6 Immunoprecipitation (DRIP)
DRIP was performed as previously reported (Ginno et al., 2012; Stork et al., 2016). Briefly, cells digested with 0.5% SDS and proteinase K were subjected to DNA extraction by phenol/chloroform in phase lock tubes, followed by ethanol precipitation. DNA was digested with a combination of restriction enzymes (HindIII, BsrGI, XbaI and SspI) overnight at 37°C. For RNase H treatment, DNA was incubated with RNase H (NEB) overnight at 37°C and purified as described above. For RNA/DNA hybrid immunoprecipi-tation, 4 μg of DNA was incubated with S9.6 antibody in 1 X binding buffer (10 mM NaPO4 pH 7.0, 140 mM NaCl, 0.05% Trixon X-100) overnight at 4°C. DNA-antibody complexes were further incubated with protein A/G magnetic beads (Thermo Fisher) for 2 hr at 4°C. Beads were washed three times with 1 X binding buffer and bound DNA was then eluted with elution buffer (50 mM Tris-HCl pH 8.0, 10 mM EDTA, 0.5% SDS, Proteinase K) for 45 min at 55°C. DNA was recovered as described above. For spike-in experiment, purified DNA from mock-transfected cells were mixed with purified plasmids estimated to be similar to those in total DNA from transfected cells. DRIP was performed in parallel with the spike-in samples.
QUANTIFICATION AND STATISTICAL ANALYSIS
Data are shown as mean ± SEM, or as boxplot with the first and third quartiles as the lower and upper boundaries of the box, with the median as the middle line of the box, and with the furthest observation which is no more than 1.5 times of the interquartile as the end of whisker. The significance of difference between different groups of data is assessed by unpaired Student’s t test, or Wilcoxon test. Whenever p values are coded with asterisks, * stands for p < 0.05; ** for p < 0.01, and *** for p < 0.001. Software used for specific methods are listed in the respective Star Methods section.
All detailed statistical parameters are reported in the Figures and the Figure Legends.
DATA AND SOFTWARE AVAILABILITY
The raw data fastq files and processed BigWig files for sequencing data of R-ChIP and GRO-seq experiments were deposited into NCBI GEO with the accession number GEO: GSE97072. All scripts used in the current study were openly accessible at github (https://github.com/Jia-Yu-Chen).
Supplementary Material
Highlights.
Catalytically dead RNASEH1 captures R-loops in the human genome
Mapped R-loops fulfill all in vitro established biochemical requirements
Elevated RNAPII pausing at TSS allows for increased R-loop formation
A free RNA end is required to initiate the formation of R-loop
Acknowledgments
The authors are grateful to members of the Fu lab for cooperation, reagent sharing, and insightful discussion during the course of this investigation. We thank Dr. Tomoaki Hishida in Dr. Juan Carlos Izpisua Belmonte lab for providing the ppyCAG plasmid. P.T. and Y.Z. were supported by the National Key R&D Program of China (2017YFA0504400). This work was supported by NIH grants (GM049369 and HG004659) to X.D.F. and (DK098808) to both D.-E.Z. and X.-D.F.
Footnotes
SUPPLEMENTAL INFORMATION
Supplemental Information includes seven figures and three tables and can be found with this article online at https://doi.org/10.1016/j.molcel.2017.10.008.
AUTHOR CONTRIBUTIONS
L.C., J.-Y.C., and X.-D.F. conceived and designed the experiments. L.C. performed the majority of the experiments. X.Z., Y.G., P.T., H.Q., D.L., and Y.Z. contributed to cloning of various plasmids, immunocytochemistry, and engineering ribozyme, R.X. contributed to GRO-seq, C.S. contributed to immuno-precipitation, and H.L. contributed to deep sequencing. J.-Y.C. was largely responsible for analysis of genomic data. D.-E.Z. contributed to data interpretation. L.C., J.-Y.C., and X.-D.F. wrote the paper.
References
- Belotserkovskii BP, Soo Shin JH, Hanawalt PC. Strong transcription blockage mediated by R-loop formation within a G-rich homopurine-homopyrimidine sequence localized in the vicinity of the promoter. Nucleic Acids Res. 2017;45:6589–6599. doi: 10.1093/nar/gkx403. [DOI] [PMC free article] [PubMed] [Google Scholar]
- Boguslawski SJ, Smith DE, Michalak MA, Mickelson KE, Yehle CO, Patterson WL, Carrico RJ. Characterization of monoclonal antibody to DNA.RNA and its application to immunodetection of hybrids. J Immunol Methods. 1986;89:123–130. doi: 10.1016/0022-1759(86)90040-2. [DOI] [PubMed] [Google Scholar]
- Bonnet A, Grosso AR, Elkaoutari A, Coleno E, Presle A, Sridhara SC, Janbon G, Geli V, de Almeida SF, Palancade B. Introns protect eukaryotic genomes from transcription-associated genetic instability. Mol Cell. 2017;67:608–621. doi: 10.1016/j.molcel.2017.07.002. [DOI] [PubMed] [Google Scholar]
- Cerritelli SM, Frolova EG, Feng C, Grinberg A, Love PE, Crouch RJ. Failure to produce mitochondrial DNA results in embryonic lethality in Rnaseh1 null mice. Mol Cell. 2003;11:807–815. doi: 10.1016/s1097-2765(03)00088-1. [DOI] [PubMed] [Google Scholar]
- Chambers VS, Marsico G, Boutell JM, Di Antonio M, Smith GP, Balasubramanian S. High-throughput sequencing of DNA G-quadruplex structures in the human genome. Nat Biotechnol. 2015;33:877–881. doi: 10.1038/nbt.3295. [DOI] [PubMed] [Google Scholar]
- Chan YA, Aristizabal MJ, Lu PY, Luo Z, Hamza A, Kobor MS, Stirling PC, Hieter P. Genome-wide profiling of yeast DNA:RNA hybrid prone sites with DRIP-chip. PLoS Genet. 2014;10:e1004288. doi: 10.1371/journal.pgen.1004288. [DOI] [PMC free article] [PubMed] [Google Scholar]
- Chédin F. Nascent connections: R-loops and chromatin patterning. Trends Genet. 2016;32:828–838. doi: 10.1016/j.tig.2016.10.002. [DOI] [PMC free article] [PubMed] [Google Scholar]
- Chen PB, Chen HV, Acharya D, Rando OJ, Fazzio TG. R loops regulate promoter-proximal chromatin architecture and cellular differentiation. Nat Struct Mol Biol. 2015;22:999–1007. doi: 10.1038/nsmb.3122. [DOI] [PMC free article] [PubMed] [Google Scholar]
- Core LJ, Waterfall JJ, Lis JT. Nascent RNA sequencing reveals widespread pausing and divergent initiation at human promoters. Science. 2008;322:1845–1848. doi: 10.1126/science.1162228. [DOI] [PMC free article] [PubMed] [Google Scholar]
- Core LJ, Martins AL, Danko CG, Waters CT, Siepel A, Lis JT. Analysis of nascent RNA identifies a unified architecture of initiation regions at mammalian promoters and enhancers. Nat Genet. 2014;46:1311–1320. doi: 10.1038/ng.3142. [DOI] [PMC free article] [PubMed] [Google Scholar]
- Duquette ML, Handa P, Vincent JA, Taylor AF, Maizels N. Intracellular transcription of G-rich DNAs induces formation of G-loops, novel structures containing G4 DNA. Genes Dev. 2004;18:1618–1629. doi: 10.1101/gad.1200804. [DOI] [PMC free article] [PubMed] [Google Scholar]
- El Hage A, Webb S, Kerr A, Tollervey D. Genome-wide distribution of RNA-DNA hybrids identifies RNase H targets in tRNA genes, retrotransposons and mitochondria. PLoS Genet. 2014;10:e1004716. doi: 10.1371/journal.pgen.1004716. [DOI] [PMC free article] [PubMed] [Google Scholar]
- Feng J, Liu T, Qin B, Zhang Y, Liu XS. Identifying ChIP-seq enrichment using MACS. Nat Protoc. 2012;7:1728–1740. doi: 10.1038/nprot.2012.101. [DOI] [PMC free article] [PubMed] [Google Scholar]
- Fong N, Ohman M, Bentley DL. Fast ribozyme cleavage releases transcripts from RNA polymerase II and aborts co-transcriptional pre-mRNA processing. Nat Struct Mol Biol. 2009;16:916–922. doi: 10.1038/nsmb.1652. [DOI] [PMC free article] [PubMed] [Google Scholar]
- Gao Z, Zhang J, Bonasio R, Strino F, Sawai A, Parisi F, Kluger Y, Reinberg D. PCGF homologs, CBX proteins, and RYBP define functionally distinct PRC1 family complexes. Mol Cell. 2012;45:344–356. doi: 10.1016/j.molcel.2012.01.002. [DOI] [PMC free article] [PubMed] [Google Scholar]
- Ginno PA, Lott PL, Christensen HC, Korf I, Chédin F. R-loop formation is a distinctive characteristic of unmethylated human CpG island promoters. Mol Cell. 2012;45:814–825. doi: 10.1016/j.molcel.2012.01.017. [DOI] [PMC free article] [PubMed] [Google Scholar]
- Ginno PA, Lim YW, Lott PL, Korf I, Chédin F. GC skew at the 5′ and 3′ ends of human genes links R-loop formation to epigenetic regulation and transcription termination. Genome Res. 2013;23:1590–1600. doi: 10.1101/gr.158436.113. [DOI] [PMC free article] [PubMed] [Google Scholar]
- Halász L, Karányi Z, Boros-Oláh B, Kuik-Rózsa T, Sipos É, Nagy É, Mosolygó-L Á, Mázló A, Rajnavölgyi É, Halmos G, Székvölgyi L. RNA-DNA hybrid (R-loop) immunoprecipitation mapping: An analytical workflow to evaluate inherent biases. Genome Res. 2017;27:1063–1073. doi: 10.1101/gr.219394.116. [DOI] [PMC free article] [PubMed] [Google Scholar]
- Hamperl S, Bocek MJ, Saldivar JC, Swigut T, Cimprich KA. Transcription-replication conflict orientation modulates R-loop levels and activates distinct DNA damage responses. Cell. 2017;170:774–786. doi: 10.1016/j.cell.2017.07.043. [DOI] [PMC free article] [PubMed] [Google Scholar]
- Huertas P, Aguilera A. Cotranscriptionally formed DNA:RNA hybrids mediate transcription elongation impairment and transcription-associated recombination. Mol Cell. 2003;12:711–721. doi: 10.1016/j.molcel.2003.08.010. [DOI] [PubMed] [Google Scholar]
- Ji X, Zhou Y, Pandit S, Huang J, Li H, Lin CY, Xiao R, Burge CB, Fu XD. SR proteins collaborate with 7SK and promoter-associated nascent RNA to release paused polymerase. Cell. 2013;153:855–868. doi: 10.1016/j.cell.2013.04.028. [DOI] [PMC free article] [PubMed] [Google Scholar]
- Jonkers I, Lis JT. Getting up to speed with transcription elongation by RNA polymerase II. Nat Rev Mol Cell Biol. 2015;16:167–177. doi: 10.1038/nrm3953. [DOI] [PMC free article] [PubMed] [Google Scholar]
- Langmead B, Salzberg SL. Fast gapped-read alignment with Bowtie 2. Nat Methods. 2012;9:357–359. doi: 10.1038/nmeth.1923. [DOI] [PMC free article] [PubMed] [Google Scholar]
- Li X, Manley JL. Inactivation of the SR protein splicing factor ASF/SF2 results in genomic instability. Cell. 2005;122:365–378. doi: 10.1016/j.cell.2005.06.008. [DOI] [PubMed] [Google Scholar]
- Li H, Handsaker B, Wysoker A, Fennell T, Ruan J, Homer N, Marth G, Abecasis G, Durbin R, 1000 Genome Project Data Processing Subgroup The sequence alignment/map format and SAMtools. Bioinformatics. 2009;25:2078–2079. doi: 10.1093/bioinformatics/btp352. [DOI] [PMC free article] [PubMed] [Google Scholar]
- Liu W, Ma Q, Wong K, Li W, Ohgi K, Zhang J, Aggarwal A, Rosenfeld MG. Brd4 and JMJD6-associated anti-pause enhancers in regulation of transcriptional pause release. Cell. 2013;155:1581–1595. doi: 10.1016/j.cell.2013.10.056. [DOI] [PMC free article] [PubMed] [Google Scholar]
- Lovén J, Hoke HA, Lin CY, Lau A, Orlando DA, Vakoc CR, Bradner JE, Lee TI, Young RA. Selective inhibition of tumor oncogenes by disruption of super-enhancers. Cell. 2013;153:320–334. doi: 10.1016/j.cell.2013.03.036. [DOI] [PMC free article] [PubMed] [Google Scholar]
- Lowe TM, Eddy SR. tRNAscan-SE: A program for improved detection of transfer RNA genes in genomic sequence. Nucleic Acids Res. 1997;25:955–964. doi: 10.1093/nar/25.5.955. [DOI] [PMC free article] [PubMed] [Google Scholar]
- Mayer A, di Iulio J, Maleri S, Eser U, Vierstra J, Reynolds A, Sandstrom R, Stamatoyannopoulos JA, Churchman LS. Native elongating transcript sequencing reveals human transcriptional activity at nucleotide resolution. Cell. 2015;161:541–554. doi: 10.1016/j.cell.2015.03.010. [DOI] [PMC free article] [PubMed] [Google Scholar]
- Nadel J, Athanasiadou R, Lemetre C, Wijetunga NA, Ó Broin P, Sato H, Zhang Z, Jeddeloh J, Montagna C, Golden A, et al. RNA:DNAhybrids in the human genome have distinctive nucleotide characteristics, chromatin composition, and transcriptional relationships. Epigenetics Chromatin. 2015;8:46. doi: 10.1186/s13072-015-0040-6. [DOI] [PMC free article] [PubMed] [Google Scholar]
- Nojima T, Gomes T, Grosso ARF, Kimura H, Dye MJ, Dhir S, Carmo-Fonseca M, Proudfoot NJ. Mammalian NET-seq reveals genome-wide nascent transcription coupled to RNA processing. Cell. 2015;161:526–540. doi: 10.1016/j.cell.2015.03.027. [DOI] [PMC free article] [PubMed] [Google Scholar]
- Nowotny M, Gaidamakov SA, Ghirlando R, Cerritelli SM, Crouch RJ, Yang W. Structure of human RNase H1 complexed with an RNA/DNA hybrid: Insight into HIV reverse transcription. Mol Cell. 2007;28:264–276. doi: 10.1016/j.molcel.2007.08.015. [DOI] [PubMed] [Google Scholar]
- Nowotny M, Cerritelli SM, Ghirlando R, Gaidamakov SA, Crouch RJ, Yang W. Specific recognition of RNA/DNA hybrid and enhancement of human RNase H1 activity by HBD. EMBO J. 2008;27:1172–1181. doi: 10.1038/emboj.2008.44. [DOI] [PMC free article] [PubMed] [Google Scholar]
- Powell WT, Coulson RL, Gonzales ML, Crary FK, Wong SS, Adams S, Ach RA, Tsang P, Yamada NA, Yasui DH, et al. R-loop formation at Snord116 mediates topotecan inhibition of Ube3a-antisense and allele-specific chromatin decondensation. Proc Natl Acad Sci USA. 2013;110:13938–13943. doi: 10.1073/pnas.1305426110. [DOI] [PMC free article] [PubMed] [Google Scholar]
- Quinlan AR, Hall IM. BEDTools: A flexible suite of utilities for comparing genomic features. Bioinformatics. 2010;26:841–842. doi: 10.1093/bioinformatics/btq033. [DOI] [PMC free article] [PubMed] [Google Scholar]
- Ramírez F, Dündar F, Diehl S, Grüning BA, Manke T. deepTools: A flexible platform for exploring deep-sequencing data. Nucleic Acids Res. 2014;42:W187–W191. doi: 10.1093/nar/gku365. [DOI] [PMC free article] [PubMed] [Google Scholar]
- Roy D, Lieber MR. G clustering is important for the initiation of transcription-induced R-loops in vitro, whereas high G density without clustering is sufficient thereafter. Mol Cell Biol. 2009;29:3124–3133. doi: 10.1128/MCB.00139-09. [DOI] [PMC free article] [PubMed] [Google Scholar]
- Roy D, Yu K, Lieber MR. Mechanism of R-loop formation at immunoglobulin class switch sequences. Mol Cell Biol. 2008;28:50–60. doi: 10.1128/MCB.01251-07. [DOI] [PMC free article] [PubMed] [Google Scholar]
- Santos-Pereira JM, Aguilera A. R loops: New modulators of genome dynamics and function. Nat Rev Genet. 2015;16:583–597. doi: 10.1038/nrg3961. [DOI] [PubMed] [Google Scholar]
- Sanz LA, Hartono SR, Lim YW, Steyaert S, Rajpurkar A, Ginno PA, Xu X, Chédin F. Prevalent, dynamic, and conserved R-loop structures associate with specific epigenomic signatures in mammals. Mol Cell. 2016;63:167–178. doi: 10.1016/j.molcel.2016.05.032. [DOI] [PMC free article] [PubMed] [Google Scholar]
- Shen L, Shao N, Liu X, Nestler E. ngs.plot: Quick mining and visualization of next-generation sequencing data by integrating genomic databases. BMC Genomics. 2014;15:284. doi: 10.1186/1471-2164-15-284. [DOI] [PMC free article] [PubMed] [Google Scholar]
- Skourti-Stathaki K, Proudfoot NJ. A double-edged sword: R loops as threats to genome integrity and powerful regulators of gene expression. Genes Dev. 2014;28:1384–1396. doi: 10.1101/gad.242990.114. [DOI] [PMC free article] [PubMed] [Google Scholar]
- Skourti-Stathaki K, Proudfoot NJ, Gromak N. Human senataxin resolves RNA/DNA hybrids formed at transcriptional pause sites to promote Xrn2-dependent termination. Mol Cell. 2011;42:794–805. doi: 10.1016/j.molcel.2011.04.026. [DOI] [PMC free article] [PubMed] [Google Scholar]
- Skourti-Stathaki K, Kamieniarz-Gdula K, Proudfoot NJ. R-loops induce repressive chromatin marks over mammalian gene terminators. Nature. 2014;516:436–439. doi: 10.1038/nature13787. [DOI] [PMC free article] [PubMed] [Google Scholar]
- Stork CT, Bocek M, Crossley MP, Sollier J, Sanz LA, Chédin F, Swigut T, Cimprich KA. Co-transcriptional R-loops are the main cause of estrogen-induced DNA damage. eLife. 2016;5 doi: 10.7554/eLife.17548. Published online August 23, 2016. https://doi.org/10.7554/eLife.17548. [DOI] [PMC free article] [PubMed] [Google Scholar]
- Sugimoto N, Nakano S, Katoh M, Matsumura A, Nakamuta H, Ohmichi T, Yoneyama M, Sasaki M. Thermodynamic parameters to predict stability of RNA/DNA hybrid duplexes. Biochemistry. 1995;34:11211–11216. doi: 10.1021/bi00035a029. [DOI] [PubMed] [Google Scholar]
- Tresini M, Warmerdam DO, Kolovos P, Snijder L, Vrouwe MG, Demmers JA, van IJcken WF, Grosveld FG, Medema RH, Hoeijmakers JH, et al. The core spliceosome as target and effector of non-canonical ATM signalling. Nature. 2015;523:53–58. doi: 10.1038/nature14512. [DOI] [PMC free article] [PubMed] [Google Scholar]
- Tuduri S, Crabbé L, Conti C, Tourrière H, Holtgreve-Grez H, Jauch A, Pantesco V, De Vos J, Thomas A, Theillet C, et al. Topoisomerase I suppresses genomic instability by preventing interference between replication and transcription. Nat Cell Biol. 2009;11:1315–1324. doi: 10.1038/ncb1984. [DOI] [PMC free article] [PubMed] [Google Scholar]
- Wahba L, Costantino L, Tan FJ, Zimmer A, Koshland D. S1-DRIP-seq identifies high expression and polyA tracts as major contributors to R-loop formation. Genes Dev. 2016;30:1327–1338. doi: 10.1101/gad.280834.116. [DOI] [PMC free article] [PubMed] [Google Scholar]
- Whyte WA, Orlando DA, Hnisz D, Abraham BJ, Lin CY, Kagey MH, Rahl PB, Lee TI, Young RA. Master transcription factors and mediator establish super-enhancers at key cell identity genes. Cell. 2013;153:307–319. doi: 10.1016/j.cell.2013.03.035. [DOI] [PMC free article] [PubMed] [Google Scholar]
- Xu W, Xu H, Li K, Fan Y, Liu Y, Yang X, Sun Q. The R-loop is a common chromatin feature of the Arabidopsis genome. Nat Plants. 2017 doi: 10.1038/s41477-017-0004-x. Published online August 28, 2017. https://doi.org/10.1038/s41477-017-0004-x. [DOI] [PubMed]
- Yu K, Chedin F, Hsieh CL, Wilson TE, Lieber MR. R-loops at immunoglobulin class switch regions in the chromosomes of stimulated B cells. Nat Immunol. 2003;4:442–451. doi: 10.1038/ni919. [DOI] [PubMed] [Google Scholar]
- Zhang ZZ, Pannunzio NR, Hsieh CL, Yu K, Lieber MR. The role of G-density in switch region repeats for immunoglobulin class switch recombination. Nucleic Acids Res. 2014;42:13186–13193. doi: 10.1093/nar/gku1100. [DOI] [PMC free article] [PubMed] [Google Scholar]
Associated Data
This section collects any data citations, data availability statements, or supplementary materials included in this article.