

SUMMARY
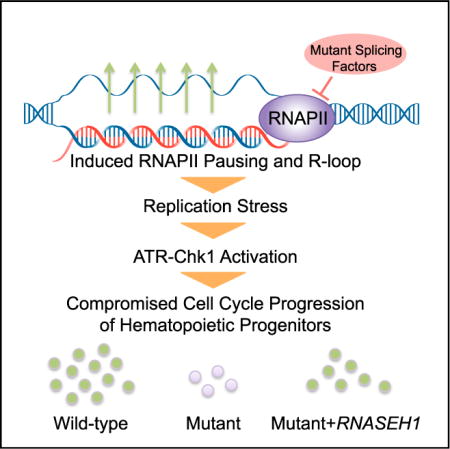
Mutations in several general pre-mRNA splicing factors have been linked to myelodysplastic syndromes (MDSs) and solid tumors. These mutations have generally been assumed to cause disease by the resultant splicing defects, but different mutations appear to induce distinct splicing defects, raising the possibility that an alternative common mechanism is involved. Here we report a chain of events triggered by multiple splicing factor mutations, especially high-risk alleles in SRSF2 and U2AF1, including elevated R-loops, replication stress, and activation of the ataxia telangiectasia and Rad3-related protein (ATR)-Chk1 pathway. We further demonstrate that enhanced R-loops, opposite to the expectation from gained RNA binding with mutant SRSF2, result from impaired transcription pause release because the mutant protein loses its ability to extract the RNA polymerase II (Pol II) C-terminal domain (CTD) kinase—the positive transcription elongation factor complex (P-TEFb)—from the 7SK complex. Enhanced R-loops are linked to compromised proliferation of bone-marrow-derived blood progenitors, which can be partially rescued by RNase H overexpression, suggesting a direct contribution of augmented R-loops to the MDS phenotype.
Graphical abstract
In Brief: Chen et al. report that myelodysplastic syndrome-associated mutations in splicing factors, including SRSF2 and U2AF1, cause cell growth defects through elevated R-loops, replication stress, and ATR-Chk1 activation. Mutant SRSF2 induces transcription pausing and, thus, R-loops, possibly because of its compromised ability in extracting p-TEFb from the 7SK complex at TSSs.
INTRODUCTION
Recent advances in genomic medicine reveal a striking linkage of mutations in multiple general splicing factors (i.e., SF3B1, SRSF2, U2AF1, U2AF2, and ZRSR2) to myelodysplastic syndromes (MDSs), a pre-leukemia state characterized by inefficient hematopoiesis with the propensity to progress to acute myeloid leukemia (AML) (Dvinge et al., 2016; Pellagatti and Boultwood, 2017; Yoshida et al., 2011). Genetic studies provide strong evidence for several prevalent mutations as driver events in early myeloid progenitor cells. For example, Srsf2(P95H) knockin mice exhibit multi-lineage dysplasia (Kim et al., 2015; Kon et al., 2017), transgenic U2af1(S34F) mice develop leukopenia (Shirai et al., 2015), and Sf3b1(K700E) knockin mice have impaired erythroid maturation (Obeng et al., 2016). Importantly, these splicing factor mutations are not restricted to MDS; they have also been identified in various solid tumors, such as melanoma (Furney et al., 2013; Harbour et al., 2013; Martin et al., 2013) and bladder (Papaemmanuil et al., 2011), pancreatic (Biankin et al., 2012), and lung (Imielinski et al., 2012) cancer. It is also striking to note that all mutations identified to date are heterozygous and that mutations in different splicing factors are mutually exclusive in MDS patients (Dvinge et al., 2016), which is consistent with the synthetic lethality between different splicing mutants in a murine model (Lee et al., 2016a) and the requirement for a wild-type (WT) copy to support their basic cellular functions (Fei et al., 2016; Lee et al., 2016b; Zhou et al., 2015).
Because all affected splicing factors are involved in 3′ splice site recognition, it has been hypothesized that some commonly affected splicing events may underlie the disease (Dvinge et al., 2016; Yoshida et al., 2011). Indeed, each major splicing factor mutation has been demonstrated to alter a large number of splicing events in cellular and animal models (Kim et al., 2015; Komeno et al., 2015; Kon et al., 2017; Obeng et al., 2016; Shirai et al., 2015; Wang et al., 2016). In particular, disease development has been functionally linked to the inclusion of a “toxic” exon in the Ezh2 gene in Srsf2(P95H) knockin mice (Kim et al., 2015) and a polyadenylation switch event in the autophagy gene Atg7 caused by U2af1(S34F) overexpression on a murine pro-B cell model (Park et al., 2016). Puzzling, however, is the observation that each splicing factor mutation appears to cause a rather unique set of splicing changes in both cellular models and patients (Ilagan et al., 2015; Kim et al., 2015; Qiu et al., 2016; Shirai et al., 2015). Even the same mutation, such as that in SF3B1, induced largely non-overlapping splicing changes in mouse versus human cells (Mupo et al., 2017). These findings raise the possibility that a unifying mechanism in addition to or independent of splicing changes might contribute to MDS etiology.
One such common mechanism might be related to increased genome instability in MDS (Zhou et al., 2013), which is consistent with elevated DNA damage observed in Srsf2-depleted cells (Xiao et al., 2007), in cells overexpressing U2af1(S34F) (Shirai et al., 2015), in patient cells carrying various mutations in SF3B1 (Te Raa et al., 2015), and in cells associated with telomere dysfunction (Colla et al., 2015). A recent large-scale survey of MDS patients reveals a measurable increase in both mutation frequency and diversity during MDS progression to AML (Makishima et al., 2017). However, because leukemia in general has the lowest mutation rate among all human cancers (Martincorena and Campbell, 2015), what would limit massive somatic mutations during the progression of hematopoietic malignancies? Furthermore, although mutations in splicing factors are mutually exclusive among MDS patients, nearly all major splicing factor mutations exhibit a degree of propensity to co-evolve with mutations in genes that function at chromatin levels, such as ASXL1, IDH1/2, RUNX1, DNMT3A, and TET2 (Makishima et al., 2017). This begs the question of how mutations in splicing factors might synergize with other defects caused by mutations in these pleiotropic genes in MDS pathology.
In the present study, we set out to address some of these pressing questions regarding MDS-linked mutations in splicing factors, paying particular attention to the potential existence of alternative common mechanism(s) for MDS. We here report that multiple high-risk mutations in splicing factors, particularly those in SRSF2 and U2AF1, augment the formation of R-loops resulting from invasion of nascent RNA into template DNA, which triggers exclusive activation of the ataxia telangiectasia and Rad3-related protein (ATR) pathway. Importantly, we demonstrate that R-loop suppression by overexpressing RNase H was able to partially but significantly correct the proliferation defect of hematopoietic progenitors. These findings suggest that MDS may result, at least in part, from chronic insult to the genome.
RESULTS
Cellular Responses to Causal Splicing Factor Mutations
To uncover a potential unified disease mechanism underlying splicing factor mutation-induced MDS, we explored a rapid replacement strategy by expressing individual WT or mutant disease genes from a doxycycline (Dox)-inducible promoter, each of which also carried a short hairpin RNA (shRNA) targeting the corresponding endogenous transcript at the 3′ UTR (Figure 1A). This reductionist approach would enable rapid recording of the mutation-induced phenotype and elucidation of critical molecular events in a common model cell line (i.e., HEK293T cells), which could then be extended to a more blood disease-related cell type (i.e., MDS-derived MDS-L cells) and, ultimately, to hematopoietic progenitor cells from heterozygous knockin mice. In this work, we chose to systematically examine all mutations identified in SRSF2, U2AF1 (also known as U2AF35), and U2AF2 (also known as U2AF65). SF3B1 was not included in the current analysis because of uncertain kinetics in replacing this relatively stable U2 small nuclear ribonucleoprotein particle (snRNP) component with mutant protein in transfected cells. Additionally, contrary to mutations in other splicing factors, SF3B1 mutations appear to associate with a distinct form of MDS that shows good prognosis of the disease, indicative of (a) different mechanism(s) involved (Dvinge et al., 2016). qRT-PCR confirmed efficient knockdown of each endogenous transcript by using a specific primer set to target the 3′ UTR and, concurrently, modest (2- to 3-fold) overexpression of exogenous SRSF2 and U2AF35 and significant (6- to 8-fold) overexpression of exogenous U2AF65 by using specific primer sets to interrogate their coding exons (Figure S1A). Taking advantage of a hemagglutinin (HA) tag fused to the C terminus of SRSF2, we further confirmed the induction of exogenous SRSF2 protein by western blotting with an anti-HA antibody (Figure S1B). In the case of U2AF35, we detected similar protein levels before and after Dox-induced replacement (Figure S1C), and, in contrast, exogenous U2AF65 was clearly overexpressed (Figure S1D).
Figure 1. Phenotypic Analysis and Splicing Profiling of Splicing Factor Mutations.
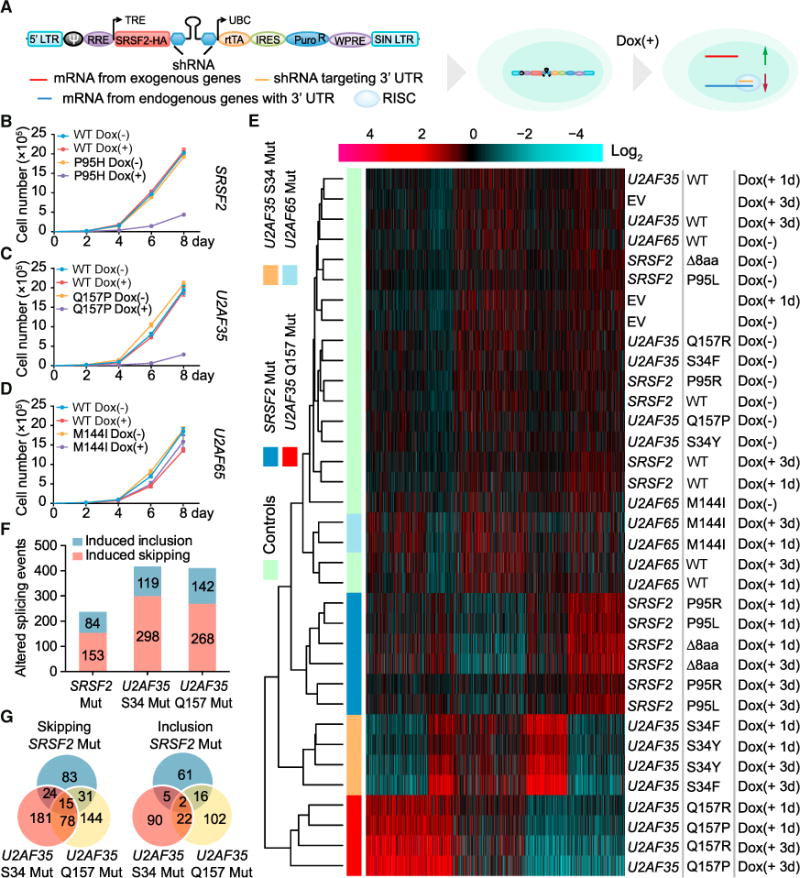
(A) Schematic of the strategy to express exogenous WT or mutant splicing factors and concomitantly knock down the corresponding endogenous transcripts. Each pTRIPZ expression unit contains the protein coding region of a WT or mutant splicing factor gene (SRSF2-HA is used as an example), followed by an shRNA to target the 3′ UTR of the corresponding endogenous transcript. Stable cells were first selected, and the expression of each expression unit was induced by addition of doxycycline (Dox) to culture medium.
(B–D) Proliferation of HEK293T cells following different days of Dox-induced expression of WT or mutant SRSF2(P95H) (B, n = 3 biological replicates), U2AF35(Q157P) (C, n = 3 biological replicates), and U2AF65(M144I) (D, n = 4 biological replicates).
(E) Clustering analysis of the splicing responses profiled by RNA annealing selection ligation followed by deep sequencing (RASL-seq). The log2 ratio of the short versus long isoform for each splicing event was calculated and used for k-means clustering. Red, induced exon skipping events; blue, induced exon inclusion events. Individual constructs and treatment conditions are indicated on the right. D8aa, mutant SRSF2 depleted of amino acids 95 to 102.
(F) The numbers of significantly induced skipping and inclusion splicing events identified by RASL-seq (>1.5-fold and p < 0.05 by unpaired Student’s t test) in mutant cells relative to their WT counterparts.
(G) Venn diagrams of shared and unique splicing events induced in cells expressing different SRSF2 and U2AF35 mutants.
See also Figure S1 for additional analyses of mutation-induced cellular phenotypes and Figures S2A–S2C for the validation of RASL-seq data by RT-PCR.
Time-course Dox induction showed that the expression of individual SRSF2 and U2AF35 mutants, but not their WT counterparts, all caused retarded cell growth on HEK293T cells (Figures 1B and 1C; Figures S1E and S1F). In contrast, despite dramatic overexpression, we detected no measurable effect with either WT or mutant U2AF65 (Figure 1D for M144I; data not shown for R18W and L187V). Corroborating the cell growth phenotype, we detected induced G2/M arrest (Figures S1G and S1H) and a marginal increase in apoptotic signals based on Annexin V staining (Figures S1I and S1J) in cells expressing mutant SRSF2 and U2AF35. None of these cellular responses were apparent in cells expressing mutant U2AF65 (Figures S1K and S1L). We made essentially the same set of observations with the SRSF2(P95H) mutant in MDS-L cells and in primary mouse embryonic fibroblasts (MEFs) (Figures S1M and S1N), indicating that the cellular responses are cell type independent. Together, these data suggest that that all mutations identified in SRSF2 and U2AF35 are likely causal to MDS, whereas those in U2AF65 appear to be neutral to the disease.
Gene-Specific and Allele-Specific Splicing Responses
Taking advantage of all mutations in the same cellular background, we first revisited an important problem with respect to diverse splicing responses induced by different splicing factor mutations (Ilagan et al., 2015; Qiu et al., 2016). We extracted total RNA from individual cell lines and used highly quantitative RNA annealing selection ligation followed by deep sequencing (RASL-seq), which we developed in the lab, to measure a large number (>5,000) of annotated alternative splicing events in humans (Li et al., 2012). We observed, by hierarchical clustering analysis, that all mutations in SRSF2 and U2AF35 induced large-scale changes in alternative splicing upon Dox induction (Figure 1E). Remarkably, even two separate mutant alleles in U2AF35 invoked completely different sets of splicing changes, as reported earlier (Ilagan et al., 2015). We further confirmed these data on a subset of genes by RT-PCR (Figures S2A–S2C). Consistent with the lack of a growth phenotype, the M144I mutation in U2AF65 did not induce significant changes in alternative splicing even under overexpression conditions (Figure 1E). Mutations in both SRSF2 and U2AF35 predominately induced exon skipping (Figure 1F). Importantly, a comparison of the recorded splicing changes showed little overlap between different splicing factor mutations based on induced exon inclusion or skipping events (Figure 1G), demonstrating both gene-specific (SRSF2 versus U2AF35) and allele-specific (between the two alleles in U2AF35) splicing responses to the likely causal mutations in SRSF2 and U2AF35 in our unified cellular system.
Mutation-Induced Insult to the Genome
Having recapitulated the MDS-associated cellular phenotype but non-uniform changes in alternative splicing, we pursued a potential general mechanism beyond splicing control. In light of documented damage to the genome in response to Srsf2 knockout or U2af35(S34F) overexpression (Shirai et al., 2015; Xiao et al., 2007), we asked whether all causal mutations also insulted the genome by immunostaining cells, each carrying a specific mutation with a pan-DNA damage marker, histone-H2AX phosphorylation on serine 139 (γ-H2AX). Indeed, HEK293T cells expressing representative mutations in SRSF2 and U2AF35 all showed elevated γ-H2AX signals upon Dox induction, whereas their WT counterparts lacked such an effect based on quantified results (Figures 2A–2D).
Figure 2. DNA Damage Response and Activation of the ATR Pathway by Mutant Splicing Factors.

(A and B) γ-H2AX foci detected by immunocytochemistry in HEK293T cells upon induced expression of WT or mutant SRSF2(P95H and D8aa) (A) and U2AF35(S34F and Q157P) (B) by Dox for 3 days. Red, γ-H2AX; blue, DAPI. Scale bar, 10 μm.
(C and D) Quantitative analyses of γ-H2AX foci for cells with WT or mutant SRSF2 (C), and WT or mutant U2AF35 (D). More than 100 cells per treatment condition per cell type were analyzed. Statistical significance was determined by one-way ANOVA test. *p < 0.05; **p < 0.01.
(E) Top: schematic of the DNA fiber assay. HEK293T cells treated with Dox for 3 days were sequentially labeled with IdU and CIdU for 20 min each. Bottom: representative DNA fibers fluorescently labeled with IdU (red) and CIdU (green).
(F) Length distribution of DNA fiber tracks in HEK293T cells expressing WT or mutant SRSF2 and U2AF35. The relative lengths of IdU-and CIdU-labeled elongating DNA fiber tracts (n > 100) were scored for each dataset. The p values were calculated by unpaired Student’s t test.
(G and H) Western blot analysis of γ-H2AX and phospho-Chk1(S345) levels in HEK293T cells upon induction of SRSF2(WT, P95H, and D8aa) (G) or U2AF35(WT, S34F, and Q157P) (H) by Dox for different days.
(I and J) Western blot analysis of cells with mutant SRSF2 (I) and U2AF35 (J) for phospho-ATM(S1981), phospho-Chk2(T68), and phospho-RPA32(S4/S8) levels.
See also Figures S2D and S2E for additional western blotting analyses of HEK293 and MDS-L cells and Figures S2F and S2G for immunostaining and quantitative analysis of phospho-ATM and phospho-Chk2.
The induced G2/M arrest (Figures S1G and S1H) suggested that such an insult might cause DNA replication stress upon cell entrance into S phase. To directly test this possibility, we performed a DNA fiber assay (Maréchal et al., 2014) to monitor the progression of replication forks, during which replicating DNA was transiently labeled with 5-Iodo-2′-deoxyuridine (IdU) (red) and then with 5-Chloro-2′-deoxyuridine (CIdU) (green) (Figure 2E, top). As shown in a representative image, Dox-induced expression of mutant SRSF2(P95H) caused a marked reduction in replicative DNA fiber length (Figure 2E, bottom). Quantitative analysis showed that mutations in SRSF2 and U2AF35, but not their WT counterparts, all imposed DNA replication stress (Figure 2F). These data pointed to a converging cellular response to disease-causing mutations in specific splicing factors.
Selective Activation of the ATR-Chk1 Pathway
DNA damage-coupled replication stress frequently leads to genome instability, which is a common event in human cancers (Gaillard et al., 2015). However, massive DNA damage often induces double-stranded DNA (dsDNA) breaks (DSBs), leading to increased somatic mutations, but leukemia in general has the lowest mutation rate compared with solid tumors (Martincorena and Campbell, 2015). To investigate this conundrum, we characterized key molecular events commonly linked to induced DNA damage; i.e., the activation of the ataxia telangiectasia mutated (ATM) and ATR pathways, which are triggered, respectively, by DSBs and replication stress after cells enter S phase (Cimprich and Cortez, 2008; Gaillard et al., 2015). Indeed, in line with elevated γ-H2AX staining, Dox-induced expression of mutant SRSF2 and U2AF35, but not their WT counterparts or U2AF65(M144I), each progressively induced Chk1 phosphorylation at Ser345, a hallmark for activation of the ATR pathway (Figures 2G and 2H; Figure S2D). We made similar observations in MDS-L cells (Figure S2E).
Interestingly, the ATM pathway was not activated under these conditions, as evidenced by the lack of ATM phosphorylation at Ser1981, Chk2 phosphorylation at Thr68, and RPA32 phosphorylation at Ser4/8 (Figures 2I and 2J). We further confirmed the lack of activation of the ATM pathway by immunostaining for phosphorylated ATM and Chk2 using H2O2-treated cells as a positive control for the assay (Figures S2F and S2G). These findings suggest that SRSF2 and U2AF35 mutants insulted the genome but did not reach a level that causes evident DSBs, which also explains visible cell cycle arrest (Figures S1G and S1H), but limited cell death on SRSF2 and U2AF35 mutant cells (Figures S1I and S1J), similar to the general cellular phenotype associated with MDS.
Augmented R-Loop Underlying Persistent Insult to the Genome
What would be the molecular mechanism to account for such a seemly chronic insult to the genome by causal splicing factor mutations? DNA damage often results from excessive R-loop formation (Sollier and Cimprich, 2015), which has been reported in Srsf1- and Srsf2-ablated cells (Li and Manley, 2005; Xiao et al., 2007) and linked to certain core splicing factors (Tresini et al., 2015). However, it has been demonstrated, in the case of SRSF2, that the mutation caused a gain of function in binding to CCNG motifs (Kim et al., 2015; Zhang et al., 2015). Because increased RNA binding is thought to inhibit R-loops by preventing nascent RNA from annealing back to template DNA (Aguilera and García-Muse, 2012), such a gain-of-RNA binding mutation in SRSF2 would be expected to repress, rather than enhance, R-loops.
To investigate this puzzle, we took advantage of a strategy recently developed in our lab (called R-ChIP, illustrated in Figure 3A) to map R-loops genome-wide by using the catalytically inactive RNase H1, which dramatically increases the resolution relative to that achieved with the existing strategies based on the use of the S9.6 antibody to recognize RNA:DNA hybrids (Chen et al., 2017; Ginno et al., 2012). In HEK293T cells, R-ChIP captured R-loops with the expected strand specificity that predominantly occurred at gene promoters containing highly G/C-skewed sequences, as characterized earlier (Figure S3A; Chen et al., 2017; Ginno et al., 2012, 2013). Because Dox induced both the mRNA and protein of exogenous genes at 5 hr (Figures S3B and S3C), we chose this early time point to apply R-ChIP to cells carrying SRSF2(P95H), U2AF35 (Q157P), and U2AF35(S34F) mutations to minimize potential indirect effects (Figure S3D). High global concordance demonstrated the reproducibility of duplicated R-ChIP libraries generated under individual experimental conditions (Figure S3E).
Figure 3. R-Loops Induced by Mutant Splicing Factors.
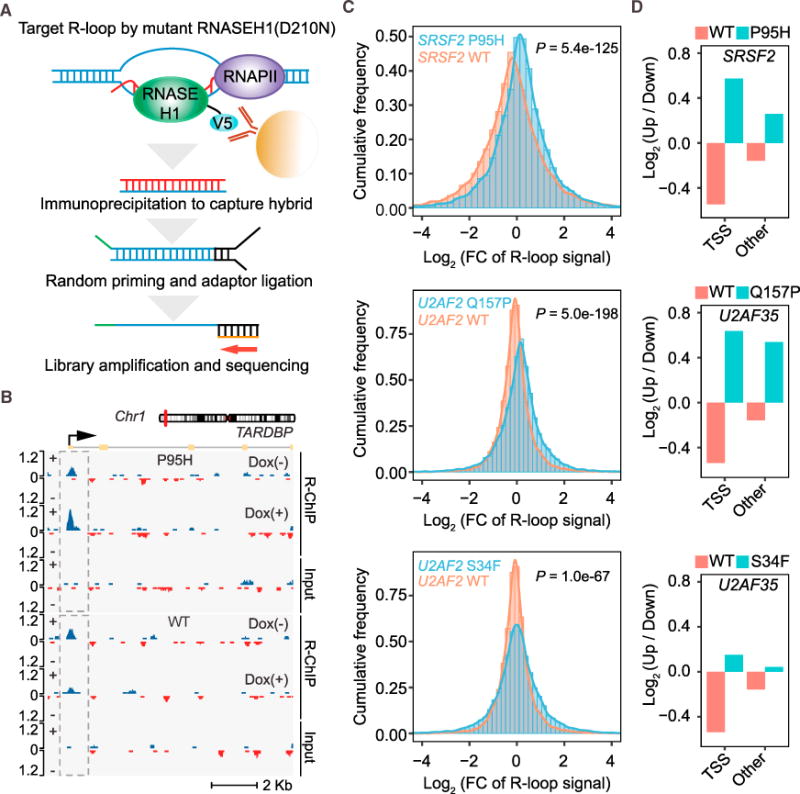
(A) Schematic of the R-loop profiling method (R-ChIP) by expressing a catalytically dead RNase H followed by standard ChIP sequencing.
(B) R-loop enrichment and dynamic change at the TSS region of a representative gene in HEK293T cells expressing WT SRSF2 (bottom) or mutant SRSF2(P95H) (top) after Dox treatment for 5 hr.
(C) Fold changes (FCs) of R-loop intensity (Dox(+)/Dox(−)) in HEK293T cells expressing WT or mutant SRSF2(P95H) (top), U2AF35(Q157P) (center), and U2AF35(S34F) (bottom), presented by histograms. The p values for all pairwise comparisons were determined by Wilcoxon test.
(D) Ratio of up- and downregulated R-loops in promoter versus non-promoter regions in HEK293T cells expressing WT or mutant SRSF2(P95H), U2AF35(Q157P), and U2AF35(S34F).
See also Figure S3 for additional analyses of R-ChIP data and Figure S4 for R-loop levels in WT and mutant cells in relation to splice sites and sequence motifs for RNA binding.
As illustrated by specific gene examples (Figure 3B; Figure S3F) and by plotting the histograms of fold changes (FCs) in R-loop signals before and after Dox treatment genome-wide (Figure 3C, top), we found that overexpression of WT SRSF2 suppressed R-loops but its mutant enhanced R-loops instead of further suppressing them, as it might be expected from its gained RNA binding activity. We made similar observations with WT and mutant U2AF35 (Figure 3C, center and bottom). Note that the S34F allele was relatively weak but still significant in R-loop induction, which is in concordance with a recent report based on immunostaining of R-loops with the S9.6 antibody in cells expressing U2AF35(S34F) (Nguyen et al., 2017). Importantly, the induction of R-loops in mutant cells took place ahead of an evident DNA damage response and Chk1 activation (Figure S3G), consistent with the fact that excessive R-loops trigger DNA damage when cells enter S phase (Stork et al., 2016), providing a plausible functional link between induced R-loops and observed replication stress and activation of the ATR pathway.
Regional Specific Effects of Individual Splicing Factor Mutations in Augmenting R-Loops
To further characterize genomic loci that may be differentially influenced by different splicing factor mutations, we next determined the net gain or loss of R-loops in promoter versus non-promoter regions. We found that, although both WT SRSF2 and U2AF35 suppressed R-loops in general, SRSF2(P95H) predominantly enhanced R-loops at transcription start sites (TSSs) (Figure 3D, top). Interestingly, U2AF35(Q157P) enhanced R-loops in both promoter and non-promoter regions, and U2AF35(S34F) had a similar but much weaker effect (Figure 3D, center and bottom). A comparison of induced R-loops in three mutant cells showed limited overlap (Figure S3H), suggesting that different mutations may preferentially induce R-loops in different sets of genes. Alternatively, such a limited overlap might be due to the highly dynamic nature of R-loop formation and resolution (Chen et al., 2017), of which we were only able to capture a snapshot in each profiling experiment.
Somewhat unexpected, however, was that only a small fraction (~10%) of altered R-loops (either suppressed or enhanced by each mutant) was detected within the gene body and that an even smaller number (0.6%–0.9% of the total) of such altered R-loops were associated with splice sites (Figures S4A and S4B), suggesting that R-loops are not in general linked to pre-mRNA splicing. Of note, R-loops were not significantly altered near induced splicing events detected with RASL-seq (Figure S4C), suggesting that induced R-loops were not a functional consequence of altered splicing in mutant cells. Although it remains unclear how mutant U2AF35 augmented R-loops in various locations in the genome, mutant SRSF2 has been previously shown to alter RNA binding preference (i.e., enhanced binding on CCNG motifs but unaltered binding on GGNG motifs) (Kim et al., 2015; Zhang et al., 2015). We therefore further examined SRSF2(P95H)-induced R-loops in relationship with their association with CCNG versus GGNG motifs. We segregated R-loops into four groups according to different CCNG or GGNG contents within each R-loop region and analyzed the distribution of R-loop FCs in cells expressing WT or mutant SRSF2(P95H). Intriguingly, although WT SRSF2 caused progressive suppression of R-loops according to increasing CCNG and GGNG contents, mutant SRSF2(P95H) showed the opposite trend, but we did not see any major difference between CCNG and GGNG groups (Figure S4D). These results re-enforce the idea that the altered RNA binding preference of the mutant SRSF2 is insufficient to account for the induction of R-loops.
Elevated R-Loop Linked to an Increased Pol II Traveling Ratio at TSSs
We previously showed that SRSF2 has a splicing-independent role in transcription pause release by mediating translocation of the C-terminal domain (CTD) kinase—the positive transcription elongation factor complex (P-TEFb)—from the 7SK complex to nascent RNA-associated RNA polymerase II (Pol II) complex (Ji et al., 2013). To determine whether SRSF2(P95H) might affect transcription, we performed global run-on followed by deep sequencing (GRO-seq) upon induction of WT or mutant SRSF2. For comparison, we also analyzed the WT and U2AF35(Q157P and S34F). Duplicated GRO-seq libraries showed high reproducibility with each construct (Figure S5A). As exemplified by three representative genes, SRSF2(P95H)-induced R-loops (or lack thereof) that generally tracked induced Pol II pausing (Figure 4A), which was also evident from global analysis, showed an increase in the Pol II traveling ratio (TR; the averaged Pol II density at −30 to +300 TSS regions divided by that in the gene body) (Figure 4B) and coordinated changes in both TRs and R-loops (Figure 4C; Figure S5B). We made a similar observation with U2AF35(Q157P) but detected little difference with U2AF35(S34F) (Figure S5C), consistent with its relatively weak effects in R-loop induction (Figure 3D, bottom). Thus, this observation also implies a role of the U2AF heterodimer at gene promoters, as suggested earlier (Sims et al., 2007), although we currently have few clues regarding how U2AF might modulate transcription, which requires investigation in the future.
Figure 4. R-Loop Formation and Transcriptional Repression Induced by Mutant SRSF2.
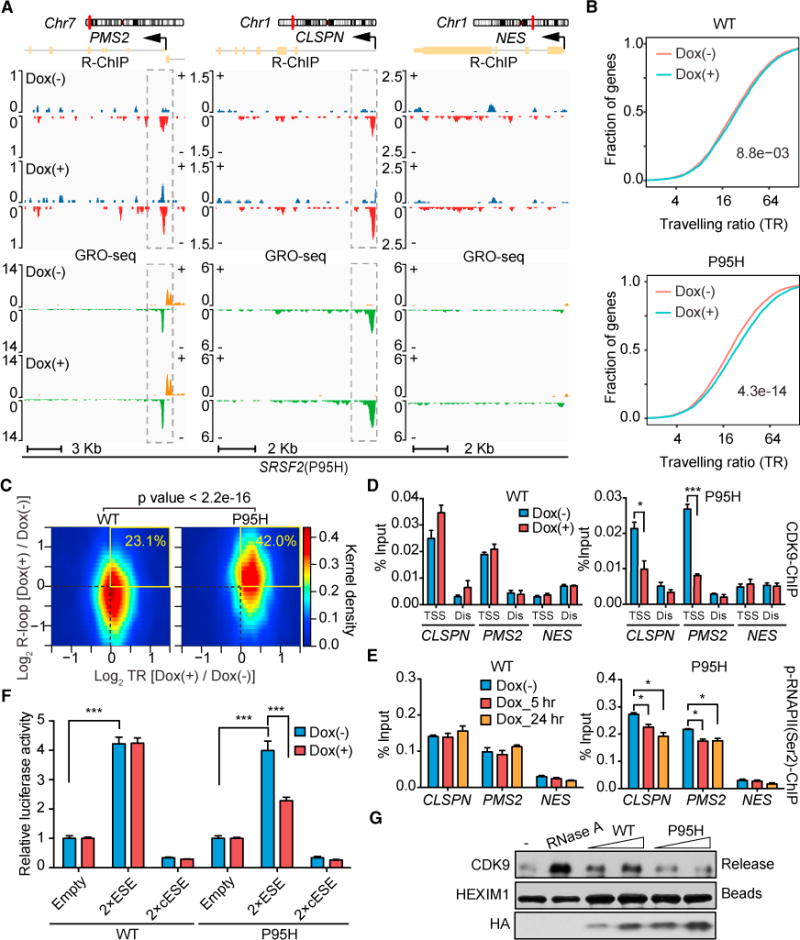
(A) R-loop levels profiled by R-ChIP and nascent RNA production (indicative of corresponding transcriptionally engaged Pol II) by GRO-seq on two representative positive genes (PMS2 and CLSPN) and one negative gene (NES) in mutant SRSF2(P95H) HEK293T cells with or without Dox treatment for 5 hr.
(B) Changes in traveling ratio (TR) based on metagene analysis of the GRO-seq datasets (gene length > 1,000, n = 19,300) upon induction of WT or mutant SRSF2(P95H). The p values were calculated by two-sided Kolmogorov-Smirnov test as indicated.
(C) Heatmaps of changes in TSS-associated R-loops (y axis) and TR (x axis) for individual genes in HEK293T cells expressing WT or mutant SRSF2(P95H). The numbers in the top right quarter of each graph indicate the percentages of positively correlated events. The p value was calculated by Fisher’s exact test.
(D and E) ChIP-qPCR analysis of CDK9 (D) and Pol II Ser2 phosphorylation (E) on the promoter of representative genes (PMS2, CLSPN, and NES) as shown in (A) upon induced expression of WT or mutant SRSF2(P95H). A distal region (Dis) was analyzed in parallel in each case as a control for CDK9 ChIP-qPCR. Data are presented as mean ± SEM (n = 3 technical replicates). Statistical significance was determined by unpaired Student’s t test. *p < 0.05; ***p < 0.001.
(F) Dual luciferase assays using pCMV (internal control) and HSV-ESE reporters on HEK293T cells upon induced expression of WT or SRSF2(P95H) by Dox treatment. Data are presented as mean ± SEM (n = 6 biological replicates). ***p < 0.001 based on unpaired Student’s t test.
(G) The P-TEFb extraction assay. The anti-HEXIM1-immunoprecipitated 7SK complex was incubated with affinity-purified WT or mutant SRSF2(P95H) protein, followed by detection of released CDK9 from the 7SK complex by western blotting. RNase A treatment provided a positive control, HEXIM1 remaining on beads served as a loading control, and the relative amounts of purified proteins tested were detected by western blotting using anti-HA and are shown at the bottom. See also Figure S5 for additional data regarding the transcriptional response to mutant SRSF2 and U2AF35.
To determine whether mutant SRSF2 compromises P-TEFb translocation from the 7SK complex to transcriptionally engaged Pol II at TSSs, we performed chromatin immunoprecipitation (ChIP)-qPCR analysis of CDK9, the kinase component of P-TEFb, at the TSS region of the same genes analyzed by R-ChIP and GRO-seq (Figure 4A) and detected reduced CDK9 binding only in cells expressing the mutant (Figure 4D). In line with reduced CDK9 binding, we also detected reduced Pol II CTD phosphorylation at Ser2 positions (Figure 4E) and, consequently, reduced expression of these gene transcripts at least 3 days after Dox treatment (Figure S5D). To corroborate these results, we performed a reporter-based transcription activation assay, as described previously (Ji et al., 2013). In this assay, the herpes simplex virus (HSV) promoter was used to drive the expression of either an empty luciferase reporter or the reporters carrying either two copies of an SRSF2-responsive exonic splicing enhancer (ESE) or the complementary sequence of such an ESE (cESE) as a control (Figure S5E). We found that WT SRSF2 was able to significantly enhance transcription of this reporter system in an ESE-dependent manner and that the mutant protein partially lost such function (Figure 4F), revealing a potential functional defect of the mutant at the level of transcription.
Lost Ability of the Mutant SRSF2 to Extract P-TEFb from the 7SK Complex
We previously reported that the function of SRSF2 in transcription activation is due to its ability to “extract” P-TEFb from the inhibitory 7SK complex assembled near TSS regions (Ji et al., 2013). Similarly, the RNA helicase DDX21 has been shown to extract P-TEFb from the 7SK complex with purified protein (Calo et al., 2015). These findings suggest that various soluble factors are involved in releasing P-TEFb from the 7SK complex to modulate Pol II pause release at TSSs. To determine whether WT and mutant SRSF2 have differential ability in extracting P-TEFb from the 7SK complex, we immunoprecipitated the endogenous 7SK complex from HEK293T cells with an antibody against HEXIM1, a constitutive component of the complex, and then incubated the isolated complex with increasing amounts of HA-tagged WT or mutant SRSF2 proteins affinity-purified from HEK293T cells. We found that WT SRSF2 was able to efficiently release CDK9 from the 7SK complex as expected but that the mutant protein lost such activity (Figure 4G; Figure S5F). Coupled with the increased Pol II TR from global analysis and a compromised ability to activate transcription from the reporter-based assay, these data strongly suggest that impaired transcription pause release at TSSs accounts for the effect of mutant SRSF2 in enhancing the formation of R-loops.
Suppression of R-Loops to “Rescue” Splicing Factor Mutation-Induced Cellular Defects
Having elucidated the functional consequences caused by mutant splicing factors and the plausible underlying mechanism, we next addressed whether the observed cellular defects result, at least in part, from induced R-loops. We further engineered HEK293T cells to constitutively express RNASEH1 (Figure S6A) to resolve R-loops and found that it indeed partially rescued the cell growth defect caused by SRSF2(P95H) (Figure 5A) and U2AF35 (Q157P and Q157R) (Figure 5B; Figure S6B). We did not observe significant repression of the growth defect caused by mutant U2AF35 (S34F and S34Y) (Figures S6C and S6D), reminiscent of their weak effects on R-loop induction (Figure 3D, bottom). Corroborating R-loop suppression, we also detected reduced γ-H2AX foci (Figures 5C and 5D) and suppression of the ATR pathway (Figures 5E and 5F) in response to RNASEH1 overexpression in SRSF2(P95H)- and U2AF35(Q157P)-expressing cells.
Figure 5. Rescue of Functional Defects on Cellular Models by RNASEH1 Overexpression.
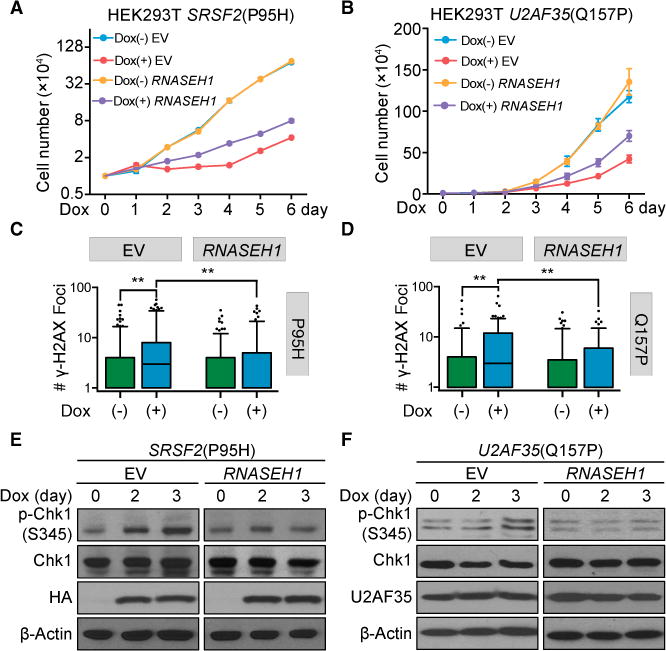
(A and B) Proliferation of HEK293T cells stably expressing RNASEH1 with or without induced expression of SRSF2(P95H) (A, n = 3 biological replicates) or U2AF35(Q157P) (B, n = 4 biological replicates) upon Dox treatment for different days. Cells expressing empty vector (EV) served as a control.
(C and D) Quantitative analysis of γ-H2AX foci detected by immunocytochemistry in HEK293T cells expressing RNASEH1 before and after induced expression of SRSF2(P95H) (C) or U2AF35(Q157P) (D) by Dox treatment for 3 days. More than 100 cells per Dox treatment condition per cell type were analyzed, and p values were calculated by one-way ANOVA test.
(E and F) Suppression of Chk1 activation by overexpressed RNASEH1 in HEK293T cells upon induced expression of SRSF2(P95H) (E) or U2AF35 (Q157P) (F) by Dox for different days.
See also Figure S6A for RNASEH1 overexpression by western blotting analysis and Figures S6B–S6D for cell proliferation of additional mutant cells with or without RNASEH1 overexpression.
Biological Relevance of Induced R-Loops to Blood Disorders
We finally wished to link R-loop induction to blood disorders to provide the biological significance of the molecular mechanisms elucidated in both standard (i.e., HEK293T) and more MDS-relevant (i.e., MDS-L) cellular models. We first showed suppression of both cell growth defects (Figure 6A) and γ-H2AX signals (Figure 6B) in SRSF2(P95H) mutant MDS-L cells by overexpressing RNASEH1. These data demonstrated that RNASEH1 overexpression suppressed all key aspects of DNA damage-associated events induced by SRSF2(P95H) and U2AF35(Q157P), although it is abundantly clear that induced R-loops may not be the only cause for the observed cellular defects.
Figure 6. Functional Rescue of Mutant SRSF2-Induced Defects in Hematopoietic Systems by RNASEH1 Overexpression.
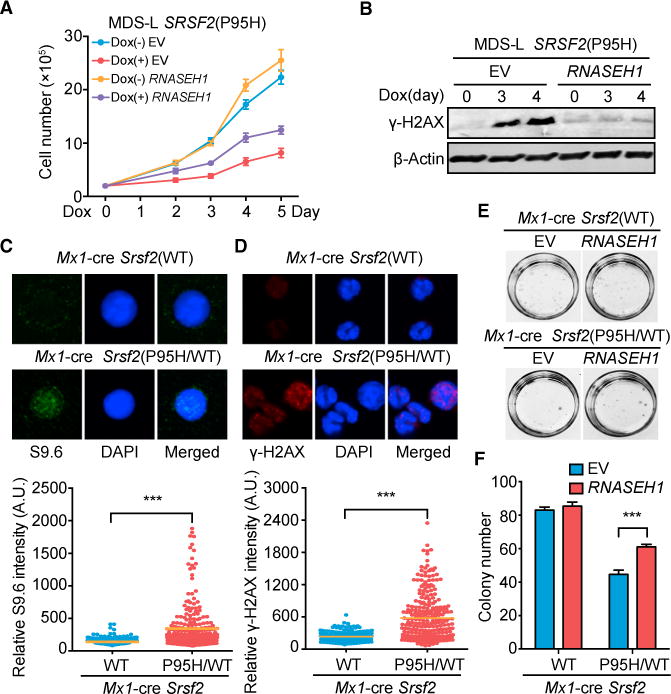
(A) Proliferation of MDS-L cells expressing empty vector or RNASEH1 with or without induced expression of SRSF2(P95H) by Dox treatment for different days (n = 4 biological replicates).
(B) Western blot analysis of γ-H2AX levels in SRSF2(P95H) MDS-L cells expressing EV or RNASEH1 as in (A).
(C and D) R-loop signals detected by immunostaining with S9.6 (C) and DNA damage response detected by immunostaining for γ-H2AX (D), both in isolated c-Kit+ progenitor cells from Srsf2(WT) or heterozygous Srsf2(P95H/WT) knockin mice 14 days after poly(I:C) injection. The quantitative data at the bottom were based on 3 mice from each (WT or mutant) group. ***p < 0.001 based on unpaired Student t test for more than 100 cells analyzed.
(E and F) Representative photographs showing colonies (E) and quantification of colony numbers (F) of c-Kit+ progenitor cells isolated from Srsf2(WT) or Srsf2(P95H/WT) mice 14 days after overexpression of EV or RNASEH1. All data are presented as mean ± SEM (6 plates of Srsf2(WT) cells and 8 plates of Srsf2(P95H/WT) cells).
***p < 0.001 by unpaired Student’s t test.
See also Figure S6E for RNASEH1 overexpression in these cells and Figure S6F for the quantified data from the second repeat of the replating assay.
We next examined the induction of R-loops and associated functional consequences in more disease-related cells that carry a heterozygous MDS-associated mutation. To achieve this, we took advantage of the existing heterozygous Mx1-Cre Srsf2(P95H) knockin mice, which have been demonstrated to recapitulate the MDS phenotype (Kim et al., 2015; Lee et al., 2016b), and induced expression of the knockin mutant allele following intraperitoneal injection of polyinosinic:polyctidylic acid (poly(I:C)). Using isolated early blood progenitor cells (c-Kit+) from the bone marrow of these mice, we confirmed elevated R-loops by immunostaining with the S9.6 antibody (Figure 6C) and increased DNA damage response by γ-H2AX staining (Figure 6D). We then infected the isolated cells with a retrovirus expressing V5-tagged RNASEH1 (Figure S6E) and performed a replating assay to evaluate the hematopoietic competence of early progenitor cells. Consistent with a previous report (Kim et al., 2015), mutant Srsf2(P95H) impaired the proliferation of isolated early progenitor cells (Figures 6E and 6F). Importantly, RNASEH1 overexpression, although it had no effect on WT cells, partially rescued the proliferation defect of these Srsf2(P95H) mutant progenitor cells (Figures 6E and 6F; Figure S6F). These findings re-enforce the idea that augmented R-loops may directly contribute to compromised hematopoietic competence in MDS induced by various high-risk mutations in splicing factors.
DISCUSSION
Is MDS a Disease of Splicing or Transcription or Both?
MDS is a highly heterogeneous disease that causes dysplasia of hematopoietic progenitor cells, implying that multiple mechanisms may underlie the disease etiology and/or progression. A major advance in recent years is the identification of prevalent mutations in several “general” splicing factors, leading to research focusing on altered splicing induced by individual splicing factor mutations as potential causes for the disease. Indeed, it has been shown that the inclusion of a toxic exon in the Ezh2 transcript in SRSF2(P95H) knockin mice causes down-regulation of the EZH2 protein via nonsense-mediated mRNA decay, and overexpression of EZH2 was able to restore the proliferative potential of hematopoietic progenitors (Kim et al., 2015). However, each splicing factor mutation appears to affect a largely distinct set of splicing, as we now further confirmed in the same cellular background, raising the question of whether and how multiple independent splicing changes all cause a similar disease phenotype.
Our current work reveals that mutations in splicing factors may contribute to MDS via induced R-loop formation. Importantly, mutations in SRSF2 and U2AF35 induce R-loops at gene promoters, which is functionally linked to defects in transcriptional pause release. We further show that the mutant SRSF2 causes such an effect, at least in part, because of its lost ability to extract CDK9 from the 7SK complex. However, it remains unclear how U2AF35 directly participates in transcription control. We also show that mutations in U2AF35 have additional effects by inducing R-loops across the genome, but, unexpectedly, we did not observe any link of induced R-loops within the gene body to splice sites either in general or associated with altered splicing events we detected. Thus, the precise mechanism(s) for U2AF35 mutation-induced events in both promoter and non-promoter regions remain(s) elusive. In any case, given the elucidated roles of both SRSF2 and U2AF35 in transcription, it is also worth noting that EZH2 is a well-established transcription factor and that TET2, a key enzyme involved in DNA demethylation (Hasegawa et al., 2017), may modify the chromatin to affect transcription. This has led to the speculation that MDS may be a disease of both splicing and transcription and that multiple mechanisms may cooperate with one another to account for complex biological consequences (Cimmino et al., 2017; Dvinge et al., 2016).
Why Do Splicing Factor Mutations Predominantly Cause MDS?
Mutations in a number of general splicing factors are prevalently identified in MDS, a pre-leukemic state, which begs the question of such selective tissue-specificity. It is possible that those heterozygous mutations cause mild functional defects that may be vulnerable only to hematopoietic stem cells but not sufficiently transformative unless combined with other cell oncogenic events (Park et al., 2016). This may account for the contribution of certain splicing factor mutations to the development of certain solid tumors.
Our data suggest a more general mechanism for compromised hematopoietic competence, which is the activation of the ATR pathway that leads to cell cycle arrest, which echoes the observation that the ATR pathway is selectively activated in high-risk MDS patients and that the ATR inhibitor, but not the ATM inhibitor, improves the differentiation of telomere dysfunctional common myeloid progenitor cells (Colla et al., 2015). Therefore, although various observations have pointed to the association of genome instability with MDS (Colla et al., 2015; Makishima et al., 2017; Nguyen et al., 2017; Zhou et al., 2013), our data unveil a potential mechanism for increased but limited genome instability because of augmented R-loop formation. The activation of the ATR, but not ATM, pathway may explain the dysplastic phenotype with increased but still limited elevation of somatic mutations in MDS patients. Interestingly, we observed impaired transcription of two genes, CLSPN and PMS2, both of which have been implicated in DNA damage repair (Chen et al., 2005; Chini and Chen, 2004), suggesting that additional synergistic events may contribute to the induced DNA damage. In any case, the preferred activation of the ATR pathway by splicing factor mutation is in contrast to many cases in solid tumors where more severe genome instability because of DSBs leads to the activation of both the ATR and ATM pathways, which may accelerate the accumulation of additional oncogenic mutations (Awasthi et al., 2015; Cimprich and Cortez, 2008).
Potential Synergy between Mutations in Different Genes
It has been well established that mutations in splicing factors, especially those in SRSF2, U2AF35, and SF3B1, are mutually exclusive in MDS patients (Dvinge et al., 2016; Makishima et al., 2017; Pellagatti and Boultwood, 2017). Given distinct splicing responses, this has brought up the appealing hypothesis that these mutations may affect distinct molecular defects, but in some converging biological pathways, as we recently observed via analysis of splicing signatures in MDS patients (Qiu et al., 2016), which is in line with the synergistic effects of mutations in SRSF2 and SF3B1 in the mouse (Lee et al., 2016a). We now provide another potential converging mechanism, which is the induction of R-loops. Such converging mechanisms might create synergy when two causal mutations co-exist in the same cell, giving rise to mounting stress to the genome and, thus, a more severe disease phenotype.
Despite the exclusivity of mutations in essential splicing factors, other mutations are known to co-exist in MDS patients that likely represent various synergistic events. For example, mutations in the de novo DNA methyltransferase gene DNMT3, which frequently co-exist with splicing factor mutations, may reflect its role in causing cryptic transcription because of failed DNA methylation (Neri et al., 2017). This may enhance R-loops in various genic and intragenic regions in the genome in collaboration with mutations in splicing factors. Interestingly, multiple mutations in genes involved in the DNA demethylation pathway have also been found to co-evolve with splicing factor mutations, such as those in TET2 and IDH1/2 (Makishima et al., 2017). These mutations may cause transcriptional repression because of increased DNA methylation in promoter-associated CpG islands (Hasegawa et al., 2017), synergizing with mutations in splicing factors to exacerbate transcription.
Last but not least, because a significant fraction (~30%) of MDS patients ultimately transit to highly proliferative AML, what might be the molecular basis for such a transition? Despite increased mutations, it is less likely that the transition to AML results from the accumulation of a large number of somatic oncogenic mutations that commonly occur in solid tumors. Instead, altered transcription and splicing programs may initially compromise cell fitness in general, generating constant pressure for affected cells to develop and accumulate compensatory changes that may ultimately become oncogenic. In this regard, augmented R-loop formation may represent a form of such selection pressure in diseased cells. To compensate for the activation of a cell cycle checkpoint, MDS cells may evolve various mechanisms to overcome such a checkpoint to become proliferative, which may not be necessarily accomplished through the acquisition of new mutations in the genome. This points to a future effort in identifying genes whose altered expression may bypass R-loop-induced checkpoints.
STAR★METHODS
Detailed methods are provided in the online version of this paper and include the following:
KEY RESOURCES TABLE
| REAGENT or RESOURCE | SOURCE | IDENTIFIER |
|---|---|---|
| Antibodies | ||
| Mouse monoclonal anti-HA | Thermo Fisher | 26183, RRID: AB_10978021 |
| Rabbit polyclonal anti-U2AF35 | Bethyl | A302-079A, RRID: AB_1604295 |
| Mouse monoclonal anti-U2AF65 | Sigma-Aldrich | U4758, RRID: AB_262122 |
| Mouse monoclonal anti-β-Actin | Sigma-Aldrich | A2228, RRID: AB_476697 |
| Mouse monoclonal anti-γ-H2AX | EMD Millipore | 05-636, RRID: AB_309864 |
| Rabbit polyclonal anti-H2AX | Bethyl | A300-083A, RRID: AB_203289 |
| Rabbit polyclonal anti-phospho-Chk1 (Ser345) | Cell Signaling | 2348, RRID: AB_331212 |
| Rabbit polyclonal anti-Chk1 | Bethyl | A300-298A, RRID: AB_309459 |
| Mouse monoclonal anti-phospho-ATM (Ser1981) | Rockland | 200-301-400, RRID: AB_217868 |
| Rabbit polyclonal anti-ATM | Bethyl | A300-299A, RRID: AB_263415 |
| Rabbit polyclonal anti-phospho-Chk2 (Thr68) | Cell Signaling | 2661, RRID: AB_331479 |
| Rabbit polyclonal anti-Chk2 | Bethyl | A300-620A, RRID: AB_513590 |
| Rabbit polyclonal anti-phospho-RPA32 (Ser4/Ser8) | Bethyl | A300-245A, RRID: AB_210547 |
| Rabbit polyclonal anti-RPA32 | Bethyl | A300-244A, RRID: AB_185548 |
| Rabbit polyclonal anti-V5 | Santa Cruz | sc-83849-R, RRID: AB_2019669 |
| Rabbit polyclonal anti-CDK9 | Cell Signaling | 2316, RRID: AB_2291505 |
| Mouse monoclonal anti-BrdU | BD | BDB555627 |
| Rat monoclonal anti-BrdU | Thermo Fisher | MA1-82718, RRID: AB_927213 |
| Rabbit polyclonal anti-HEXIM1 (for IP) | Bethyl | A303-111A, RRID: AB_10893099 |
| Rabbit polyclonal anti-HEXIM1 (for WB) | Bethyl | A303-113A, RRID: AB_10892626 |
| Rabbit polyclonal anti-phospho-RNA polymerase II CTD repeat (Ser2) | Abcam | ab5095, RRID: AB_304749 |
| Mouse monoclonal S9.6 antibody | Kerafast | ENH001, RRID: AB_2687463 |
| Chemicals, Peptides, and Recombinant Proteins | ||
| SIGMAFAST Protease Inhibitor Cocktail Tablet | Sigma-Aldrich | S8830-2TAB |
| Glycogen | Thermo Fisher | FERR0561 |
| Formaldehyde | Sigma-Aldrich | 252549-100ML |
| Pierce Anti-HA Magnetic Beads | Thermo Fisher | 88836 |
| Protein A/G Magnetic Beads | Thermo Fisher | PI88802 |
| Proteinase K | NEB | P8107S |
| RiboLock RNase Inhibitor | Thermo Fisher | FEREO0382 |
| RNase A | Thermo Fisher | EN0531 |
| Phi29 DNA Polymerase | NEB | M0269S |
| Klenow Fragment (3′-5′ exo-) | NEB | M0212S |
| T4 DNA Ligase | NEB | M0202S |
| FastStart Universal SYBR Green Master (Rox) 2X | Roche | 4913850001 |
| BrdU | Sigma-Aldrich | B7166-5MG |
| RQ1 RNase-Free DNase | Promega | M6101 |
| Antarctic Phosphatase | NEB | M0289S |
| BrdU Antibody Conjugated Agarose Beads | Santa Cruz | sc-32323 AC |
| T4 Polynucleotide Kinase | NEB | M0201S |
| E. coli Poly (A) Polymerase | NEB | M0276S |
| SuperScript III First-Strand Synthesis System | Thermo Fisher | 18080051 |
| Exonuclease I | NEB | M0293S |
| Circligase II | Epicentre | CL9021K |
| APE1 | NEB | M0282S |
| Phusion High-Fidelity DNA Polymerase | NEB | M0530S |
| SYBR Gold Nucleic Acid Gel Stain | Thermo Fisher | S11494 |
| IdU | ACROS Organics | AC122350010 |
| CIdU | Sigma-Aldrich | C6891-100MG |
| IL-3 | PeproTech | 200-03 |
| Anti-mouse CD117 MicroBeads | Miltenyi Biotech | 130-091-224 |
| Fluoromount-G Mounting Medium | Southern Biotech | 0100-01 |
| DAPI | Thermo Fisher | D1306 |
| HA Peptide | GenScript | RP11735-1 |
| Critical Commercial Assays | ||
| FITC Annexin V Apoptosis Detection Kit I | BD | 556547 |
| PureLink PCR Micro Kit | Thermo Fisher | K310050 |
| PureLink Quick Gel Extraction Kit | Thermo Fisher | K210012 |
| Deposited Data | ||
| Sequencing data of R-ChIP experiments | This study | GSE97183 |
| Sequencing data of GRO-seq experiments | This study | GSE97183 |
| Experimental Models: Cell Lines | ||
| Human: HEK293T cells | Laboratory of Steve Dowdy | N/A |
| Human: MDS-L cells | Laboratory of Daniel Starczynowski | N/A |
| Mouse: MEFs | This study | N/A |
| Oligonucleotides | ||
| Primers for qRT-PCR and ChIP-qPCR experiments | This study | See Table S1 |
| Software and Algorithms | ||
| ImageJ | N/A | https://imagej.nih.gov/ij/download.html |
| Bowtie2 | (Langmead and Salzberg, 2012) | http://bowtie-bio.sourceforge.net/bowtie2/index.shtml |
| Samtools | (Li et al., 2009) | http://samtools.sourceforge.net/ |
| Bedtools | (Quinlan and Hall, 2010) | http://bedtools.readthedocs.io/en/latest/ |
| R | N/A | https://www.r-project.org/ |
| MACS2 | (Feng et al., 2012) | https://github.com/taoliu/MACS |
| Step One Software v2.3 | Thermo Fisher | https://www.thermofisher.com/us/en/home/technical-resources/software-downloads/StepOne-and-StepOnePlus-Real-Time-PCR-System.html |
CONTACT FOR REAGENT AND RESOURCE SHARING
Please direct any requests for further information and resources to the Lead Contact, Xiang-Dong Fu (xdfu@ucsd.edu), Department of Cellular and Molecular Medicine, University of California, San Diego.
EXPERIMENTAL MODEL AND SUBJECT DETAILS
Cell Lines and Cell Culture Conditions
HEK293T cells were from a common laboratory stock (gift of Dr. Steve Dowdy’s lab). MDS-L cells were from Dr. Daniel Starczynowski’s lab. Mouse Embryonic Fibroblasts (MEFs) were isolated from E14.5 C57BL/6 mouse embryos. HEK293T cells were grown in DMEM supplemented with 10% FBS and 1X penicillin-streptomycin. MDS-L cells were grown in RPMI1640 with 10% FBS, 10 ng/ml recombinant human IL-3 (PeproTech, 200-03) and 1X penicillin-streptomycin. MEFs were grown in DMEM with 10% FBS and 1X penicillin-streptomycin.
Antibodies
Antibody recognizing the HA tag (26183) was purchased from Thermo Fisher; Antibodies for U2AF35 (A302-079A), H2AX (A300-083A), Chk1 (A300-298A), ATM (A300-299A), Chk2 (A300-620A), phospho-RPA32(Ser4/Ser8) (A300-245A), RPA32 (A300-244A) and HEXIM1 (A303-111A for IP, A303-113A for WB) were purchased from Bethyl; Antibodies for U2AF65 (U4758) and β-Actin (A2228) were from Sigma-Aldrich; Antibodies for phospho-Chk1(Ser345) (2348), phospho-Chk2(Thr68) (2661) and CDK9 (2316) were from Cell Signaling; Antibodies for phospho-ATM(Ser1981) (200-301-400) were from Rockland, γ-H2AX (05-636) from EMD Millipore and the V5 tag (sc-83849-R) from Santa Cruz. Antibody for phospho-RNA polymerase II CTD repeat (Ser2) (ab5095) was from Abcam and S9.6 antibody (ENH001) from Kerafast.
METHOD DETAILS
Vector Construction, Viral Infection and Transfection
The pTRIPZ vector was a generous gift of Dr. Gregory Hannon (Paddison et al., 2004). To construct inducible pTRIPZ-overexpression/knockdown vectors for SRSF2, U2AF35 and U2AF65, the coding region (CDS) of SRSF2, U2AF35 or U2AF65 was PCR amplified from cDNA generated from HEK293T cells and cloned into pTRIPZ vector in replacement of the RFP gene in the original vector. A HA tag sequence was added to the 3′ end of SRSF2 CDS sequence. The mir-30-styled miRNA sequence containing a specific shRNA sequence targeting the 3′ UTR region of SRSF2 (5′-ATATCGGCAAGCAGTGTAAACG-3′), U2AF35 (5′-CGAAAGTGTTGTAGTTGATTGA-3′) or U2AF65 (5′- AGGTAGGAACATAGCGTGTTTA-3′) was each synthesized and inserted into the pTRIPZ vector after the CDS region. Site-directed mutagenesis was performed to generate the P95H, P95L, P95R and aa 95-102 deletion (D8aa) alleles for SRSF2; S34F, S34Y, Q157P and Q157R alleles for U2AF35; and R18W, M144I and L187V for U2AF65. These vectors were transfected into HEK293T cells with the packaging vector pCMV-VSV-G (Addgene plasmid #8454) and pCMV-dR8.2-dvpr (Addgene plasmid #8455) and viral supernatant was collected 3 days later. To generate stable cell lines, cells were infected with lentiviral supernatant and puromycin selection (2 μg/ml) was performed 2 days after infection. MEFs expressing WT or mutant Srsf2 gene were constructed as previously described (Ji et al., 2013)
Human RNASEH1 CDS sequence tagged with the nuclear localization signal (NLS) at N terminus and V5 sequence at C terminus was cloned into the ppyCAG expression vector, which was kindly provided by Dr. Juan Calos Izpisua Belmonte. Site-directed mutagenesis was performed to generate the D210N mutant form of RNASEH1, for which RNA/DNA hybrid cleavage activity is inactivated (Nowotny et al., 2007). To generate stable RNASEH1-V5 overexpressing cell lines, cells were transfected with the ppyCAG-RNASEH1-V5 vector followed by hygromycin selection (200 μg/ml) 2 days later.
To overexpress RNASEH1 in MDS-L and mouse cells, C-terminally V5 tagged human full length RNASEH1 was cloned into the EcoRI and XhoI sites of the MSCV-IRES-GFP (MigRI) vector. Retrovirus production and infection procedure were performed as previously described (Komeno et al., 2014).
Primers used were listed in Table S1.
Analyses of Cell Cycle and Apoptosis
For cell cycle analysis, cells were washed with cold PBS and collected for fixation with 80% ice-cold ethanol for 30 min on ice. Fixed cells were re-suspended in freshly made DAPI/TX-100 solution [0.1% Triton X-100 and 1 μg/ml DAPI (Thermo Fisher) in PBS] with 100 μg/ml RNase A and incubated for 30 min at room temperature before analysis by flow cytometry. Apoptosis analysis was performed using FITC Annexin V Apoptosis Detection Kit I from BD PharMingen™ (556547) according to manufacturer’s instruction.
Immunofluorescence
Detection of R-loops by immunofluorescence using S9.6 antibody was performed according a previously described protocol (Nguyen et al., 2017). Briefly, isolated mouse bone marrow c-Kit+ cells were suspended in the pre-warmed 75 mM KCl solution in a drop-wise manner and incubated for 12 min at 37°C. Several drops of freshly made, ice-cold fixative solution [methanol:acetic acid(3:1)] were added to cells, followed by centrifugation (800 rpm, 5 min, 4°C). The supernatant was aspirated down to 300 μl. Cells were resuspended in 5 mL of fixative solution in a drop-wise manner followed by incubation for 20 min on ice. Cells were spun down and then washed once with fixative solution. The supernatant was aspirated down to 20-30 μl. Fixed cells were resuspended by pipetting and spotted onto slides, which were then incubated for 30 min at 65°C. For blocking, slides were incubated with blocking buffer (1X PBS, 0.2% Triton X-100, 5% BSA) for 1 hr at room temperature, followed by incubation with S9.6 antibody overnight at 4°C. On the next day, slides were washed three times with wash buffer (1X PBS, 0.1% Triton X-100) and then incubated with fluorescence-conjugated secondary antibody (Alexa Fluor 488 Donkey anti-Mouse IgG (H+L), 1:500 dilution) for 1hr at room temperature. Cells were then washed three times with 1X PBS and stained with DAPI for 30 min and mounted with Fluoromount-G (SouthernBiotech) for imaging under an Olympus FV1000 confocal microscope.
For γ-H2AX staining, HEK293T cells cultured on coverslips were fixed with 4% paraformaldehyde for 20 min and then incubated with 0.3% Triton X-100 in PBS for 30 min, both at room temperature. After washing with PBS, cells were then incubated with blocking buffer (10% BSA and 0.03% Trixon X-100 in PBS) for 1 hr at room temperature followed by incubation with primary antibody for γ-H2AX (1:500 dilution) overnight at 4°C. After washing with wash buffer (0.03% Trixon X-100 in PBS), cells were incubated with the fluorescence-conjugated secondary antibody (Alexa Fluor 594 Goat anti-Mouse IgG (H+L), 1:500 dilution) diluted with wash buffer for 1 hr at room temperature. Cells were then washed three times and stained with DAPI for 30 min and mounted with Fluoromount-G for imaging.
Western Blotting
Western blotting was performed following standard protocol. Briefly, proteins resolved in SDS-PAGE gels were transferred to the nitrocellulose membrane. Blocking [1 hr with 5% nonfat milk in TBST buffer (50 mM Tris-HCl, 150 mM NaCl and 0.05% Tween 20, pH 7.6)], incubation with primary antibody (overnight at 4°C) and HRP-conjugated secondary antibody (1 hr at room temperature) were then performed. After washing with TBST, ECL substrate (Thermo Fisher) was applied to the membrane for imaging by autoradiography.
DNA Fiber Analysis
The DNA fiber analysis was performed following the previous report with modifications (Maréchal et al., 2014). Briefly, cells were sequentially pulse-labeled with 25 μM IdU and then 250 μM CIdU, each for 20 min. 2 μL of cell suspension was spotted onto a cleaned glass slide and lysed with 7 μL of lysis buffer (50 mM EDTA, 0.5% SDS and 200 mM Tris-HCl pH 7.5). Slides were tilted to allow DNA to run slowly down the slide, followed by air-drying and fixation in methanol/acetic acid (3:1) for 10 min. The DNA spread was denatured in 2.5 M HCl for 80 min and then blocked with 5% BSA in PBS for 20 min. Mouse anti-BrdU antibody, which targets IdU, and rat anti-BrdU antibody, which targets CIdU, were diluted in blocking solution and applied to the slides followed by incubation in a humidified chamber for 2 hr. After washing with PBS, secondary fluorescence-conjugated antibodies were applied for 1 hr at room temperature in the dark. The slides were washed and then mounted with Fluoromount-G. DNA fibers were examined under an Olympus FV1000 confocal microscope. Pictures were taken from randomly selected fields and analyzed using the ImageJ software package.
RASL-seq Profiling, Data Analysis and RT-PCR
RASL-seq is designed to profile mRNA isoforms (~5,000 events) using pooled pairs of oligonucleotide probes that target specific splice junctions of each transcript from a selected set of genes and are flanked by a universal primer, as previously reported (Li et al., 2012). Upon annealing to total RNA followed by mRNA capture using biotinylated oligo-dT and streptavidin-coated magnetic beads, paired DNA probes correctly annealed to their complementary RNA were ligated by T4 DNA ligase. Such ligated singleton probes were then indexed by a limited PCR amplification using a set of bar-coded primers carrying a common primer. The indexed PCR products are pooled, purified and quantified by deep sequencing.
Raw counts of individual isoforms are listed in Tables S2, S3, and S4. The processed ratios of isoforms for all alternative splicing events were listed in Table S5. Splicing events with low counts (< 5) in control samples were excluded. To minimize the batch effect, the exclusion-to-inclusion ratio of each splicing event in each sample (Ri) was calculated:
where, S is the read number supporting the exclusion splicing, L is the read number supporting the inclusion splicing, Rei is the expected exclusion-to-inclusion ratio for each pair of splicing events, which is determined as the ratio of summed read count of exclusion to that of inclusion for each splicing event in all control samples. Student’s t test was used to examine whether there is a significant change between control samples and mutants, with a cutoff of two-tailed p value ≤ 0.05 and fold change > 1.5 (or < 2/3).
For RT-PCR validation of RASL-seq results, SRSF2 WT and mutant cells were treated with Dox for 1 and 3 days, total RNAs were then extracted, converted to cDNA by reverse transcription, followed by PCR using pairs of primers targeting five splicing events selected from RASL-seq results. The PCR products were resolved in agarose gel and images of individual bands were quantified by ImageJ software. The results were compared with RASL-seq data and the correlation coefficient was calculated. The PCR primers used for validation were listed in Table S1.
Genome-wide R-loop Mapping by R-ChIP
R-ChIP was developed to capture R-loop in cells expressing a V5-tagged RNASEH1(D210N) mutant gene (Chen et al., 2017). The protocol follows a standard ChIP strategy with modifications (Ji et al., 2013). Briefly, approximately 0.5-1 × 10⁷ cells expressing V5-tagged RNASEH1(D210N) were crosslinked with 1% formaldehyde for 10 min, followed by addition of 1.375 M glycine to the final concentration of 125 mM and further incubation for 15 min at room temperature. Fixed cells were collected and lysed with cell lysis buffer (10 mM Tris-HCl pH 8.0, 10 mM NaCl, 0.5% NP-40 and 1X proteinase inhibitor cocktail). The nuclei were then extracted in nuclei lysis buffer (50 mM Tris-HCl pH 8.0, 10 mM EDTA, 1% SDS and 1X proteinase inhibitor cocktail). The chromatin DNA was sheared to 250-600 bp in size and incubated with magnetic beads conjugated with anti-V5 antibody overnight at 4°C. To enrich for RNASEH1-bound RNA/DNA hybrid fragments, beads were sequentially washed in TSEI (20 mM Tris-HCl pH 8.0, 150 mM NaCl, 1% Triton X-100, 0.1% SDS, 2 mM EDTA and 1X proteinase inhibitor cocktail), TSEII (20 mM Tris-HCl pH 8.0, 500 mM NaCl, 1% Triton X-100, 0.1% SDS, 2 mM EDTA and 1X proteinase inhibitor cocktail), TSEIII (10 mM Tris-HCl pH 8.0, 250 mM LiCl, 1% NP-40, 1% Deoxycholate, 1 mM EDTA and 1X proteinase inhibitor cocktail) and TE buffer (10 mM Tris-Cl pH 8.0 and 1 mM EDTA). The protein-chromatin complex was eluted with elution buffer (10 mM Tris-HCl pH 8.0, 1% SDS and 1 mM EDTA) and decrosslinked overnight at 65°C. Following RNase A and Proteinase K treatment, the RNA/DNA hybrid was extracted by phenol and phenol:chloroform:isoamyl alcohol, and precipitated by ethanol.
To generate strand-specific R-ChIP library, DNA from precipitated RNA/DNA hybrids was converted to dsDNA by random priming using a N9 containing oligo (5′-/invddt/CAAGCAGAAGACGGCATACGAGNNNNNNNNN-3′). An “A” base was then added to the 3′ end. The standard illumina adaptor was added, but only ligated to one end of the resultant dsDNA as the other end contains a 5′ overhang introduced by the N9 oligo. To amplify the library, 16 cycles of PCR were performed and PCR products in the size range of 130 - 350 bp were gel-isolated and purified. Deep sequencing was performed on illumina HiSeq 2500 system according to manufacturer’s instruction. The sequencing start site, which is from the adaptor end, corresponds to the 3′ end of the captured R-loop region (see Figure 4A).
Profiling Nascent RNA Production by GRO-seq
Global run-on followed by deep sequencing was performed as previously described with a few modifications (Ji et al., 2013). Briefly, HEK293T cells with or without Dox treatment were washed with cold 1X PBS buffer and incubated in swelling buffer (10 mM Tris-HCl pH 7.5, 2 mM MgCl2 and 3 mM CaCl2) for 5 min on ice. Cells were scraped off and re-suspended in lysis buffer (10 mM Tris-HCl pH 7.5, 2 mM MgCl2, 3 mM CaCl2, 10% Glycerol and 0.5% IGEPAL) with gentle swirling and incubation for 5 min on ice. The resultant nuclei were washed once with lysis buffer and re-suspended completely in 100 μL freezing buffer (40% Glycerol, 5 mM MgCl2, 0.1 mM EDTA, and 50 mM Tris-HCl pH 8.3) before the run-on assay.
For the run-on assay, re-suspended nuclear extract was mixed with an equal volume of run-on reaction buffer (10 mM Tris-HCl, pH 8.0, 5 mM MgCl2, 300 mM KCl, 1 mM DTT, 200 U/ml RNaseOut, 1% Sarkosyl, 500 μM ATP, 500 μM GTP, 500 μM Br-UTP and 2 μM CTP) and incubated for 5 min at 30°C. The reaction was stopped by adding 750 μL TRIzol LS reagent (Thermo Fisher). The total nuclear RNA was cleared by acidic phenol/chloroform (pH 4.5, Thermo Fisher) and precipitated by ethanol. The extracted RNA was subjected to base hydrolysis by 200 mM NaOH for 5 min on ice and then neutralized by Tris-Cl buffer (pH 6.8). Treatment of DNase I (Promega) to remove residual DNA contamination was performed followed by antarctic phosphatase (NEB) incubation according to manufacturer’s instructions. The resultant RNA was then heated to 65°C for 5 min and chilled on ice. To prepare for immunoprecipitation, anti-BrdU agarose beads (Santa Cruz) were equilibrated with binding buffer (0.25X SSPE, 1 mM EDTA, 0.05% Tween 20 and 37.5 mM NaCl) and incubated with blocking buffer (1X binding buffer, 0.1% PVP and 1 μg/ml BSA) for 1 hr at 4°C. After blocking, beads were washed once with binding buffer and mixed with RNA in binding buffer for 1 hr at 4°C. To remove unbound RNA, beads were sequentially washed with binding buffer, low salt buffer (0.2X SSPE, 1 mM EDTA and 0.05% Tween 20), high salt buffer (0.25X SSPE, 1 mM EDTA, 0.05% Tween 20 and 150 mM NaCl), and TET buffer (10 mM Tris-HCl pH 8.0, 1 mM EDTA pH 8.0 and 0.1% Tween 20). Finally, BrU-incorporated RNA was eluted in elution buffer (20 mM DTT, 150 mM NaCl, 50 mM Tris-HCl pH 7.5, 1 mM EDTA and 0.1% SDS).
To repair the end, BrU-RNA was treated with T4 PNK (NEB) for 1 hr at 37°C, extracted using acidic phenol-chloroform (Thermo Fisher), and then subjected to poly-A tailing reaction with poly(A) polymerase (NEB) for 30 min at 37°C. Tailed RNA were next converted to cDNA by reverse transcription using superscript III (Thermo Fisher) and the GRO-seq RT primer (5′-pAGATCGGAAGAGCGTCGTGTAG;GCAGAAGACGGCATACGAGATTTTTTTTTTTTTTTTTTTTVN-3′), where p indicates 5′ phosphorylation and ‘;’ indicates the abasic dSpacer furan and VN indicates degenerate nucleotides. The cDNA products were subjected to Exonuclease I (NEB) treatment for 1 hr at 37°C to eliminate excessive primers, followed by alkaline hydrolysis to remove RNA. After stopping the reaction by adding HCl, the resultant cDNA were resolved in 10% polyacrylamide TBE-urea gel. The fraction of cDNA of 100 - 400 bp in size was excised and recovered by shaking the ground gel in elution buffer (10 mM Tris-HCl pH 8.0, 1 mM EDTA, pH 8.0, 0.1% Tween 20 and 300 mM NaCl) for 2 hr at room temperature. For circularization, the eluted cDNA products were precipitated with ethanol, re-suspended in 10 μL reaction buffer [6 μL H2O, 1 μL CircLigase buffer, 2 μL 5 M Betaine, 0.5 μL 50 mM MnCl2, 0.5 μL CircLigase II (Epicentre)] and circularized according to manufacturer’s instructions. Circular single-stranded DNA were re-linearized by adding 3.3 μL re-linearization mix [100 mM KCl, 2 mM DTT, 1.5 μL Ape1 (NEB)] and incubation for 1.5 hr at 37°C.
Finally, re-linearized DNA was PCR amplified using Phusion High-Fidelity enzyme (NEB), and primers oNTI200 (5′-CAAGCAGAAGACGGCATACGA-3′) and oNTI201 (5′-AATGATACGGCGACCACCGAGATCTACACNNNNNACACTCTTTCCCTACACGACGCTCTTCCGATCT-3′), where NNNNN indicates the index sequence. The PCR condition was first denaturation for 5 min at 98°C, followed by 12 cycles of 10 s denaturation at 98°C, 15 s annealing at 60°C, and 15 s extension at 72°C. The PCR products were resolved in a non-denaturing 10% polyacrylamide TBE gel. The library fraction in the size range of 130 - 250 bp was sliced and recovered. Sequencing was performed on the illumina HiSeq 2500 platform following manufacturer’s instructions.
R-ChIP and GRO-seq Data Analysis
Raw R-ChIP and GRO-seq sequencing data were mapped to the human genome (hg18) by Bowtie 2 with–local model. Repeat reads, low-quality reads (-q 30 for R-ChIP and -q 2 for GRO-seq) and PCR duplicates were discarded by Samtools. To perform cross-sample comparison of R-loop dynamics, we aimed to identify a unified set of regions that have the potential of forming R-loops. We randomly sampled at most 2 million reads from plus or minus strand for each biological replicate of each sample to make sure equal representation of each sample, and then merge them to call narrow peaks by MACS2. R-loop signal intensity was quantified as average read coverage within a given R-loop peak. For each R-loop region, the R-loop was considered significantly up-or downregulated in mutant if the intensity ratio (5 hr/0 hr) in mutant is > = 1.5 or ≤ 2/3, and significantly higher or lower than that in wild-type (5 hr/0 hr) by unpaired Student’s t test. Refseq was used to annotate R-loops, with regions from −1,000 to +1,000 of TSS/TTS as TSS/TTS regions, with the remaining genic regions as gene body. GRO-seq was used to measure the traveling ratio, as defined previously (Ji et al., 2013). Statistics of sequencing data were listed in Table S6.
P-TEFb Extraction Assay
The P-TEFb release assay was carried out following previous reports with modifications (Calo et al., 2015; Ji et al., 2013). Briefly, 5 μg of anti-HEXIM1 antibody was incubated with Protein A/G magnetic beads (Thermo Fisher) overnight at 4°C until use. HEK293T cells were washed and lysed in lysis buffer [10 mM HEPES, 2 mM MgCl, 10 mM KCl, 150 mM NaCl, 0.5% NP-40, 0.5 mM EDTA, 1 mM DTT, 0.1% PMSF, 1X protease inhibitor cocktail (Sigma-Aldrich) and 1 U/μl RiboLock RNase inhibitor (Thermo Fisher)] for 10 min on ice. The cell lysate was pre-cleared by centrifugation at 12000 rpm for 10 min at 4°C. The antibody-bound magnetic beads were added to the cell lysate and the mix was incubated for 2 hr at 4°C with rotation to immobilize the 7SK snRNP complex. After immunoprecipitation, beads were washed in lysis buffer, re-suspended in PBS containing 5 mg/ml BSA. The bead-bound complex was incubated with increasing amount of purified SRSF2-HA proteins (WT or P95H mutant) for 15 min at 37°C on a thermal mixer with gentle shaking. After the reaction, a magnetic separator was used to sequester beads and the resultant elutes were collected as the release fraction. Beads were washed twice with wash buffer and boiled in SDS loading buffer. The resultant protein mix was collected as the bead-bound fraction. Proteins from release and bead-bound fractions were analyzed by western blotting.
For purification of HA-tagged SRSF2 proteins from HEK293T cells, SRSF2 WT and P95H mutant cells were treated with Dox for 3 days and then lysed in lysis buffer (25 mM Tris-HCl pH 7.4, 150 mM NaCl, 1 mM EDTA, 1% NP-40, 5% glycerol and 1X proteinase inhibitor cocktail). SRSF2-HA proteins were affinity-purified using anti-HA magnetic beads according to manufacturer’s instruction (Thermo Fisher) and washed extensively before elution with 2 mg/ml HA peptide (GenScript).
The Luciferase Assay for SRSF2-dependent Transcription Activation
The luciferase assay was performed as previously described (Ji et al., 2013). Briefly, HEK293T cells were seeded in 24-well plates and treated with Dox two day before co-transfection with 5 ng of a luciferase reporter (HSV-luc, HSV-2xESE-luc or HSV-2xcESE-luc) and 1 ng of the internal control (pCMV). After 1 day, cells were harvested for luciferase assay using Dual-luciferase Reporter Assay System (Promega).
Animals
Conditional Srsf2(P95H/WT) mice were described previously (Kim et al., 2015). Poly(I:C) (Sigma) was injected intraperitoneally (i.p.) at 12 μg/g every the other day for three injections. Genotyping of Srsf2(WT) and Srsf2(P95H/WT) littermate mice were performed by PCR with primers according to the previous report (Kim et al., 2015): loxP-F (5′-CAACACGGCCGATATCATAA-3′) and Exon1-R (5′-TACAGTCCTCGTGGGTAGGG-3′). The PCR reaction parameters were as follows: 95°C for 2 min, followed by 35 cycles of 95°C for 45 s, 55°C for 45 s, and 72°C for 1 min, and then 72°C for 5 min. The P95H allele was detected by gel as a band of 225 bp. All the procedures were approved by the institutional animal care and use committee of UCSD.
RNASEH1 Overexpression in Mouse c-Kit+ Cells and in vitro Colony-forming Assays
c-Kit+ cells were enriched by anti-mouse CD117 Microbeads (Miltenyi Biotech) from 8-week-old Mx1-cre Srsf2(WT) or Mx1-cre Srsf2(P95H/WT) mice 2 weeks after Poly(I:C) injection. c-kit+ cells were infected with retrovirus expressing a MSCV-IRES-GFP empty vector or the vector containing the full length RNASEH1 cDNA. The viral infection procedure was performed as previously described (Komeno et al., 2014). GFP+ cells were sorted, ~40,000 of which were seeded into methylcellulose medium (Methocult M3434; STEMCELL Technologies). Colonies were counted 14 days after seeding. Protein expression of RNASEH1 was confirmed by western blotting.
QUANTIFICATION AND STATISTICAL ANALYSIS
Statistical parameters are reported either in individual Figures or corresponding Figure Legends. Quantification data are in general presented as bar/line plot, with the error bar representing mean ± SEM, or boxplot, showing the median (middle line), first and third quartiles (box boundaries), and furthest observation or 1.5 times of the interquartile (end of whisker). All statistical analyses were done in R and the detailed statistical parameters are reported either in individual Figures or corresponding Figure Legends. Whenever asterisks are used to indicate the statistical significances, *stands for p < 0.05; **for p < 0.01, and ***for p < 0.001.
DATA AND SOFTWARE AVAILABILITY
The accession number for the raw data fastq files and processed BigWig files for sequencing data of R-ChIP and GRO-seq experiment deposited in NCBI is GEO: GSE97183.
Supplementary Material
Highlights.
Mutations in splicing factors cause cell cycle arrest but distinct splicing defects
Causal mutations in SRSF2 and U2AF1 activate the ATR, but not ATM, pathway
R-loops are augmented genome-wide in SRSF2 and U2AF1 mutants
Overexpressed RNase H partially corrects growth defect of hematopoietic progenitors
Acknowledgments
The authors are grateful to members of the X.-D.F. and D.-E.Z. labs for cooperation, reagent sharing, and insightful discussions during the course of this investigation. We are particularly thankful to Dr. Daniel Starczynowski for the gift of MDS-L cells, Dr. Yang Yu from the Gregory Hannon lab for the gift of the pTRIPZ plasmid, Dr. Tomoaki Hishida from Dr. Juan Carlos Izpisua Belmonte’s lab for the gift of the ppyCAG plasmid, and Jesus Olvera and Cody Fine from the UC San Diego Human Embryonic Stem Cell Core Facility for their help and technical advice during cell sorting and FACS. Y.Z. was supported by the National Key R&D Program of China (2017YFA0504400). This work was primarily supported by NIH Grant DK098808 (to X.-D.F. and D.-E. Z.). Additional support was also provided by NIH Grants HG004650, GM049369, and GM052872 (to X.D.F.).
Footnotes
SUPPLEMENTAL INFORMATION
Supplemental Information includes six figures and six tables and can be found with this article online at https://doi.org/10.1016/j.molcel.2017.12.029.
AUTHOR CONTRIBUTIONS
L.C. and X.-D.F. conceived and designed the experiments. L.C. performed the majority of the experiments. J.-Y.C. was responsible for the processing and analysis of most genomic data Y.-J.H. contributed to MDS-L cell- and mouse-related assays. Y.G. performed immunocytochemistry- and flow cytometry-related experiments. C.S. contributed to GRO-seq. H.Q. contributed to immunocytochemistry. J.Q. was responsible for splicing profiling. X.Z. and J.H. contributed to lentivirus preparation and H.L. to deep sequencing. O.A.-W. provided Mx1-cre Srsf2(P95H/WT) mice. L.C., S.H., and Y.Z. contributed to additional analyses of genomic and RASL-seq data. L.C., J.-Y.C., Y.-J.H., D.-E.Z., and X.-D.F. interpreted the data and wrote the paper.
DECLARATION OF INTERESTS
The authors declare no competing financial interests.
References
- Aguilera A, García-Muse T. R loops: from transcription byproducts to threats to genome stability. Mol Cell. 2012;46:115–124. doi: 10.1016/j.molcel.2012.04.009. [DOI] [PubMed] [Google Scholar]
- Awasthi P, Foiani M, Kumar A. ATM and ATR signaling at a glance. J Cell Sci. 2015;128:4255–4262. doi: 10.1242/jcs.169730. [DOI] [PubMed] [Google Scholar]
- Biankin AV, Waddell N, Kassahn KS, Gingras MC, Muthuswamy LB, Johns AL, Miller DK, Wilson PJ, Patch AM, Wu J, et al. Australian Pancreatic Cancer Genome Initiative Pancreatic cancer genomes reveal aberrations in axon guidance pathway genes. Nature. 2012;491:399–405. doi: 10.1038/nature11547. [DOI] [PMC free article] [PubMed] [Google Scholar]
- Calo E, Flynn RA, Martin L, Spitale RC, Chang HY, Wysocka J. RNA helicase DDX21 coordinates transcription and ribosomal RNA processing. Nature. 2015;518:249–253. doi: 10.1038/nature13923. [DOI] [PMC free article] [PubMed] [Google Scholar]
- Chen PC, Dudley S, Hagen W, Dizon D, Paxton L, Reichow D, Yoon SR, Yang K, Arnheim N, Liskay RM, Lipkin SM. Contributions by MutL homologues Mlh3 and Pms2 to DNA mismatch repair and tumor suppression in the mouse. Cancer Res. 2005;65:8662–8670. doi: 10.1158/0008-5472.CAN-05-0742. [DOI] [PubMed] [Google Scholar]
- Chen L, Chen JY, Zhang X, Gu Y, Xiao R, Shao C, Tang P, Qian H, Luo D, Li H, et al. R-ChIP using inactive RNase H reveals dynamic coupling of R-loops with transcriptional pausing at gene promoters. Mol Cell. 2017;68:745–757.e5. doi: 10.1016/j.molcel.2017.10.008. [DOI] [PMC free article] [PubMed] [Google Scholar]
- Chini CC, Chen J. Claspin, a regulator of Chk1 in DNA replication stress pathway. DNA Repair (Amst) 2004;3:1033–1037. doi: 10.1016/j.dnarep.2004.03.001. [DOI] [PubMed] [Google Scholar]
- Cimmino L, Dolgalev I, Wang Y, Yoshimi A, Martin GH, Wang J, Ng V, Xia B, Witkowski MT, Mitchell-Flack M, et al. Restoration of TET2 function blocks aberrant self-renewal and leukemia progression. Cell. 2017;170:1079–1095.e20. doi: 10.1016/j.cell.2017.07.032. [DOI] [PMC free article] [PubMed] [Google Scholar]
- Cimprich KA, Cortez D. ATR: an essential regulator of genome integrity. Nat Rev Mol Cell Biol. 2008;9:616–627. doi: 10.1038/nrm2450. [DOI] [PMC free article] [PubMed] [Google Scholar]
- Colla S, Ong DS, Ogoti Y, Marchesini M, Mistry NA, Clise-Dwyer K, Ang SA, Storti P, Viale A, Giuliani N, et al. Telomere dysfunction drives aberrant hematopoietic differentiation and myelodysplastic syndrome. Cancer Cell. 2015;27:644–657. doi: 10.1016/j.ccell.2015.04.007. [DOI] [PMC free article] [PubMed] [Google Scholar]
- Dvinge H, Kim E, Abdel-Wahab O, Bradley RK. RNA splicing factors as oncoproteins and tumour suppressors. Nat Rev Cancer. 2016;16:413–430. doi: 10.1038/nrc.2016.51. [DOI] [PMC free article] [PubMed] [Google Scholar]
- Fei DL, Motowski H, Chatrikhi R, Prasad S, Yu J, Gao S, Kielkopf CL, Bradley RK, Varmus H. Wild-type U2AF1 antagonizes the splicing program characteristic of U2AF1-mutant tumors and is required for cell survival. PLoS Genet. 2016;12:e1006384. doi: 10.1371/journal.pgen.1006384. [DOI] [PMC free article] [PubMed] [Google Scholar]
- Feng J, Liu T, Qin B, Zhang Y, Liu XS. Identifying ChIP-seq enrichment using MACS. Nat Protoc. 2012;7:1728–1740. doi: 10.1038/nprot.2012.101. [DOI] [PMC free article] [PubMed] [Google Scholar]
- Furney SJ, Pedersen M, Gentien D, Dumont AG, Rapinat A, Desjardins L, Turajlic S, Piperno-Neumann S, de la Grange P, Roman-Roman S, et al. SF3B1 mutations are associated with alternative splicing in uveal melanoma. Cancer Discov. 2013;3:1122–1129. doi: 10.1158/2159-8290.CD-13-0330. [DOI] [PMC free article] [PubMed] [Google Scholar]
- Gaillard H, García-Muse T, Aguilera A. Replication stress and cancer. Nat Rev Cancer. 2015;15:276–289. doi: 10.1038/nrc3916. [DOI] [PubMed] [Google Scholar]
- Ginno PA, Lott PL, Christensen HC, Korf I, Chédin F. R-loop formation is a distinctive characteristic of unmethylated human CpG island promoters. Mol Cell. 2012;45:814–825. doi: 10.1016/j.molcel.2012.01.017. [DOI] [PMC free article] [PubMed] [Google Scholar]
- Ginno PA, Lim YW, Lott PL, Korf I, Chédin F. GC skew at the 5′ and 3′ ends of human genes links R-loop formation to epigenetic regulation and transcription termination. Genome Res. 2013;23:1590–1600. doi: 10.1101/gr.158436.113. [DOI] [PMC free article] [PubMed] [Google Scholar]
- Harbour JW, Roberson ED, Anbunathan H, Onken MD, Worley LA, Bowcock AM. Recurrent mutations at codon 625 of the splicing factor SF3B1 in uveal melanoma. Nat Genet. 2013;45:133–135. doi: 10.1038/ng.2523. [DOI] [PMC free article] [PubMed] [Google Scholar]
- Hasegawa N, Oshima M, Sashida G, Matsui H, Koide S, Saraya A, Wang C, Muto T, Takane K, Kaneda A, et al. Impact of combinatorial dysfunctions of Tet2 and Ezh2 on the epigenome in the pathogenesis of myelodysplastic syndrome. Leukemia. 2017;31:861–871. doi: 10.1038/leu.2016.268. [DOI] [PubMed] [Google Scholar]
- Ilagan JO, Ramakrishnan A, Hayes B, Murphy ME, Zebari AS, Bradley P, Bradley RK. U2AF1 mutations alter splice site recognition in hematological malignancies. Genome Res. 2015;25:14–26. doi: 10.1101/gr.181016.114. [DOI] [PMC free article] [PubMed] [Google Scholar]
- Imielinski M, Berger AH, Hammerman PS, Hernandez B, Pugh TJ, Hodis E, Cho J, Suh J, Capelletti M, Sivachenko A, et al. Mapping the hallmarks of lung adenocarcinoma with massively parallel sequencing. Cell. 2012;150:1107–1120. doi: 10.1016/j.cell.2012.08.029. [DOI] [PMC free article] [PubMed] [Google Scholar]
- Ji X, Zhou Y, Pandit S, Huang J, Li H, Lin CY, Xiao R, Burge CB, Fu XD. SR proteins collaborate with 7SK and promoter-associated nascent RNA to release paused polymerase. Cell. 2013;153:855–868. doi: 10.1016/j.cell.2013.04.028. [DOI] [PMC free article] [PubMed] [Google Scholar]
- Kim E, Ilagan JO, Liang Y, Daubner GM, Lee SC, Ramakrishnan A, Li Y, Chung YR, Micol JB, Murphy ME, et al. SRSF2 Mutations Contribute to Myelodysplasia by Mutant-Specific Effects on Exon Recognition. Cancer Cell. 2015;27:617–630. doi: 10.1016/j.ccell.2015.04.006. [DOI] [PMC free article] [PubMed] [Google Scholar]
- Komeno Y, Yan M, Matsuura S, Lam K, Lo MC, Huang YJ, Tenen DG, Downing JR, Zhang DE. Runx1 exon 6-related alternative splicing isoforms differentially regulate hematopoiesis in mice. Blood. 2014;123:3760–3769. doi: 10.1182/blood-2013-08-521252. [DOI] [PMC free article] [PubMed] [Google Scholar]
- Komeno Y, Huang YJ, Qiu J, Lin L, Xu Y, Zhou Y, Chen L, Monterroza DD, Li H, DeKelver RC, et al. SRSF2 Is Essential for Hematopoiesis, and Its Myelodysplastic Syndrome-Related Mutations Dysregulate Alternative Pre-mRNA Splicing. Mol Cell Biol. 2015;35:3071–3082. doi: 10.1128/MCB.00202-15. [DOI] [PMC free article] [PubMed] [Google Scholar]
- Kon A, Yamazaki S, Nannya Y, Kataoka K, Ota Y, Nakagawa MM, Yoshida K, Shiozawa Y, Morita M, Yoshizato T, et al. Physiological Srsf2 P95H expression causes impaired hematopoietic stem cell functions and aberrant RNA splicing in mice. Blood Published online November. 2017;16:2017. doi: 10.1182/blood-2017-01-762393. https://doi.org/10.1182/blood-2017-1101-762393. [DOI] [PMC free article] [PubMed] [Google Scholar]
- Langmead B, Salzberg SL. Fast gapped-read alignment with Bowtie 2. Nat Methods. 2012;9:357–359. doi: 10.1038/nmeth.1923. [DOI] [PMC free article] [PubMed] [Google Scholar]
- Lee SC, Dilai K, Obeng EA, Kim E, Micol JB, Yoshimi A, Willekens C, Inoue D, Saada V, Cho H, et al. Synthetic lethal interactions of MDS-associated spliceosomal gene mutations identifies the basis for their mutual exclusivity. Blood. 2016a;128:961. [Google Scholar]
- Lee SC, Dvinge H, Kim E, Cho H, Micol JB, Chung YR, Durham BH, Yoshimi A, Kim YJ, Thomas M, et al. Modulation of splicing catalysis for therapeutic targeting of leukemia with mutations in genes encoding spliceosomal proteins. Nat Med. 2016b;22:672–678. doi: 10.1038/nm.4097. [DOI] [PMC free article] [PubMed] [Google Scholar]
- Li X, Manley JL. Inactivation of the SR protein splicing factor ASF/SF2 results in genomic instability. Cell. 2005;122:365–378. doi: 10.1016/j.cell.2005.06.008. [DOI] [PubMed] [Google Scholar]
- Li H, Handsaker B, Wysoker A, Fennell T, Ruan J, Homer N, Marth G, Abecasis G, Durbin R. 1000 Genome Project Data Processing Subgroup. The sequence alignment/map format and SAMtools. Bioinformatics. 2009;25:2078–2079. doi: 10.1093/bioinformatics/btp352. [DOI] [PMC free article] [PubMed] [Google Scholar]
- Li H, Qiu J, Fu XD. RASL-seq for massively parallel and quantitative analysis of gene expression. Curr Protoc Mol Biol. 2012:13.1–9. doi: 10.1002/0471142727.mb0413s98. Chapter 4. Unit 4. [DOI] [PMC free article] [PubMed] [Google Scholar]
- Makishima H, Yoshizato T, Yoshida K, Sekeres MA, Radivoyevitch T, Suzuki H, Przychodzen B, Nagata Y, Meggendorfer M, Sanada M, et al. Dynamics of clonal evolution in myelodysplastic syndromes. Nat Genet. 2017;49:204–212. doi: 10.1038/ng.3742. [DOI] [PMC free article] [PubMed] [Google Scholar]
- Maréchal A, Li JM, Ji XY, Wu CS, Yazinski SA, Nguyen HD, Liu S, Jiménez AE, Jin J, Zou L. PRP19 transforms into a sensor of RPA-ssDNA after DNA damage and drives ATR activation via a ubiquitin-mediated circuitry. Mol Cell. 2014;53:235–246. doi: 10.1016/j.molcel.2013.11.002. [DOI] [PMC free article] [PubMed] [Google Scholar]
- Martin M, Maßhöfer L, Temming P, Rahmann S, Metz C, Bornfeld N, van de Nes J, Klein-Hitpass L, Hinnebusch AG, Horsthemke B, et al. Exome sequencing identifies recurrent somatic mutations in EIF1AX and SF3B1 in uveal melanoma with disomy 3. Nat Genet. 2013;45:933–936. doi: 10.1038/ng.2674. [DOI] [PMC free article] [PubMed] [Google Scholar]
- Martincorena I, Campbell PJ. Somatic mutation in cancer and normal cells. Science. 2015;349:1483–1489. doi: 10.1126/science.aab4082. [DOI] [PubMed] [Google Scholar]
- Mupo A, Seiler M, Sathiaseelan V, Pance A, Yang Y, Agrawal AA, Iorio F, Bautista R, Pacharne S, Tzelepis K, et al. Hemopoietic-specific Sf3b1-K700E knock-in mice display the splicing defect seen in human MDS but develop anemia without ring sideroblasts. Leukemia. 2017;31:720–727. doi: 10.1038/leu.2016.251. [DOI] [PMC free article] [PubMed] [Google Scholar]
- Neri F, Rapelli S, Krepelova A, Incarnato D, Parlato C, Basile G, Maldotti M, Anselmi F, Oliviero S. Intragenic DNA methylation prevents spurious transcription initiation. Nature. 2017;543:72–77. doi: 10.1038/nature21373. [DOI] [PubMed] [Google Scholar]
- Nguyen HD, Yadav T, Giri S, Saez B, Graubert TA, Zou L. Functions of replication protein A as a sensor of R loops and a regulator of RNaseH1. Mol Cell. 2017;65:832–847.e4. doi: 10.1016/j.molcel.2017.01.029. [DOI] [PMC free article] [PubMed] [Google Scholar]
- Nowotny M, Gaidamakov SA, Ghirlando R, Cerritelli SM, Crouch RJ, Yang W. Structure of human RNase H1 complexed with an RNA/DNA hybrid: insight into HIV reverse transcription. Mol Cell. 2007;28:264–276. doi: 10.1016/j.molcel.2007.08.015. [DOI] [PubMed] [Google Scholar]
- Obeng EA, Chappell RJ, Seiler M, Chen MC, Campagna DR, Schmidt PJ, Schneider RK, Lord AM, Wang L, Gambe RG, et al. Physiologic expression of Sf3b1(K700E) causes impaired erythropoiesis, aberrant splicing, and sensitivity to therapeutic spliceosome modulation. Cancer Cell. 2016;30:404–417. doi: 10.1016/j.ccell.2016.08.006. [DOI] [PMC free article] [PubMed] [Google Scholar]
- Paddison PJ, Cleary M, Silva JM, Chang K, Sheth N, Sachidanandam R, Hannon GJ. Cloning of short hairpin RNAs for gene knockdown in mammalian cells. Nat Methods. 2004;1:163–167. doi: 10.1038/nmeth1104-163. [DOI] [PubMed] [Google Scholar]
- Papaemmanuil E, Cazzola M, Boultwood J, Malcovati L, Vyas P, Bowen D, Pellagatti A, Wainscoat JS, Hellstrom-Lindberg E, Gambacorti-Passerini C, et al. Chronic Myeloid Disorders Working Group of the International Cancer Genome Consortium Somatic SF3B1 mutation in myelodysplasia with ring sideroblasts. N Engl J Med. 2011;365:1384–1395. doi: 10.1056/NEJMoa1103283. [DOI] [PMC free article] [PubMed] [Google Scholar]
- Park SM, Ou J, Chamberlain L, Simone TM, Yang H, Virbasius CM, Ali AM, Zhu LJ, Mukherjee S, Raza A, Green MR. U2AF35(S34F) promotes transformation by directing aberrant ATG7 pre-mRNA 3′ end formation. Mol Cell. 2016;62:479–490. doi: 10.1016/j.molcel.2016.04.011. [DOI] [PMC free article] [PubMed] [Google Scholar]
- Pellagatti A, Boultwood J. Splicing factor gene mutations in the myelodysplastic syndromes: impact on disease phenotype and therapeutic applications. Adv Biol Regul. 2017;63:59–70. doi: 10.1016/j.jbior.2016.08.001. [DOI] [PubMed] [Google Scholar]
- Qiu J, Zhou B, Thol F, Zhou Y, Chen L, Shao C, DeBoever C, Hou J, Li H, Chaturvedi A, et al. Distinct splicing signatures affect converged pathways in myelodysplastic syndrome patients carrying mutations in different splicing regulators. RNA. 2016;22:1535–1549. doi: 10.1261/rna.056101.116. [DOI] [PMC free article] [PubMed] [Google Scholar]
- Quinlan AR, Hall IM. BEDTools: a flexible suite of utilities for comparing genomic features. Bioinformatics. 2010;26:841–842. doi: 10.1093/bioinformatics/btq033. [DOI] [PMC free article] [PubMed] [Google Scholar]
- Shirai CL, Ley JN, White BS, Kim S, Tibbitts J, Shao J, Ndonwi M, Wadugu B, Duncavage EJ, Okeyo-Owuor T, et al. Mutant U2AF1 Expression Alters Hematopoiesis and Pre-mRNA Splicing In Vivo. Cancer Cell. 2015;27:631–643. doi: 10.1016/j.ccell.2015.04.008. [DOI] [PMC free article] [PubMed] [Google Scholar]
- Sims RJ, 3rd, Millhouse S, Chen CF, Lewis BA, Erdjument-Bromage H, Tempst P, Manley JL, Reinberg D. Recognition of trimethylated histone H3 lysine 4 facilitates the recruitment of transcription postinitiation factors and pre-mRNA splicing. Mol Cell. 2007;28:665–676. doi: 10.1016/j.molcel.2007.11.010. [DOI] [PMC free article] [PubMed] [Google Scholar]
- Sollier J, Cimprich KA. Breaking bad: R-loops and genome integrity. Trends Cell Biol. 2015;25:514–522. doi: 10.1016/j.tcb.2015.05.003. [DOI] [PMC free article] [PubMed] [Google Scholar]
- Stork CT, Bocek M, Crossley MP, Sollier J, Sanz LA, Chédin F, Swigut T, Cimprich KA. Co-transcriptional R-loops are the main cause of estrogen-induced DNA damage. eLife. 2016;5:e17548. doi: 10.7554/eLife.17548. [DOI] [PMC free article] [PubMed] [Google Scholar]
- Te Raa GD, Derks IA, Navrkalova V, Skowronska A, Moerland PD, van Laar J, Oldreive C, Monsuur H, Trbusek M, Malcikova J, et al. The impact of SF3B1 mutations in CLL on the DNA-damage response. Leukemia. 2015;29:1133–1142. doi: 10.1038/leu.2014.318. [DOI] [PubMed] [Google Scholar]
- Tresini M, Warmerdam DO, Kolovos P, Snijder L, Vrouwe MG, Demmers JA, van Ijcken WF, Grosveld FG, Medema RH, Hoeijmakers JH, et al. The core spliceosome as target and effector of non-canonical ATM signalling. Nature. 2015;523:53–58. doi: 10.1038/nature14512. [DOI] [PMC free article] [PubMed] [Google Scholar]
- Wang L, Brooks AN, Fan J, Wan Y, Gambe R, Li S, Hergert S, Yin S, Freeman SS, Levin JZ, et al. Transcriptomic characterization of SF3B1 mutation reveals its pleiotropic effects in chronic lymphocytic leukemia. Cancer Cell. 2016;30:750–763. doi: 10.1016/j.ccell.2016.10.005. [DOI] [PMC free article] [PubMed] [Google Scholar]
- Xiao R, Sun Y, Ding JH, Lin S, Rose DW, Rosenfeld MG, Fu XD, Li X. Splicing regulator SC35 is essential for genomic stability and cell proliferation during mammalian organogenesis. Mol Cell Biol. 2007;27:5393–5402. doi: 10.1128/MCB.00288-07. [DOI] [PMC free article] [PubMed] [Google Scholar]
- Yoshida K, Sanada M, Shiraishi Y, Nowak D, Nagata Y, Yamamoto R, Sato Y, Sato-Otsubo A, Kon A, Nagasaki M, et al. Frequent pathway mutations of splicing machinery in myelodysplasia. Nature. 2011;478:64–69. doi: 10.1038/nature10496. [DOI] [PubMed] [Google Scholar]
- Zhang J, Lieu YK, Ali AM, Penson A, Reggio KS, Rabadan R, Raza A, Mukherjee S, Manley JL. Disease-associated mutation in SRSF2 misregulates splicing by altering RNA-binding affinities. Proc Natl Acad Sci USA. 2015;112:E4726–E4734. doi: 10.1073/pnas.1514105112. [DOI] [PMC free article] [PubMed] [Google Scholar]
- Zhou T, Hasty P, Walter CA, Bishop AJ, Scott LM, Rebel VI. Myelodysplastic syndrome: an inability to appropriately respond to damaged DNA? Exp Hematol. 2013;41:665–674. doi: 10.1016/j.exphem.2013.04.008. [DOI] [PMC free article] [PubMed] [Google Scholar]
- Zhou Q, Derti A, Ruddy D, Rakiec D, Kao I, Lira M, Gibaja V, Chan H, Yang Y, Min J, et al. A chemical genetics approach for the functional assessment of novel cancer genes. Cancer Res. 2015;75:1949–1958. doi: 10.1158/0008-5472.CAN-14-2930. [DOI] [PubMed] [Google Scholar]
Associated Data
This section collects any data citations, data availability statements, or supplementary materials included in this article.