

Abstract
Plants intimately associate with diverse bacteria. Plant-associated (PA) bacteria have ostensibly evolved genes enabling adaptation to the plant environment. However, the identities of such genes are mostly unknown and their functions are poorly characterized. We sequenced 484 genomes of bacterial isolates from roots of Brassicaceae, poplar, and maize. We then compared 3837 bacterial genomes to identify thousands of PA gene clusters. Genomes of PA bacteria encode more carbohydrate metabolism functions and fewer mobile elements than related non-plant associated genomes. We experimentally validated candidates from two sets of PA genes, one involved in plant colonization, the other serving in microbe-microbe competition between PA bacteria. We also identified 64 PA protein domains that potentially mimic plant domains; some are shared with PA fungi and oomycetes. This work expands the genome-based understanding of plant-microbe interactions and provides leads for efficient and sustainable agriculture through microbiome engineering.
Introduction
The microbiota of plants and animals have co-evolved with their hosts for millions of years1–3. Due to photosynthesis, plants serve as a rich source of carbon for diverse bacterial communities. These include mutualists and commensals, as well as pathogens. Phytopathogens and plant growth-promoting bacteria significantly affect plant growth, health, and productivity4–7. Except for intensively studied relationships such as root nodulation in legumes8, T-DNA transfer by Agrobacterium9, and type III secretion-mediated pathogenesis10, the understanding of molecular mechanisms governing plant-microbe interactions is quite limited. It is therefore important to identify and characterize the bacterial genes and functions that help microbes thrive in the plant environment. Such knowledge should improve our ability to combat plant diseases and harness beneficial bacterial functions for agriculture, directly impacting global food security, bioenergy, and carbon sequestration.
Cultivation-independent methods based on profiling of marker genes or shotgun metagenome sequencing have considerably improved our understanding of microbial ecology in the plant environment11–15. In parallel, the reduction of sequencing costs has enabled the genome sequencing of plant-associated (PA) bacterial isolates at a large scale16. Importantly, isolates enable functional validation of in silico predictions. Isolate genomes also provide genomic and evolutionary context for individual genes and the ability to access genomes of rare organisms that might be missed by metagenomics due to limited sequencing depth. While metagenome sequencing has the advantage of capturing the DNA of uncultivated organisms, multiple 16S rRNA gene surveys have reproducibly shown that the most common plant-associated bacteria are mainly derived from four phyla13,17 (Proteobacteria, Actinobacteria, Bacteroidetes, and Firmicutes) that are amenable to cultivation. Thus, bacterial cultivation is not a major limitation when sampling the abundant members of the plant microbiome16.
Our objective was to characterize the genes that contribute to bacterial adaptation to plants (plant-associated genes) and those genes that specifically aid in bacterial root colonization (root-associated genes). We sequenced the genomes of 484 new bacterial isolates and single bacterial cells from the roots of Brassicaceae, maize, and poplar trees. We combined the newly sequenced with existing genomes into a dataset of 3837 high quality, non-redundant genomes. We then developed a computational approach to identify plant-associated (PA) genes and root-associated (RA) genes based on comparison of phylogenetically-related genomes with knowledge of the origin of isolation. We experimentally validated two sets of PA genes, including a novel gene family that functions in plant-associated microbe-microbe competition. In addition, we characterized many PA genes that are shared between bacteria of different phyla and even between bacteria and PA eukaryotes. This study represents a comprehensive and unbiased effort to identify and characterize candidate genes required at the bacterial-plant interface.
Results
Expanding the plant-associated bacterial reference catalog
To obtain a comprehensive PA bacterial reference genome set, we isolated and sequenced 191, 135, and 51 novel bacterial strains from the roots of Brassicaceae (91% from Arabidopsis thaliana), poplar trees (Populus trichocarpa and Populus deltoides), and maize, respectively (Methods, Table 1, Supplementary Tables 1-3). The bacteria were specifically isolated from either the root interior (endophytic compartment), the root surface (rhizoplane), or the soil attached to the root (rhizosphere) of plants. In addition, we isolated and sequenced 107 single bacterial cells from surface-sterilized roots of A. thaliana. All genomes were assembled, annotated and deposited in public databases and in a dedicated website (see URLs, Supplementary Table 3, Methods).
Table 1.
Novel and previously sequenced and genomes used in this analysis. Taxon color denotes phylum: green – Proteobacteria, red – Firmicutes, purple – Actinobacteria, blue – Bacteroidetes. PA – plant-associated bacteria, NPA – non-plant associated bacteria, soil – soil associated bacteria, RA- root-associated bacteria. NA – not available (an artificial taxon).
| Taxon | Taxonomic rank | # novel Sequenced PA genomes | # scanned genomes | # genomes used in analysis | # PA | # NPA | # Soil | # RA |
|---|---|---|---|---|---|---|---|---|
| Alphaproteobacteria | Class | 126 | 784 | 610 | 368 | 199 | 43 | 169 |
| Burkholderiales | Order | 85 | 612 | 433 | 160 | 209 | 64 | 86 |
| Acinetobacter | Genus | 4 | 926 | 454 | 7 | 442 | 5 | 3 |
| Pseudomonas | Genus | 75 | 506 | 349 | 169 | 137 | 43 | 61 |
| Xanthomonadaceae | Family | 15 | 264 | 147 | 110 | 26 | 11 | 26 |
| Bacillales | Order | 54 | 664 | 454 | 97 | 185 | 172 | 54 |
| Actinobacteria 1 | NA | 69 | 504 | 394 | 164 | 142 | 88 | 89 |
| Actinobacteria 2 | NA | 19 | 845 | 587 | 29 | 526 | 32 | 18 |
| Bacteroidetes | Phylum | 37 | 481 | 409 | 56 | 293 | 60 | 17 |
| Total | 484 | 5586 | 3837 | 1160 | 2159 | 518 | 523 |
A broad, high-quality bacterial genome collection
In addition to the newly sequenced genomes noted above, we mined public databases to collect 5587 bacterial genomes belonging to the four most abundant phyla of PA bacteria13 (Methods). We manually classified each genome as PA, non-plant associated (NPA), or soil-derived based on its unambiguous isolation niche (Methods, Supplementary Tables 1-2). The PA genomes included organisms isolated from plants or rhizospheres. A subset of the PA bacteria was also annotated as ‘RA’ when isolated from the rhizoplane or the root endophytic compartment. Genomes from bacteria isolated from soil were considered as a separate group, as it is unknown whether these strains can actively associate with plants. Finally, the remaining genomes were labeled as non-plant associated (NPA) genomes; these were isolated from diverse environments, including humans, animals, air, sediments, and aquatic environments.
We performed a stringent quality control process to remove low quality or redundant genomes (Methods). This led to a final dataset of 3837 high quality and non-redundant genomes, including 1160 PA genomes, 523 of which are also RA. These 3837 genomes were grouped into nine monophyletic taxa to allow comparative genomics among phylogenetically-related genomes (Figure 1a, Supplementary Tables 1-2, Methods, URLs).
Figure 1. Genome dataset used in analysis and differences in gene category abundances.
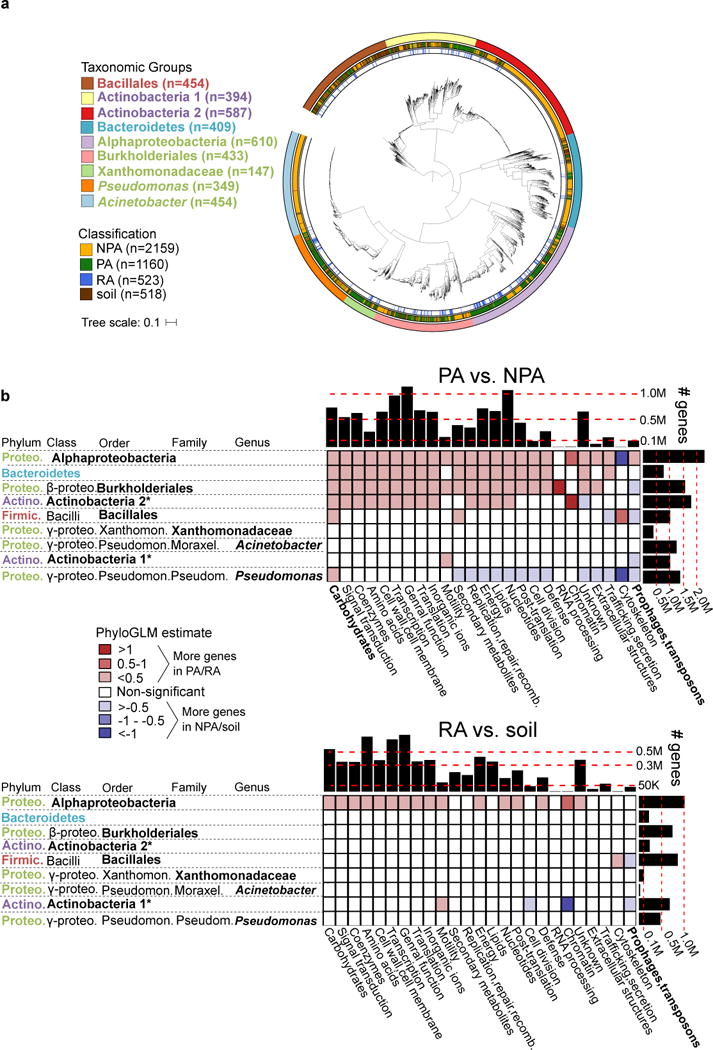
a. Maximum likelihood phylogenetic tree of 3837 high quality and non-redundant bacterial genomes based on the concatenated alignment of 31 single copy genes. Outer ring denotes the taxonomic group, central ring denotes the isolation source, and inner ring denotes the RA genomes within PA genomes. Taxon names are color-coded based on phylum: green – Proteobacteria, red – Firmicutes, blue – Bacteroidetes, purple - Actinobacteria. See URLs for ITOL interactive phylogenetic tree. b. Differences in gene categories between PA/NPA (top panel) and RA/soil (bottom panel) genomes of the same taxon. For both panels, the heat map indicates the level of enrichment or depletion based on a PhyloGLM test. Significant (colored) cells have p value < 0.05, FDR corrected. Hot colored cells indicate significantly more genes in PA and RA genomes in the upper and lower panels, respectively. Histograms on the upper and right margins represent the total number of genes compared in each column and row, respectively. PA – plant-associated, NPA – non-plant associated, RA – root associated, soil – soil-associated. * not a formal class name. Carbohydrates – Carbohydrate metabolism and transport gene category. Full COG category names from the X axis appear in Supplementary Table 6. Note that cells with high absolute estimate values (dark colors) are based on categories of few genes and are therefore more likely to be less accurate.
To determine whether our genome collection from cultured isolates is representative of plant-associated bacterial communities, we analyzed cultivation-independent 16S rDNA surveys and metagenomes from the plant environment of Arabidopsis11,12, barley18, wheat, and cucumber14 (Methods). The nine taxa analyzed here account for 33-76% (median 41%, Supplementary Table 4) of the total bacterial communities found in PA environments and therefore represent a significant portion of the plant microbiota, consistent with previous reports13,16,19.
PA genomes: more sugar metabolism, less mobile elements
We compared the genomes of bacteria isolated from plant environments with bacteria of shared ancestry yet isolated from non-plant environments. The two groups should differ in the set of accessory genes that evolved as part of their adaptation to a specific niche. Comparison of the size of PA, soil, and NPA genomes revealed that PA and/or soil genomes are significantly larger than NPA genomes (P<0.05, PhyloGLM and t-tests, Supplementary Figure 1a, Supplementary Table 5). The trend was observed in 6-7 of the nine analyzed taxa (depending on the test), representing all four phyla. Pangenome analyses within a few genera having PA and NPA isolation sites revealed similar pangenome sizes between PA and NPA genomes (Supplementary Figure 2).
Next, we examined whether certain gene categories are enriched or depleted in PA genomes compared to their NPA counterparts, using 26 broad functional gene categories (Supplementary Table 6). Enrichments were detected using the PhyloGLM test (Figure 1b) and t-test (Supplementary Figure 3). Two gene categories demonstrated similar phylogeny-independent trends suggestive of an environment-dependent selection process. The “Carbohydrate metabolism and transport” gene category was expanded in the PA organisms of six taxa (Figure 1b, upper panel). This was the most expanded category in Alphaproteobacteria, Bacteroidetes, Xanthomonadaceae, and Pseudomonas (Supplementary Figure 3, upper panel). In contrast, mobile genetic elements (phages and transposons) were underrepresented in four PA taxa (Figures 1b and Supplementary Figure 3, upper panels). Interestingly, PA genomes exhibited increased genome sizes despite a reduction in the mobile elements that often serve as vehicles for horizontal gene transfer and genome expansion. Comparison of RA bacteria to soil bacteria revealed less drastic changes than those seen between PA and NPA groups, as expected for organisms that live in more similar habitats (Figures 1b and Supplementary Figure 3, lower panels).
Identification and validation of PA and RA genes
We sought to identify specific genes that are enriched in PA and RA genomes, compared to NPA and soil-derived genomes, respectively (Supplementary Figure 4, Methods). First, we clustered the proteins/protein domains of each taxon based on homology using different annotation resources: COG20, KEGG Orthology21 and TIGRFAM22, which typically comprise 35%-75% of all genes in bacterial genomes23. In order to capture in our analysis genes that do not have existing functional annotations, we also used Orthofinder24 (following benchmarking; Supplementary Figure 5) to cluster all protein sequences within each taxon into homology-based orthogroups. Finally, protein domains were clustered using Pfam25 (Methods, see URLs). These five protein/domain clustering approaches were used in parallel comparative genomics pipelines. Each protein/domain sequence was additionally labeled as originating from either a PA or a NPA genome.
Next, we tested if protein/domain clusters were significantly associated with a PA lifestyle using five independent statistical approaches: hypergbin, hypergcn (two versions of the Hypergeometric test), phyloglmbin, phyloglmcn (two phylogenetic tests based on PhyloGLM26), and Scoary27, a stringent combined test (Methods). These analyses were based on either gene presence/absence or gene copy number (Methods). We defined a gene as significantly PA (henceforth “PA gene”) if it belonged to a significant PA gene cluster by at least one test, and originated from a PA genome. We defined significant NPA, RA and soil genes in the same way. Significant gene clusters found using the different methods had varying degrees of overlap (Supplementary Figure 6-7). In general, we noted a high degree of overlap between PA and RA genes and an overlap between NPA and soil genes (Supplementary Figure 8). Overall, PA genes are depleted from NPA genomes from heterogeneous isolation sources (Supplementary Figures 9-10). Performing principal coordinates analysis (PCoA) using matrices containing only the PA and NPA genes derived from each method as features increased the separation of PA from NPA genomes along the first two axes (Supplementary Figure 11). We provide full lists of statistically significant PA, RA, soil, and NPA proteins and domains based on the five clustering techniques and five statistical approaches for each taxon (Supplementary Tables 7-15, URLs).
As a validation of our predictions, we assessed the abundance patterns of PA/RA genes in natural environments. We retrieved 38 publicly available PA, NPA, RA and soil shotgun metagenomes, including some from PA environments that were not used for isolation of the bacteria analyzed here14,28,29 (Supplementary Table 16a). We mapped reads from these culture-independent metagenomes to PA genes from all statistical approaches (Methods, Supplementary Figures 12-16). PA genes in up to seven taxa were more abundant (P < 0.05, t-test) in PA metagenomes than in NPA metagenomes (Figure 2a, Supplementary Table 16b). RA, soil-associated and NPA genes, on the other hand, were not necessarily more abundant in their expected environments (Supplementary Table 16b).
Figure 2. Validation of predicted PA genes using multiple approaches.
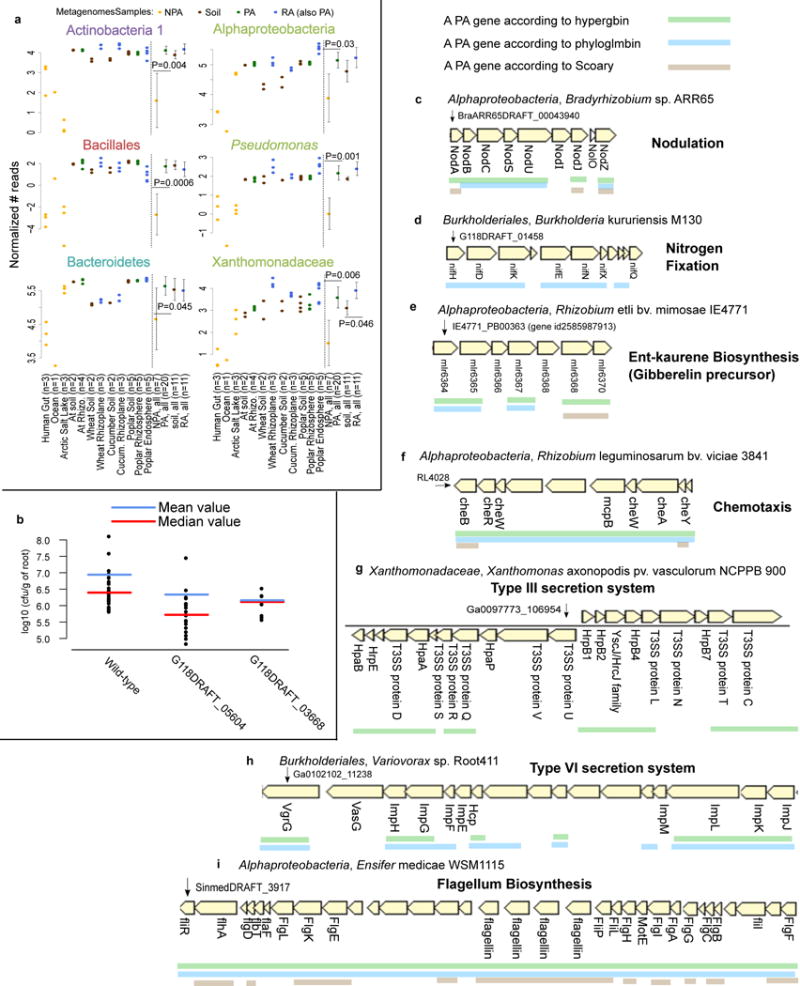
a. PA genes, which were predicted based on isolate genomes, are more abundant in PA metagenomes than in NPA metagenomes. Reads from 38 shotgun metagenome samples were mapped to significant PA, NPA, RA, and soil genes predicted by Scoary. P values are indicated for the significant differences between the PA and NPA or RA and soil in each taxon (two sided t-test). Full results and explanation for normalization are presented in Supplementary Figure 14. b. Rice root colonization experiment using wild type Paraburkholderia kururiensis M130 or knockout mutants for two predicted PA genes. Two mutants exhibited reduced colonization in comparison to wild type: G118DRAFT_05604 (q-value = 0.00013, wilcoxon rank sum test) encodes an outer membrane efflux transporter from the nodT family, and G118DRAFT_03668 (q-value = 0.0952, wilcoxon rank sum test), a Tir chaperone protein (CesT). Each point represents the average count of a minimum of 3-6 plates derived from the same plantlet, expressed as cfu/g of root. c-i. Examples of known functional PA operons captured by different statistical approaches. The PA genes are underlined. c. Nod genes, d. NIF genes, e. ent-kaurene (gibberelin precursor), f. Chemotaxis proteins in bacteria from different taxa. g. Type III secretion system. h. Type VI secretion system, including the imp genes (impaired in nodulation), i. Flagellum biosynthesis in Alphaproteobacteria. Below each gene appears the gene symbol or the protein name where such information was available.
In addition, we selected eight genes that were predicted as PA by multiple approaches (Supplementary Table 17a) for experimental validation using an in planta bacterial fitness assay (Methods). We inoculated the roots of surface-sterilized rice seedlings (n=9-30 seedlings/experiment) with wild type Paraburkholderia kururiensis M130 (a rice endophyte30) or a knock-out mutant strain for each of the eight genes. We grew the plants for 11 days, collected and quantified the bacteria that were tightly attached to the roots (Methods, Supplementary Table 17b). Mutations in two genes led to four-six fold reduced colonization (FDR corrected Wilcoxon rank sum test, q < 0.1) relative to wild type bacteria (Figure 2b) without an observed effect on growth rate (Supplementary Figure 17). These two genes encode an outer membrane efflux transporter from the nodT family and a Tir chaperone protein (CesT). It is plausible that the other six genes assayed function in facets of plant association not captured in this experimental context.
Functions for which co-expression and cooperation between different proteins are needed are often encoded by gene operons in bacteria. We therefore tested whether our methods correctly predict known PA operons. We grouped PA and RA genes into putative PA and RA operons based on their genomic proximity and orientation (Supplementary Figure 4, Methods, URLs). This analysis yielded some well-known PA functions, for example, the nodABCSUIJZ and nifHDKENXQ operons (Figure 2c-d). Nod and Nif proteins are integral for biological nitrogen cycling, mediating root nodulation31 and nitrogen fixation32, respectively. We also identified the biosynthetic gene cluster for the precursor of the plant hormone gibberellin33,34 (Figure 2e). Other known PA operons identified are related to chemotaxis of diverse bacteria35, secretion systems such as T3SS36 and T6SS37, and flagellum biosyntheis38–40 (Figure 2f-i).
In summary, we identified thousands of PA and RA gene clusters by five different statistical approaches (Supplementary Table 18) and validated these by computational and experimental approaches, broadening our understanding of the genetic basis of plant-microbe interactions and providing a valuable resource to drive further experimentation.
Protein domains reproducibly enriched in diverse PA genomes
PA and RA proteins and protein domains conserved across evolutionarily diverse taxa are potentially pivotal to the interaction of bacteria with plants. We identified 767 Pfam domains that are significant PA domains in at least three taxa based on multiple tests (Supplementary Table 19a). We elaborate on a few domains that are PA/RA in all four phyla. Two of these domains, a DNA binding (pfam00356) and a ligand binding (pfam13377) domain, are characteristic of the LacI transcription factor (TF) family. These TFs regulate gene expression in response to different sugars41 and their copy number is expanded in the genomes of PA and RA bacteria of eight of the nine taxa analyzed (Figure 3a). Examination of the genomic neighbors of lacI family genes revealed a strong enrichment for genes involved in carbohydrate metabolism and transport in all of these taxa, consistent with their expected regulation by a LacI family member41 (Supplementary Figure 18). We analyzed the promoter regions of these putative regulatory targets of LacI-family TFs, and identified three AANCGNTT palindromic octamers that are statistically enriched in all but one taxon, and may serve as the TF binding site (Supplementary Table 20). These data suggest that accumulation of a large repertoire of LacI-family controlled regulons is a common strategy across bacterial lineages as they adapt to the plant environment.
Figure 3. Proteins and protein domains that are reproducibly enriched as PA/RA in multiple taxa.
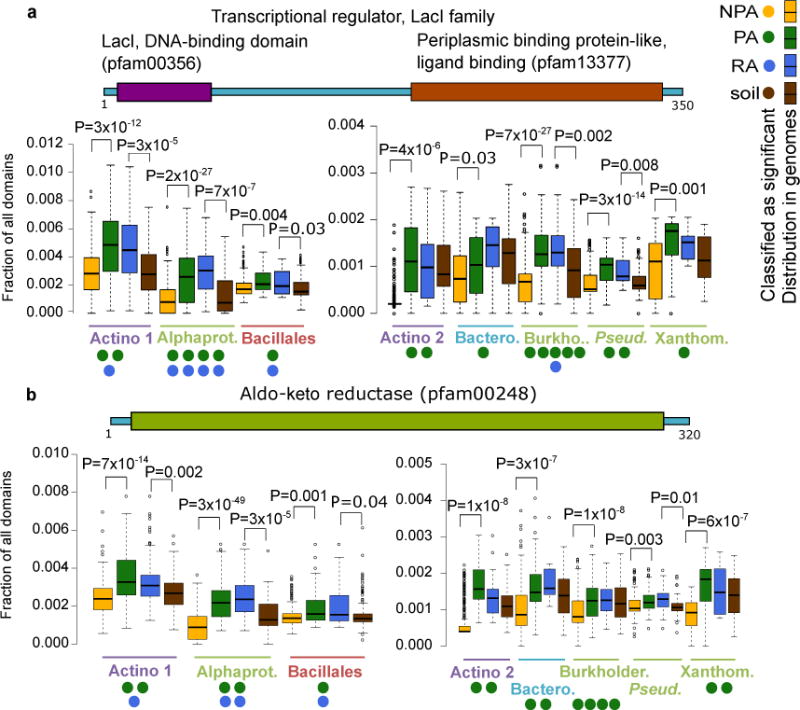
Occurrence of protein domains (from Pfam) was compared between PA and NPA bacteria and between RA and soil bacteria. Taxon names are color coded by phyla as in Figure 1. a. Transcription factors having LacI (Pfam00356) and periplasmic binding protein domains (Pfam13377). These proteins are often annotated as COG1609. b. Aldo-keto reductase domain (Pfam00248). Proteins with this domain are often annotated as COG0667. A two-sided t-test was used for the presence of the genes in a-b between the genomes sharing the same label and was used to verify the enrichment reported by the various tests. FDR-corrected P values are indicated for significant results (q value < 0.05). Filled circles denote the number of different statistical tests (maximum five) supporting a gene/domain being PA/NPA/RA/soil associated. Gene illustrations above each graph represent random protein models. Color coding of the different labels (PA etc.) is as in Figure 1a. Note that a and b have double panels due to different scales. Actino. – Actinobacteria, Alphaprot. – Alphaproteobacteria, Bacil. – Bacillales, Burkholder. – Burkholderiales, Bactero. – Bacteroidetes, Pseud.– Pseudomonas, Xanthom. – Xanthomonadaceae. Box-and-whisker plots represent median, 25th and 75th percentiles, extreme data points that are within a 1.5 fold the interquartile range from the box, and outliers. Full results are in Supplementary Table S19.
Another domain, Aldo-keto reductase (pfam00248), is a metabolic domain enriched within the genomes of PA and RA bacteria from eight taxa belonging to all four phyla (Figure 3b). This domain is involved in the metabolic conversion of a broad range of substrates, including sugars and toxic carbonyl compounds42. Thus, bacteria inhabiting the plant environment may consume similar substrates. Additional PA and RA proteins and domains that are enriched in at least six taxa are described in Supplementary Figure 19.
We also identified domains that are reproducibly enriched in NPA and/or soil genomes, including many domains of mobile genetic elements (Supplementary Figure 20).
Putative plant protein mimicry by PA and RA proteins
Convergent evolution or horizontal transfer of protein domains from eukaryotes to bacteria have been suggested for some microbial effector proteins that are secreted into eukaryotic host cells to suppress defense and facilitate microbial proliferation43–45. We searched for new candidate effectors or other functional plant protein mimics. We retrieved a set of significant PA/RA Pfam domains that were reproducibly predicted by multiple approaches or in multiple taxa and cross-referenced these with protein domains that are also more abundant in plant genomes than in bacterial genomes (Methods). This analysis yielded 64 Plant-Resembling PA and RA Domains (PREPARADOs) encoded by 11,916 genes (Supplementary Figure 21, Supplementary Table 21). The number of PREPARADOs is four-fold higher than the number of domains that overlap with reproducible NPA/soil domains and plant domains (n=15). The PREPARADOs are relatively abundant in genomes of PA Bacteroidetes and Xanthomonadaceae (>0.5% of all domains on average, Supplementary Figure 22). Some PREPARADOs were previously described as domains within effector proteins, such as Ankyrin repeats46, regulator of chromosome condensation repeat (RCC1)47, Leucine-rich repeat (LRR)48, and pectate lyase49. Intriguingly, PREPARADOs from plant genomes are enriched 3-14-fold (P<10−5, Fisher exact test) as domains predicted to be ‘integrated effector decoys’ when fused to plant intracellular innate immune receptors of the NLR class50–53 (compared against two random domain sets; Methods, Supplementary Figures 21 and 23, Supplementary Table 21). Surprisingly, 2201 bacterial proteins that encode 17/64 of the PREPARADOs share ≥40% identity across the entire protein sequence with eukaryotic proteins from plants, PA fungi or PA oomycetes, and therefore likely maintain a similar function (Supplementary Figure 24, Supplementary Table 21-22). The patchy distribution among this class could have resulted from convergent evolution or from cross-kingdom HGT between phylogenetically distant organisms experiencing the shared selective forces of the plant environment.
Seven PREPARADO-containing protein families are characterized by N-terminal eukaryotic or bacterial signal peptides followed by a PREPARADO dedicated to carbohydrate binding or metabolism (Supplementary Table 21). One of these domains, Jacalin, is a mannose-binding lectin domain that is found in 48 genes in the Arabidopsis thaliana genome compared with three genes in the human genome25. Mannose is found on the cell wall of different bacterial and fungal pathogens and could serve as a microbial-associated molecular pattern (MAMP) that is recognized by the plant immune system54–61. We identified a family of ~430 AA long microbial proteins with a signal peptide, followed by a functionally ill-defined endonuclease/exonuclease/phosphatase family domain (pfam03372) and ending with a Jacalin domain (pfam01419). Strikingly, this domain architecture is absent in plants but is distributed across diverse microorganisms, many of which are phytopathogens, including Gram-negative and -positive bacteria, fungi from the Ascomycota and Basidiomycota phyla, and oomycetes (Figure 4). We speculate that these microbial lectins may be secreted to outcompete plant immune receptors for mannose binding on the microbial cell wall, effectively serving as camouflage.
Figure 4. A protein family shared by PA bacteria, fungi, and oomycetes that resemble plant proteins.
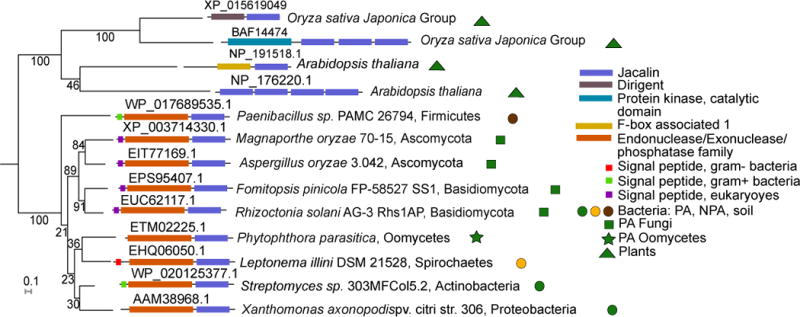
Maximum likelihood phylogenetic tree of representative proteins with Jacalin-like domains across plants and PA organisms. Endonuclease/exonuclease/phosphatase (EEP)-Jacalin proteins are present across PA eukaryotes (fungi and oomycetes) and PA bacteria. In most cases these proteins contain a signal peptide in the N-terminus. The Jacalin-like domain is found in many plant proteins, often in multiple copies. Protein accession appears above each protein illustration.
To conclude, we discovered a large set of protein domains that are shared between plants and the microbes colonizing them. In many cases the entire protein is conserved across evolutionarily distant PA microorganisms.
Co-occurrence of PA gene clusters
We identified numerous cases of PA gene clusters (orthogroups) that demonstrate high co-occurrence between genomes (see URLs). When the PA genes are derived from phylogeny-aware tests (i.e. PhyloGLM and Scoary) they are candidates for inter-taxon HGT events. For example, we identified a cluster predicted by Scoary of up to 11 co-occurring genes (mean pairwise Spearman correlation = 0.81) in a flagellum-like locus from sporadically distributed PA/soil genomes across 12 different genera in Burkholderiales (Figure 5). Two of the annotated flagellar-like proteins, FlgB (COG1815) and FliN (pfam01052), are also PA genes in Actinobacteria1 and Alphaproteobacteria taxa. Six of the remaining genes encode hypothetical proteins, all but one of which are specific to Betaproteobacteria, suggestive of a flagellar structure variant that evolved in this class in the plant environment. Flagellum-mediated motility or flagellum-derived secretion systems (e.g. T3SS) are important for plant colonization and virulence39,40,62,63 and can be horizontally transferred64.
Figure 5. Co-occurring PA/soil flagellum-like gene cluster is sporadically distributed across Burkholderiales.
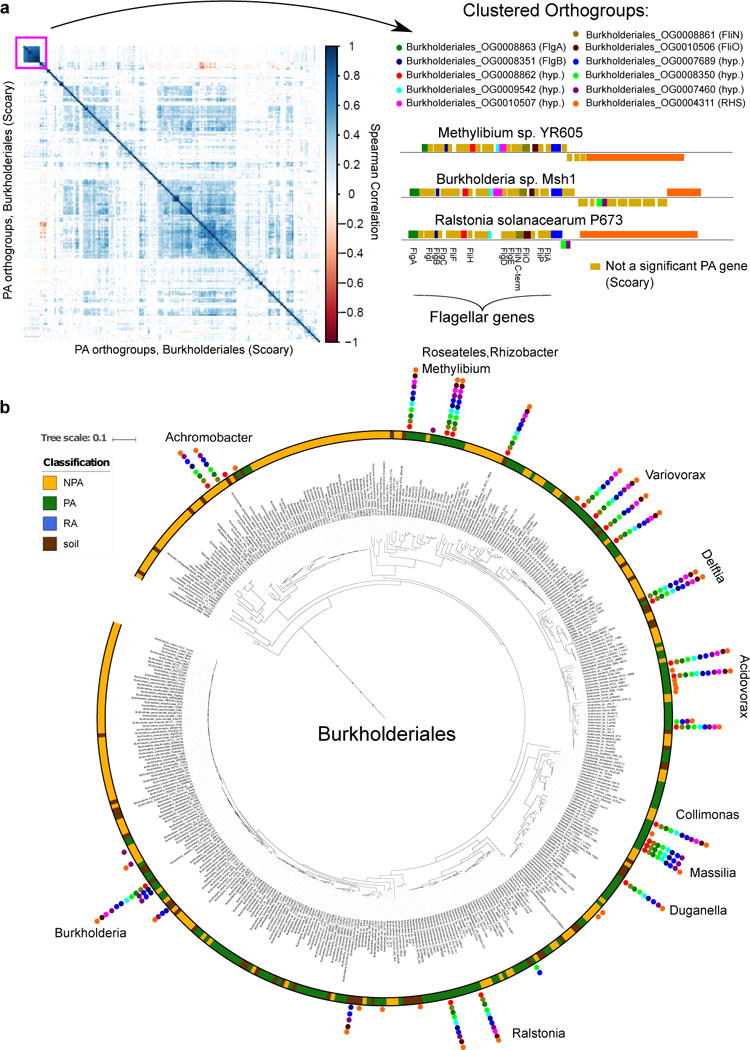
a. Left panel: A hierarchically clustered correlation matrix of all 202 significant PA orthogroups (gene clusters) from Burkholderiales, predicted by Scoary. Right panel: the orthogroups are presented within and adjacent to the flagellar-like locus of different genomes. Gene names based on blast search appears in parentheses. hyp. - a hypothetical protein, RHS - RHS repeat protein. Genes illustrated above and below line are located on the positive and negative strand, respectively. b. The Burkholderiales phylogenetic tree based on the concatenated alignment of 31 single copy genes. Pillars of filled circles represent the 11 orthogroups presented in a, using the same color coding as in a. Genus names are shown next to each pillar.
Novel putative PA and RA gene operons
In addition to successfully capturing several known PA operons (Figure 2c-i), we also identified additional putative PA bacterial operons (see URLs). Two previously uncharacterized PA gene families were conspicuous. The genes are organized in multiple loci in PA genomes, each of up to five tandem gene copies. They encode short, highly divergent and high copy number proteins which are predicted to be secreted, as explained below. Strikingly, these two PA protein families never co-occur in the same genome and their genomic presence is perfectly correlated with pathogenic or non-pathogenic bacterial lifestyles of the genus Acidovorax (order Burkholderiales) (Figure 6a). We named the gene families Jekyll and Hyde for those present in non-pathogens and pathogens, respectively, after the characters in Stevenson’s classic novel.
Figure 6. Rapidly diversifying, high copy-number Jekyll and Hyde PA genes.
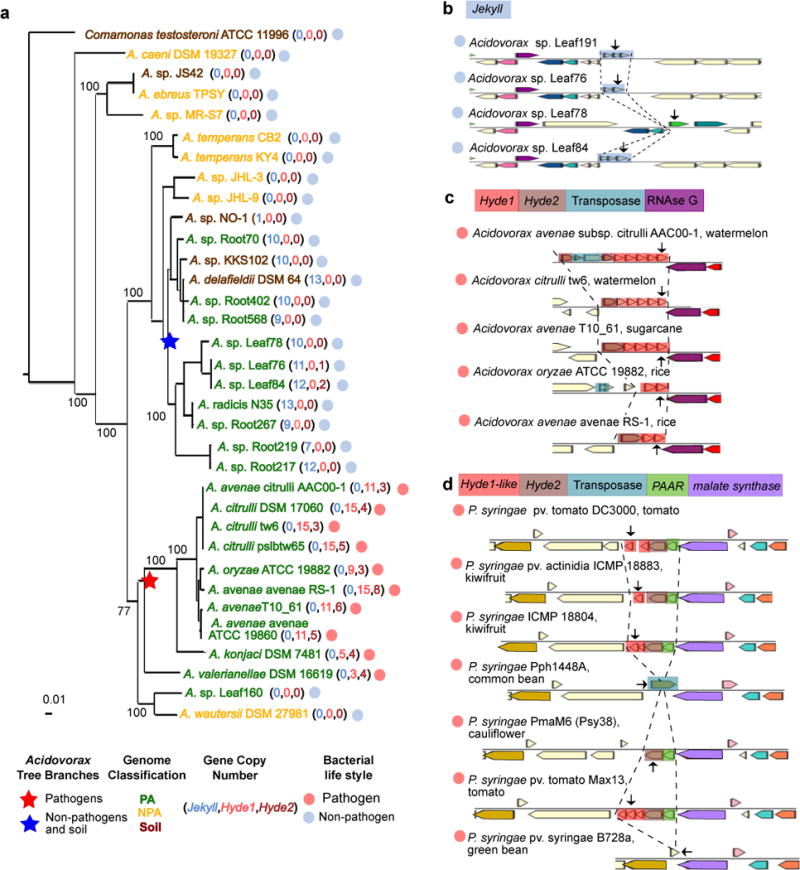
a. Maximum likelihood phylogenetic tree of Acidovorax isolates based on concatenation of 35 single-copy genes. The pathogenic and non-pathogenic branches of the tree are perfectly correlated with the presence of Hyde1 and Jekyll genes, respectively. b. An example of a variable Jekyll locus in highly related Acidovorax species isolated from leaves of wild Arabidopsis from Brugg, Switzerland. Arrows denote the following locus tags (from top to bottom): Ga0102403_10161, Ga0102306_101276, Ga0102307_107159, Ga0102310_10161. c. An example of a variable Hyde locus from pathogenic Acidovorax infecting different plants (host plant appears after species name). The transposase in the first operon fragmented a Hyde2 gene. Arrows denote the following locus tags (from top to bottom): Aave_3195, Ga0078621_123525, Ga0098809_1087148, T336DRAFT_00345, AASARDRAFT_03920. d. An example of a variable Hyde locus from pathogenic Pseudomonas syringae infecting different plants. Arrows denote the following locus tags (from top to bottom): PSPTOimg_00004880 (a.k.a PSPTO_0475), A243_06583, NZ4DRAFT_02530, Pphimg_00049570, PmaM6_0066.00000100, PsyrptM_010100007142, Psyr_4701. Genes colored using the same colors in B-D are homologous with the exception of genes colored in ivory (unannotated genes) and Hyde1 and Hyde1-like genes which are analogous by similar size, high diversification rate, position downstream to Hyde2, and a tendency for having a transmembrane domain. PAAR – proline-alanine-alanine-arginine repeat superfamily.
The typical Jekyll gene is 97 AAs long, contains an N-terminal signal peptide, lacks a transmembrane domain, and in 98.5% of cases appears in non-pathogenic PA or soil-associated Acidovorax isolates (Figure 6a, Supplementary Figure 25d, Supplementary Table 23a). A single genome may encode up to 13 Jekyll gene copies (Figure 6a) distributed in up to nine loci (Supplementary Table 23a). We recently isolated four Acidovorax strains from the leaves of naturally grown Arabidopsis16. Even these nearly identical isolates carry hypervariable Jekyll loci that are substantially more divergent than neighboring genes and include copy number variations and various mutations (Figure 6b, Supplementary Figure 25, Supplementary Table 24).
The Hyde putative operons, on the other hand, are composed of two distinct gene families unrelated to Jekyll. A typical Hyde1 protein has 135 AAs and an N-terminal transmembrane helix. Hyde1 proteins are also highly variable as measured by copy number variation, sequence divergence and intra-locus transposon insertions (Figures 6a, c, Supplementary Figure 26a-c, Supplementary Table 23b). Hyde1 is found in 99% of cases in phytopathogenic Acidovorax. These genomes carry up to 15 Hyde1 gene copies distributed in up to ten loci (Figure 6a, Supplementary Table 23b). In 70% of cases Hyde1 is located directly downstream from a more conserved ~300 AA long PA protein-coding gene that we named Hyde2 (Figure 6c-d, Supplementary Table 23d). We identified loci with Hyde2 followed by Hyde1-like genes in different Proteobacteria. These contain a highly variable Hyde1-like family that only maintains its short length and a transmembrane helix (Supplementary Figure 26d). Hyde-encoding organisms include other phytopathogens, such as Pseudomonas syringae, where the Hyde1-like-Hyde2 locus is again highly variable between closely related strains (Figure 6d, Supplementary Table 23c). However, the striking Hyde genomic expansion is specific to the phytopathogenic Acidovorax lineage (Supplementary Table 23e). Notably, Hyde genes are often directly preceded by genes encoding core structural T6SS proteins, such as PAAR, VgrG, and Hcp65, or fused to PAAR (Figure 6d, Supplementary Figure 27a-b, Supplementary Table 23e). We therefore suggest that Hyde1 and/or Hyde2 might constitute a new T6SS effector family.
The elevated sequence diversity of Jekyll and Hyde1 genes suggests that these two PA protein families could be involved in molecular arms races with other organisms within the plant environment. Since many type VI effectors are used in inter-bacterial warfare, we tested Acidovorax Hyde1 proteins for antibacterial properties. Expression of two variants of the gene in E. coli led to 105-106 fold reduction in cell numbers (Figure 7a, Supplementary Table 25). We constructed a mutant deleted for five Hyde1 loci (Δ5-Hyde1; encompassing 9/11 Hyde1 genes) in the phytopathogen Acidovorax citrulli AAC00-1 (Supplementary Figure 28, Supplementary Table 25). Wild type (WT), Δ5-Hyde1, and T6SS mutant (ΔT6SS) Acidovorax strains were co-incubated with an E. coli strain that is susceptible to T6SS killing66 and nine phylogenetically diverse Arabidopsis leaf bacterial isolates16. Remarkably, survival of wild type E. coli and six of the leaf isolates after co-incubation with WT Acidovorax was reduced 102-106-fold compared to their co-incubation with Δ5-Hyde1 or ΔT6SS Acidovorax (Figure 7b, Supplementary Figure 29, Supplementary Table 25). Combined with the genomic association of Hyde loci with T6SS, these results suggest that the T6SS antibacterial phenotype of Acidovorax is mediated by Hyde proteins and that these toxins are used in competition against other PA organisms. Consistent with a function in microbe-microbe interactions, we did not detect compromised virulence of Δ5-Hyde1 strain on host plants (watermelon; not shown). However, clearing competitors via T6SS can aid in the persistence of Acidovorax citrulli on its host67.
Figure 7. Hyde1 proteins of Acidovorax citrulli AAC00-1 are toxic to E. coli and various PA bacterial strains.
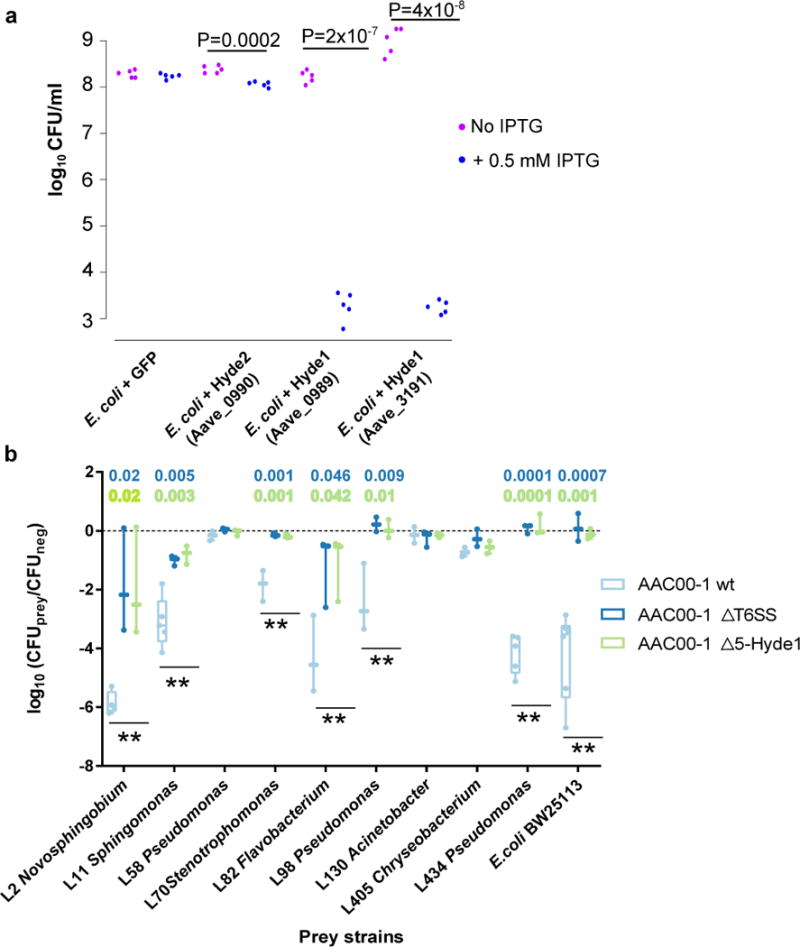
a. Toxicity assay of Hyde proteins expressed in E. coli. GFP, Hyde2 - Aave_0990, and two Hyde1 genes from two loci, Aave_0989 and Aave_3191, were cloned into pET28b and transformed into E. coli C41 cells. Aave_0989 and Aave_3191 proteins are 53% identical. Bacterial cultures from five independent colonies were spotted on LB plate. Gene expression of the cloned genes was induced using 0.5 mM IPTG. P values indicate significant results (two sided t-test). b. Quantification of recovered prey cells after co-incubation with Acidovorax aggressor strains. Antibiotic-resistant prey strains E. coli BW25113 and nine different Arabidopsis leaf isolates were mixed at equal ratios with different aggressor strains or with NB medium (negative control). Δ5-Hyde1 contains deletion of five Hyde1 loci (including nine out of 11 Hyde1 genes). ΔT6SS contains a vasD (Aave_1470) deletion. After co-incubation for 19 hours on NB agar plates, mixed populations were resuspended in NB medium and spotted on selective antibiotic-containing NB agar. Box plots of at least three independent experiments with individual values superimposed as dots are shown. Double asterisks denote a significant difference (one-way ANOVA followed by Tukey’s HSD test) between wild type vs. ΔT6SS, and wild type vs. Δ5-Hyde1, with P values denoted on top. Full strain names and statistical information appear in Supplementary Table 25. For a time course experiment with exemplary strains see Supplementary Figure 29.
Discussion
There is increasing awareness that plant-associated microbial communities play important roles in host growth and health. An understanding of plant-microbe relationships at the genomic level could enable enhancement of agricultural productivity using microbes. Most studies have focused on specific plant microbiomes, with more emphasis on microbial diversity than on gene function12,14,16,18,68–74. Here, we sequenced nearly 500 RA bacterial genomes isolated from different plant hosts. These new genomes were combined in a collection of 3837 high quality bacterial genomes for comparative analysis. We developed a systematic approach to identify PA and RA genes and putative operons. Our method is accurate as reflected by the ability to capture numerous operons previously shown to have a PA function, the enrichment of PA genes in PA metagenomes, the validation of Hyde1 proteins as likely type VI effectors in Acidovorax directed against other PA bacteria, and the validation of two new genes in Paraburkholderia kururiensis that affect rice root colonization. We note that bacterial genes that are enriched in genomes from the plant environment are also likely to play a role in adaptation to the many other organisms that share the same niche, as we demonstrated for Hyde1.
We used five different statistical approaches to identify genes significantly associated with the plant/root environment, each with its advantages and disadvantages. The phylogeny-correcting approaches (phyloglmbin, phyloglmcn, and Scoary) allow accurate identification of genes that are polyphyletic and correlate with an environment independently of ancestral state. Based on our metagenome validation, the hypergeometric test predicts more genes that are abundant in plant-associated communities than Phyloglm. It also enables identification of monophyletic PA genes but yields more false positives than the phylogenetic tests since in every PA lineage, many lineage-specific genes will be considered PA. Scoary is the most stringent method of all and yields the lowest number of predictions (Supplementary Table 18). Future experimental validation should prioritize genes predicted in multiple taxa and/or by multiple approaches (Supplementary Figures 5-6, Supplementary Tables 20, 26).
We discovered 64 PREPARADOs. Proteins containing 19 of these domains are predicted to be secreted by Sec or T3SS (Supplementary Table 21). Notably, plant proteins carrying 35 of these domains belong to the NLR class of intracellular innate immune receptors (Supplementary Figure 23, Supplementary Table 21). Hence, these PREPARADO protein domains may serve as molecular mimics. Some may interfere with plant immune functions through disruption of key plant protein interactions75,76. Likewise the Jacalin-containing proteins we detected in PA bacteria, fungi and oomycetes may represent a strategy of avoiding MAMP-triggered immunity by binding to extracellular microbial mannose molecules, thereby serving as a molecular invisibility cloak77,78.
Finally, we demonstrated that numerous PA functions are surprisingly consistent across phylogenetically-diverse bacterial taxa and that some functions are even shared with PA eukaryotes. Some of these traits may facilitate plant colonization by microbes and therefore might prove useful in genome engineering of agricultural inoculants to eventually yield a more efficient and sustainable agriculture.
Online Methods
More method descriptions appear in Supplementary Information section.
Bacterial isolation and genome sequencing
Detailed isolation procedure appears in the Supplemetary Information. Bacterial strains from Brassicaceae and Poplar were isolated using previously described protocols79,80. Poplar strains were cultured from root tissues collected from Populus deltoides and Populus trichocarpa trees in Tennessee, North Carolina, and Oregon. Root samples were processed as described previously15,81. Briefly, rhizosphere strains were isolated by plating serial dilutions of root wash, while for endosphere strains, surface sterilized roots were pulverized with a sterile mortar and pestle in 10 mL of MgSO4 (10 mM) solution followed by plating serial dilutions. Strains were isolated on R2A agar media, and resulting colonies were picked and re-streaked a minimum of three times to ensure isolation. Isolated strains were identified by 16S rDNA PCR followed by Sanger sequencing.
For maize isolates, we selected soils associated with Il14h and Mo17 maize genotypes grown in Lansing, NY and Urbana, IL. The rhizosphere soil samples of each maize genotype were grown at each location and were collected at week 12 as previously described68. From each rhizosphere soil sample, soil was washed and samples were plated onto Pseudomonas Isolation Agar (BD Diagnostic Systems). The plates were incubated at 30°C until colonies formed and DNA was extracted from cells.
For isolation of single cells, A. thaliana accessions Col-0 and Cvi-0 were grown to maturity. Roots were washed in distilled water multiple times. Root surfaces were sterilized using bleach. Surfaced sterilized roots were then ground using a sterile mortar and pestle. Individual cells were isolated using FACS followed by DNA amplification using MDA, and 16S rDNA screening as described previously82.
DNA from isolates and single cells was sequenced using NGS platforms, mostly using the Illumina HiSeq technology (Supplementary Table 3). Sequenced genomic DNA was assembled using different assembly methods (Supplementary Table 3). Genomes were annotated using the DOE-JGI Microbial Genome Annotation Pipeline (MGAP v.4)23 and were deposited at the IMG database83, ENA or Genbank for public usage.
Data compilation of 3837 isolate genomes and their isolation sites metadata
We retrieved 5586 bacterial genomes from the IMG system (See URLs, Supplementary Table 1). Isolation sites were identified through a manual curation process that included scanning of IMG metadata, DSMZ, ATCC, NCBI Biosample (see URLs), and the scientific literature. Based on its isolation site, each genome was labeled as one of PA, NPA, or soil. PA organisms were also labeled as RA when isolated from the EC or from the rhizoplane. We applied a stringent quality control to ensure a high quality and minimally biased set of genomes:
Known isolation site - genomes with missing isolation site information were filtered out.
High genome quality and completeness – all isolate genomes passed this filter if N50 was larger than 50,000 bp. Single amplified genomes passed the quality filter if they had at least 90% of 35 universal single copy COGs84. In addition, CheckM85 was used to assess isolate genome completeness and contamination. Only genomes that were at least 95% complete and no more than 5% contaminated were used.
High quality gene annotation – genomes that passed this filter had at least 90% of genome sequence coding for genes with an exceptions: in Bartonella genus most genomes have coding base percentages below 90%.
Non-redundancy – We computed whole genome average nucleotide identity (gANI) and alignment fraction (AF) values for each pair of genomes86. When AF exceeded 90% and gANI was higher than 99.995% we considered the genome pair redundant. In such cases one genome was randomly selected and the other genome was marked as “redundant” and was filtered out.
Consistency in the phylogenetic tree – we filtered out 14 bacterial genomes that showed discrepancy between their given taxonomy and their actual phylogenetic placement in the bacterial tree.
Bacterial genome tree construction
To generate a bacterial phylogenetic tree of the 3837 high-quality and non-redundant genomes, we retrieved 31 universal single copy genes from each genome using AMPHORA287. For each individual marker gene we constructed an alignment using Muscle with default parameters. We masked the 31 alignments using Zorro88 and filtered the low quality columns of the alignment. Finally, we concatenated the 31 alignments into an overall merged alignment from which we built an approximately-maximum-likelihood phylogenetic tree using the WAG model implemented in FastTree 2.189. Trees of each taxon are provided in Dataset S5 (see URLs).
Clustering of 3837 genomes into nine taxa
The dataset was divided into different taxa (taxonomic groups) in order to allow downstream identification of genes enriched in the PA or RA genomes of each taxon over the NPA or soil genomes from the same taxon, respectively. In order to determine the number of taxonomic groups to analyze, we converted the phylogenetic tree into a distance matrix using the cophenetic function implemented in the R package ape (see URLs). We then clustered the 3837 genomes into 9 groups using k-medoids clustering as implemented in the partitioning around medoids (PAM) algorithm from the R package fpc (see URLs). k-medoids clusters a data set of n objects into k a priori defined clusters. In order to identify the optimal k for the dataset, we compared the silhouette coefficient for values of k ranging from 1 to 30. A value of k=9 was selected as it yielded the maximal average silhouette coefficient (0.66). In addition, when using a k=9 the taxa were monophyletic, contained hundreds of genomes, and were relatively balanced between PA and NPA genomes in most taxa (Table 1). The resulting genome clusters generally overlap with annotated taxonomic units. One exception is in the Actinobacteria phylum. Here our clustering divided the genomes into two taxa that we named for simplicity “Actinobacteria 1” and “Actinobacteria 2”. However, our rigorous phylogenetic analysis supports previous suggestions for revisions in the taxonomy of phylum Actinobacteria90.
In addition, the tree revealed very divergent bacterial taxa in the Bacteroidetes phylum that cannot be separated into monophyletic groups. Specifically, the Sphingobacteriales order (from Class Sphingobacteria) and the Cytophagaceae (from class Cytophagia) are paraphyletic. Therefore, we decided to unify all Bacteroidetes into one phylum-level taxon. Analysis of the nine taxa prevalence in 16S and metagenome appears in the Supplementary Information.
Pangenome analysis
For each comparison in Supplementary Figure 2, a random set of ten genomes from each environment (PA and NPA from specific environments) was selected and the mean and standard deviation of phylogenetic distance in the set were calculated. This step was repeated 50 times to get two random sets of genomes (PA and NPA) that were comparable and had minimum differences between their mean and standard deviation of phylogenetic distances. Genes for pangenome analysis were taken from the orthogroups (see below). Core genome, accessory genome, and unique genes were defined as genes that appeared in all 10 genomes, 2-9 genomes, or only one genome, respectively. For core and accessory genome, the median copy number in each relevant orthogroup was used.
Genome size comparison and gene categories enrichment analysis
Genome sizes were retrieved from the IMG database (see URLs) and were compared using t-test and Phyloglm26. Kernel density plots from the R sm package (see URLs) were used to prepare Supplementary Figure 1. Protein coding genes were retrieved and mapped to COG IDs using the program RPS-BLAST at an e-value cutoff of 1e–2 and an alignment length of minimum 70% of the consensus sequence length. Each COG ID is mapped to at least one COG category (Supplementary Table 6). For each genome, we counted the number of genes from a given category. A t-test and PhyloGLM test were used to compare the number of genes in the genomes sharing the same taxon and category but different labels (e.g. PA vs. NPA).
Benchmarking gene clustering using UCLUST and Orthofinder
We computed clusters of coding sequences (CDS) across each of the nine taxa defined above using two algorithms: UCLUST91 (v 7.0) and Orthofinder24 (v 1.1.4). UCLUST was run using 50% identity and 50% coverage in the target to call the clusters. Command used: usearch7.0.1090_i86linux64 -cluster_fast <input_file> -id 0.5 -maxaccepts 0 -maxrejects 0 -target_cov 0.5 –uc <output_file>. To improve pairwise alignment performance, we used the accelerated protein alignment algorithm implemented in Diamond92 (v 0.8.36.98) with –very-sensitive option in the Diamond blastp algorithm. After computing the alignments, we ran Orthofinder with default parameters. See URLs for the scripts utilized to compute the orthogroups.
Supplementary Figure 5 shows benchmarking of Orthofinder against UCLUST. In order to estimate the quality of the clusters output by UCLUST and Orthofinder, we mapped the proteins from our datasets to the curated set of taxon markers from Phyla Amphora93. Next, we compared the distribution of each of the taxon-specific markers identified by Phyla_Amphora across the clusters output by UCLUST and Orthofinder. To compare the two approaches, we estimated two metrics: the purity and fragmentation index, explained in Supplementary Figure 5 and in the Supplementary Information.
Identification of PA, NPA, RA and soil genes/domains
The following description applies to PA, NPA, RA, and soil genes. For text conciseness, only PA genes are described here. PA genes were identified using a two-step process that includes protein/domain clustering based on AA sequence similarity and subsequent identification of the protein/domain clusters significantly enriched in protein/domains from PA bacteria (Supplementary Figure 4). Clustering of genes and protein domains involved five independent methods: Orthofinder24, COG20, Kegg orthology (KO)21, TIGRFAM22, and Pfam25. Orthofinder was selected (following the aforementioned benchmarking) as a clustering approach that included all proteins, including those that lack any functional annotation. We first compiled, for each taxon separately, a list of all proteins in the genomes. For COG, KO, TOGRFAM, and Pfam, we used the existing annotations of IMG genes that are based on blast alignments to the different protein/domain models23. This process yielded gene/domain clusters. Next, we tested which clusters were significantly enriched with genes derived from PA genomes. These clusters were termed ‘PA clusters’. In the statistical analysis, we used only clusters of more than five members. We corrected P values with Benjamini-Hochberg FDR and used q<0.05 as significance threshold, unless stated differently. The proteins in each cluster were categorized as either PA or NPA, based on the label of its encoding genome.
The three main approaches were the hypergeometric test (“Hyperg”), PhyloGLM, and Scoary. Hyperg looks for overall enrichment of gene copies across a group of genomes but ignores the phylogenetic structure of the dataset. PhyloGLM26 takes into account phylogenetic information to eliminate apparent enrichments that can be explained by shared ancestry. The Hyperg and PhyloGLM tests were used in two versions; based on either gene presence/absence data (hypergbin, phyloglmbin) or gene copy number data (hypergcn, phyloglmcn). We also used a stringent version of Scoary27, a gene presence/absence approach that combines the Fisher exact test, a phylogenetic test, and a label-permutation test. The first hypergeometric test, hypergcn, used the gene copy number data with the cluster being the sample, the total number of PA and NPA genes being the population, and the number of PA genes within the cluster being considered as ‘successes’. The second version, hybergbin, used gene presence/absence data. p-values were corrected using Benjamini-Hochberg FDR94 for clusters of COG/KO/TIGRFAM/Pfam. For the abundant Orthofinder clusters we used the Bonferroni correction with a threshold of P<0.1 since downstream validation using metagenomes showed less false positives with the more significant clusters. The third and fourth statistical approaches used were Phyloglm26, implemented in the phylolm (v 2.5) R package (see URLs). PhyloGLM combines a Markov process of lifestyle (e.g. PA vs NPA) evolution with a regularized logistic regression. This approach takes advantage of the known phylogeny to specify the residual correlation structure between genomes that share common ancestry, and so it does not need to make the incorrect assumption that observations are independent. Intuitively PhyloGLM favors genes found in multiple lineages of the same taxon. For each taxon we used the subtree from Figure 1a to estimate the correlation matrix between observations and used the copy number (in phyloglmcn) or presence/absence pattern (in phyloglmbin) of each gene as the only independent variable. Positive and negative estimates in phyloglmbin/phyloglmcn means PA/RA and NPA/soil protein/domains, respectively.
Finally, the fifth statistical approach is Scoary27 which uses a gene presence/absence dataset. Scoary combines Fisher exact test, a phylogeny-aware test, and an empirical label-switching permutation analysis. A gene cluster was considered significant by Scoary only if: 1. It had a q-value below 0.05 for the Fisher exact test, 2. The “worst” p-value from the pairwise comparison algorithm is below 0.05, and 3. The empirical (permutation-based) p-value is lower than 0.05. These are very stringent criteria that yield relatively few significant predictions. Odds ratio above or below 1 in Scoary means PA/RA and NPA/soil protein/domains, respectively.
See URLs for the code used for the gene enrichment tests. Explanation about additional assessment of PA/NPA prediction robustness using validation genome datasets appears in the Supplementary Information.
Validation of predicted PA, NPA, RA, and soil genes using metagenomes
Metagenome samples (n=38, Supplementary Table 16) were downloaded from NCBI and GOLD (see URLs). The reads were translated into proteins and proteins of at least 40 aa long were aligned using HMMsearch95 against the different protein references. The protein references included the predicted PA, RA, soil, and NPA proteins from Orthofinder found significant by the different approaches. Normalization process is explained in Supplementary Figures 12-16.
Principal Coordinates Analysis
In order to visualize the overall contribution of statistically significant enriched/depleted orthogroups to the differentiation of PA and NPA genomes, we utilized PCoA and logistic regression. For each of the nine taxa analyzed, we ran this analysis over a collection of matrices. The first matrix was the full pan genome matrix; this matrix depicts the distribution of all the orthogroups contained across all the genomes in a given taxon. The subsequent matrices represent subsets of the full pan genome matrix, each of these matrices depict the distribution of only the statistically significant orthogroups as called by one of the five different algorithms utilized to test for the genotype-phenotype association. Full description of this process appears in the Supplementary Information.
We used the function cmdscale from the R (v 3.3.1) stats package to run PCoA over all the matrices described above using the Canberra distance as implemented in the vegdist function from the vegan (v 2.4-2) R package (see URLs). Then, we took the first two axes output from the PCoA and used them as independent variables to fit a logistic regression over the labels of each genome (PA, NPA). Finally, we computed the Akaike Information Criteria (AIC) for each of the different models fitted. Briefly, the AIC estimates how much information is lost when a model is applied to represent the true model of a particular dataset. See URLs for the scripts used to perform the PCoA.
Validation of PA genes in Paraburkholderia kururiensis M130 affecting rice root colonization
Growth and transformation details of Paraburkholderia kururiensis M130 are described in the Supplementary Information.
Mutant Construction
Internal fragments of 200-900 bp from each gene of interest were PCR amplified by using the primers listed in Supplementary Table 17c. Fragments were first cloned in the pGem2T easy vector (Promega) and sequenced (GATC Biotech; Germany), then excised with EcoRI restriction enzyme and cloned in the corresponding site in pKNOCK Km R96. These plasmids were then used as a suicide delivery system in order to create the knockout mutants and transferred to P. kururiensis M130 by triparental mating. All the mutants were verified by PCR using primers specific to the pKNOCK-Km vector and to the genomic DNA sequences upstream and downstream from the targeted genes.
Rhizosphere colonization experiments with P. kururiensis and mutant derivatives
Seeds of Oryza sativa (BALDO variety) were surface sterilized and were left to germinate in sterile conditions at 30° C in the dark for seven days. Each seedling was then aseptically transferred into a 50 mL Falcon tube containing 35 mL of half strength Hoagland solution semisolid substrate (0.4% agar). The tubes were then inoculated with 107 cfu of a P. kururiensis suspension. Plants were grown for eleven days at 30° C (16-8 h light-dark cycle). For the determination of the bacterial counts, plants were washed under tap water for 1 min and then cut below the cotyledon to excise the roots. Roots were air dried for 15 min, weighed and then transferred to a sterile tube containing 5 mL of PBS. After vortexing, the suspension was serially diluted to 10−1 and 10−2 in PBS and aliquots were plated on KB plates containing the appropriate antibiotic (Rif 50 μg/mL for the wt, Rif 50 μg/mL and Km 50 μg/mL for the mutants). After three days incubation at 30° C, cfu were counted. Three replicates for each dilution from ten independent plantlets were used to determine the average cfu values.
Plant mimicking PA and RA proteins (PREPARADOs)
Supplementary Figure 21 summarizes the algorithm used to find Plant mimicking PA and RA proteins. Pfam25 version 30.0 metadata was downloaded. Protein domains that appear in both Viridiplantae and bacteria and occur at least twice more frequently in Viridiplantae than in bacteria were considered as plant-like domains (n=708). In parallel, we scanned the set of significant PA, RA, NPA, soil Pfam protein domains predicted by the five algorithms in the nine taxa. We compiled a list of domains that were significant PA/RA in at least four tests, and significant NPA/soil in up to two tests (n=1779). The overlap between the first two sets was defined as PREPARADOs (n=64). In parallel, we created two control sets of 500 random plant-like Pfam domains and 500 random PA/RA Pfam domains. Enrichment of PREPARADOs integrated into plant NLR proteins in comparison to the domains in the control groups was tested using the Fisher exact test. In order to identify domains found in plant disease resistance proteins, all proteins were retrieved from Phytozome and BrassicaDB (see URLs). To identify domains in plant disease resistance proteins, we used hmmscan to search protein sequences for the presence of either NB-ARC (PF00931.20), TIR (PF01582.18), TIR_2 (PF13676.4), or RPW8 (PF05659.9) domains. Bacterial proteins carrying the PREPARADO domains were considered as having full-length identity to fungal, oomycete or plant proteins based on LAST alignments to all Refseq proteins of plants, fungi, and protozoa. Full-length is defined as an alignment length of at least 90% of the length of both query and reference proteins. The threshold used for considering a high amino acid identity was 40%. Explanation about prediction of secretion of proteins with PREPARADOs appears in the Supplementary Information.
Prediction of PA, NPA, RA, and soil operons and their annotation as Biosynthetic Gene Clusters
Significant PA, NPA, RA, and soil genes of each genome were clustered based on genomic distance: genes sharing the same scaffold and strand that were up to 200 bp apart were clustered into the same predicted operon. We allowed up to one spacer gene, which is a non-significant gene, between each pair of significant genes within an operon. Operons were predicted for the genes in COG and OrthoFinder clusters using all five approaches. Operons were annotated as Biosynthetic Gene Clusters (BGCs) if at least one of the constituent genes was part of a BGC from the IMG-ABC database97.
Jekyll and Hyde analyses
To find all homologs and paralogs of Jekyll and Hyde genes, we used IMG blast search with an e value threshold of 1e-5 against all IMG isolates. Hyde1 homologs of Acidovorax, Hyde1 homologs of Pseudomonas, Hyde2, and Jekyll genes were searched using proteins of genes Aave_1071, A243_06583, Ga0078621_123530, and Ga0102403_10160 as the query sequence, respectively. Multiple sequence alignments were done using Mafft98. A phylogenetic tree of Acidovorax species was produced using RaxML99 based on concatenation of 35 single copy genes110.
Hyde1 toxicity assay
To verify the toxicity of Hyde1 and Hyde2 proteins to E. coli, genes encoding proteins Aave_0990 (Hyde2), Aave_0989 (Hyde1) and Aave_3191 (Hyde1) or GFP as a control, were cloned to the inducible pET28b expression vector using the LR reaction. The recombinant vectors were transformed into E. coli C41 competent cells using electroporation after sequencing validation. Five colonies were selected and cultured in LB liquid media supplemented with kanamycin with shaking overnight. OD600 of the bacteria culture was adjusted to 1.0 and then diluted by 102, 104, 106 and 108 times successively. Bacteria culture gradients were spotted (5 μL) on LB plates with or without 0.5 mM IPTG to induce gene expression.
Construction of Δ5-Hyde1 strain
Detailed construction of Δ5-Hyde1 strain appears in the Supplementary Information. Acidovorax citrulli strain AAC00-1 and its derived mutants were grown on nutrient agar medium supplemented with rifampicin (100 μg/ml). To delete a cluster of five Hyde1 genes (Aave_3191-3195), we performed a marker-exchange mutagenesis as previously described101. The marker-free mutant was designated as Δ1-Hyde1, and its genotype was confirmed by PCR amplification and sequencing. The marker-exchange mutagenesis procedure was repeated to further delete four Hyde1 loci (Supplementary Figure 28). Primers used are listed in Supplementary Table 25. The final mutant with deletion of 9 out of 11 Hyde1 genes (in five loci) was designated as Δ5-Hyde1 and was used for competition assay. ΔT6SS mutant was received from Ron Walcott’s lab.
Competition assay of Acidovorax citrulli AAC00-1 against different strains
Bacterial strains
E. coli BW25113 pSEVA381 was grown aerobically in LB broth (5 g/L NaCl) at 37°C in presence of chloramphenicol. Naturally antibiotic resistant bacterial leaf isolates16 and Acidovorax strains were grown aerobically in NB medium (5 g/L NaCl) at 28°C in presence of the appropriate antibiotic. Antibiotic resistance and concentrations used in the competition assay are mentioned in Supplementray Table 25.
Competition Assay
Competition assays were conducted similarly as described elsewhere66,102. Briefly, bacterial overnight cultures were harvested and washed in PBS (pH 7.4) to remove excess antibiotics and resuspended in fresh NB medium to an optical density of 10. Predator and prey strains were mixed at 1:1 ratio and 5 μL of the mixture was spotted onto dry NB agar plates and incubated at 28°C. As a negative control, the same volume of NB medium was mixed with prey cells instead of the predator strain. After 19h of co-incubation, bacterial spots were excised from the agar and resuspended in 500 μL NB medium and were spotted on NB agar containing antibiotic selective for the prey strains. CFUs of recovered prey cells were determined after incubation at 28°C. All assays were performed in at least three biological replicates.
Data Availability Statement
All new genomes (Supplementary Table 3) were submitted and are publicly available in at least one of the following databanks (see accessions in Supplementary Table 3):
A dedicated website: http://labs.bio.unc.edu/Dangl/Resources/gfobap_website/index.html
The dedicated website contains nucleotide and AA fasta files of all datasets used, protein/domain annotations (COG, KO, TiGRfam, Pfam), metadata, phylogenetic trees, OrthoFinder orthogroups, Orthogroups HMMs, full enrichment datasets, correlation between orthogroups, and predicted operons (see URLs).
Different scripts that were used in analysis appear in the URLs section.
Full genome sequence, gene annotation, and metadata of each genome used can be found in IMG website https://img.jgi.doe.gov/. For example the metadata of taxon id 2558860101 can be found in: https://img.jgi.doe.gov/cgi-bin/mer/main.cgi?section=TaxonDetail&page=taxonDetail&taxon_oid=2558860101.
Supplementary Material
Acknowledgments
The work conducted by the U.S. Department of Energy Joint Genome Institute, a DOE Office of Science User Facility, is supported by the Office of Science of the U.S. Department of Energy under Contract No. DE-AC02-05CH11231. J.L.D and S.G.T were supported by NSF INSPIRE grant IOS-1343020 and J.L.D. was also supported by DOE-USDA Feedstock Award DE-SC001043 and by the Office of Science (BER), U.S. Department of Energy, Grant no. DE-SC0014395. S.H.P was supported by NIH Training Grant T32 GM067553-06 and was a Howard Hughes Medical Institute International Student Research Fellow. D.S.L was supported by NIH Training Grant T32 GM07092-34. J.L.D is an Investigator of the Howard Hughes Medical Institute, supported by the HHMI and the Gordon and Betty Moore Foundation (GBMF3030). M.E.F was supported by NIH Dr. Ruth L. Kirschstein NRSA Fellowships F32-GM112345. D.A.P. and T-Y Lu were supported by the Genomic Science Program, U.S. Department of Energy, Office of Science, Biological and Environmental Research as part of the Oak Ridge National Laboratory Plant Microbe Interfaces Scientific Focus Area (http://pmi.ornl.gov) and Plant Feedstock Genomics Award DE-SC001043. Oak Ridge National Laboratory is managed by UT-Battelle, LLC, for the U.S. Department of Energy under contract DE-AC05-00OR22725. J.A.V. was supported by a SystemsX.ch grant (Micro2X) and an European Research Council (ERC) advanced grant (PhyMo). We thank Iris Bertani, Cristina Bez, Robert Bowers, David Burstein, Ai Chun Chen, Dawn Chiniquy, Ben Cole, Ofir Cohen, Alex Copeland, Jonathan Eisen, Emiley Eloe-Fadrosh, Michalis Hadjithomas, Omri Finkel, Hana Schnitzel Fux, Natalia Ivanova, Joey Knelman, Rex Malmstrom, Rosalba Perez-Torres, Dor Salomon, Rotem Sorek, Tatiana Mucyn, Rekha Seshadri, TK Reddy, Liz Ryan, Hila Sberro Livnat, and Ron Walcott for general help, text editing, and providing materials and ideas to this work.
Footnotes
Author Contributions
AL performed most of data analysis and wrote the paper. ISG performed phylogenetic inference, performed phylogenetically aware analyses, analyzed the data, provided the supporting website, and contributed to writing the paper. MMi and JAV designed and performed experiments related to Hyde1 gene function and contributed to writing the paper. SC isolated single bacterial cells and prepared metadata for data analysis. FM analyzed data. SHP analyzed data and contributed to writing the paper. JM produced a mutant strain for Hyde1. KW tested Hyde1 toxicity in E. coli. GD and VV produced deletion mutants and designed and performed rice root colonization experiments. KS helped in data analysis. BRA prepared metadata for data analysis. DSL, TL, SL, ZJ, MMc, APK, MEF and SLD isolated bacteria from different plants or managed this process. TGR managed the sequencing project. SRG, DAP and REL managed bacterial isolation efforts and contributed to writing the paper. BZ managed Hyde1 deletion and its toxicity testing. SGT contributed to writing the paper. TW managed single cell isolation effort and contributed to writing the paper. JLD directed the overall project and contributed to writing the paper.
URLs
ITOL Interactive tree (Figure 1a): https://itol.embl.de/tree/15223230182273621508772620
Datasets in a dedicated website:
http://labs.bio.unc.edu/Dangl/Resources/gfobap_website/index.html
Dataset 1: FNA- Nucleotide fasta files of the 3837 genomes
Dataset 2: FAA - fasta of all protein used in the analysis
Dataset 3: COG/KO/Pfam/TIGRFAM IMG annotations of all genes used in analysis.
Dataset 4: Metadata of all genomes
Dataset 5: Phylogenetic trees of each of the nine taxa.
Dataset 6: Pangenome matrices
Dataset 7: Pangeneome dataframes
Dataset 8: OrthoFinder Orthogroups fasta files.
Dataset 9: Mafft MSA of all Orthogroups.
Dataset 10: HMMs of all Orthogroups.
Dataset 11: PA/NPA, RA/soil enrichment tables
Dataset 12: Correlation matrices
Dataset 13: Predicted operons
DSMZ: https://www.dsmz.de/
ATCC: https://www.atcc.org/
NCBI Biosample: https://www.ncbi.nlm.nih.gov/biosample/
IMG: https://img.jgi.doe.gov/cgi-bin/mer/main.cgi
GOLD: https://gold.jgi.doe.gov/
Phytozome: https://phytozome.jgi.doe.gov/pz/portal.html
BrassicaDB: http://brassicadb.org/brad/
R packages
sm: http://www.stats.gla.ac.uk/~adrian/sm
vegan: https://cran.r-project.org/web/packages/vegan/index.html
ape: https://cran.r-project.org/web/packages/ape/ape.pdf
fpc: https://cran.r-project.org/web/packages/fpc/index.html
phylolm: https://cran.r-project.org/web/packages/phylolm/index.html
Scripts utilized to compute the orthogroups: https://github.com/isaisg/gfobap/tree/master/orthofinder_diamond.
Scripts used to run the gene enrichment tests: https://github.com/isaisg/gfobap/tree/master/enrichment_tests.
Scripts used to perform the PCoA can be found in: https://github.com/isaisg/gfobap/tree/master/pcoa_visualization_ogs_enriched
References for main text
- 1.Ley RE, et al. Evolution of mammals and their gut microbes. Science. 2008;777:1647–1651. doi: 10.1126/science.1155725. [DOI] [PMC free article] [PubMed] [Google Scholar]
- 2.Baumann P. Biology of bacteriocyte-associated endosymbionts of plant sap-sucking insects. Annu Rev Microbiol. 2005;59:155–189. doi: 10.1146/annurev.micro.59.030804.121041. [DOI] [PubMed] [Google Scholar]
- 3.Sprent JI. 60Ma of legume nodulation. What’s new? What’s changing? J Exp Bot. 2008;59:1081–1084. doi: 10.1093/jxb/erm286. [DOI] [PubMed] [Google Scholar]
- 4.Pfeilmeier S, Caly DL, Malone JG. Bacterial pathogenesis of plants: future challenges from a microbial perspective. Mol Plant Pathol. 2016;17:1298–1313. doi: 10.1111/mpp.12427. [DOI] [PMC free article] [PubMed] [Google Scholar]
- 5.Chowdhury SP, Hartmann A, Gao X, Borriss R. Biocontrol mechanism by root-associated Bacillus amyloliquefaciens FZB42 – a review. Front Microbiol. 2015;6:780. doi: 10.3389/fmicb.2015.00780. [DOI] [PMC free article] [PubMed] [Google Scholar]
- 6.Fibach-Paldi S, Burdman S, Okon Y. Key physiological properties contributing to rhizosphere adaptation and plant growth promotion abilities of Azospirillum brasilense. FEMS Microbiol Lett. 2012;326:99–108. doi: 10.1111/j.1574-6968.2011.02407.x. [DOI] [PubMed] [Google Scholar]
- 7.Santhanam R, et al. Native root-associated bacteria rescue a plant from a sudden-wilt disease that emerged during continuous cropping. Proc Natl Acad Sci U S A. 2015;112:E5013–20. doi: 10.1073/pnas.1505765112. [DOI] [PMC free article] [PubMed] [Google Scholar]
- 8.Peters NK, Frost JW, Long SR. A plant flavone, luteolin, induces expression of Rhizobium meliloti nodulation genes. Science. 1986;233:977–80. doi: 10.1126/science.3738520. [DOI] [PubMed] [Google Scholar]
- 9.Hiei Y, Ohta S, Komari T, Kumashiro T. Efficient transformation of rice (Oryza sativa L) mediated by Agrobacterium and sequence analysis of the boundaries of the T-DNA. Plant J. 1994;6:271–82. doi: 10.1046/j.1365-313x.1994.6020271.x. [DOI] [PubMed] [Google Scholar]
- 10.Hueck CJ. Type III protein secretion systems in bacterial pathogens of animals and plants. Microbiol Mol Biol Rev. 1998;62:379–433. doi: 10.1128/mmbr.62.2.379-433.1998. [DOI] [PMC free article] [PubMed] [Google Scholar]
- 11.Bulgarelli D, et al. Revealing structure and assembly cues for Arabidopsis root-inhabiting bacterial microbiota. Nature. 2012;488:91–5. doi: 10.1038/nature11336. [DOI] [PubMed] [Google Scholar]
- 12.Lundberg DS, et al. Defining the core Arabidopsis thaliana root microbiome. Nature. 2012;488:86–90. doi: 10.1038/nature11237. [DOI] [PMC free article] [PubMed] [Google Scholar]
- 13.Bulgarelli D, Schlaeppi K, Spaepen S, Ver Loren van Themaat E, Schulze-Lefert P. Structure and functions of the bacterial microbiota of plants. Annu Rev Plant Biol. 2013;64:807–38. doi: 10.1146/annurev-arplant-050312-120106. [DOI] [PubMed] [Google Scholar]
- 14.Ofek-Lalzar M, et al. Niche and host-associated functional signatures of the root surface microbiome. Nat Commun. 2014;5:4950. doi: 10.1038/ncomms5950. [DOI] [PubMed] [Google Scholar]
- 15.Gottel NR, et al. Distinct microbial communities within the endosphere and rhizosphere of Populus deltoides roots across contrasting soil types. Appl Environ Microbiol. 2011;77:5934–5944. doi: 10.1128/AEM.05255-11. [DOI] [PMC free article] [PubMed] [Google Scholar]
- 16.Bai Y, et al. Functional overlap of the Arabidopsis leaf and root microbiota. Nature. 2015;528:364–369. doi: 10.1038/nature16192. [DOI] [PubMed] [Google Scholar]
- 17.Hardoim PR, et al. The hidden world within plants: ecological and evolutionary considerations for defining functioning of microbial endophytes. Microbiol Mol Biol Rev. 2015;79:293–320. doi: 10.1128/MMBR.00050-14. [DOI] [PMC free article] [PubMed] [Google Scholar]
- 18.Bulgarelli D, et al. Structure and function of the bacterial root microbiota in wild and domesticated barley. Cell Host Microbe. 2015;17:392–403. doi: 10.1016/j.chom.2015.01.011. [DOI] [PMC free article] [PubMed] [Google Scholar]
- 19.Hacquard S, et al. Microbiota and host nutrition across plant and animal kingdoms. Cell Host Microbe. 2015;17:603–616. doi: 10.1016/j.chom.2015.04.009. [DOI] [PubMed] [Google Scholar]
- 20.Tatusov RL, Galperin MY, Natale DA, Koonin EV. The COG database: a tool for genome-scale analysis of protein functions and evolution. Nucleic Acids Res. 2000;28:33–6. doi: 10.1093/nar/28.1.33. [DOI] [PMC free article] [PubMed] [Google Scholar]
- 21.Kanehisa M, Sato Y, Kawashima M, Furumichi M, Tanabe M. KEGG as a reference resource for gene and protein annotation. Nucleic Acids Res. 2016;44:D457–D462. doi: 10.1093/nar/gkv1070. [DOI] [PMC free article] [PubMed] [Google Scholar]
- 22.Haft DH, Selengut JD, White O. The TIGRFAMs database of protein families. Nucleic Acids Res. 2003;31:371–3. doi: 10.1093/nar/gkg128. [DOI] [PMC free article] [PubMed] [Google Scholar]
- 23.Huntemann M, et al. The standard operating procedure of the DOE-JGI Microbial Genome Annotation Pipeline (MGAP v. 4) Stand Genomic Sci. 2015:1–6. doi: 10.1186/s40793-015-0077-y. [DOI] [PMC free article] [PubMed] [Google Scholar]
- 24.Emms DM, Kelly S. OrthoFinder: solving fundamental biases in whole genome comparisons dramatically improves orthogroup inference accuracy. Genome Biol. 2015;16:157. doi: 10.1186/s13059-015-0721-2. [DOI] [PMC free article] [PubMed] [Google Scholar]
- 25.Finn RD, et al. The Pfam protein families database: towards a more sustainable future. Nucleic Acids Res. 2016;44:D279–85. doi: 10.1093/nar/gkv1344. [DOI] [PMC free article] [PubMed] [Google Scholar]
- 26.Ives AR, Garland T. Phylogenetic logistic regression for binary dependent variables. Syst Biol. 2010;59:9–26. doi: 10.1093/sysbio/syp074. [DOI] [PubMed] [Google Scholar]
- 27.Brynildsrud O, Bohlin J, Scheffer L, Eldholm V. Rapid scoring of genes in microbial pan-genome-wide association studies with Scoary. Genome Biol. 2016;17:238. doi: 10.1186/s13059-016-1108-8. [DOI] [PMC free article] [PubMed] [Google Scholar]
- 28.Hultman J, et al. Multi-omics of permafrost, active layer and thermokarst bog soil microbiomes. Nature. 2015;521:208–212. doi: 10.1038/nature14238. [DOI] [PubMed] [Google Scholar]
- 29.Louca S, et al. Integrating biogeochemistry with multiomic sequence information in a model oxygen minimum zone. Proc Natl Acad Sci USA. 2016;113:E5925–E5933. doi: 10.1073/pnas.1602897113. [DOI] [PMC free article] [PubMed] [Google Scholar]
- 30.Coutinho BG, Licastro D, Mendonça-Previato L, Cámara M, Venturi V. Plant-Influenced Gene Expression in the Rice Endophyte Burkholderia kururiensis M130. Mol Plant-Microbe Interact. 2015;28:10–21. doi: 10.1094/MPMI-07-14-0225-R. [DOI] [PubMed] [Google Scholar]
- 31.Long SR. Rhizobium-legume nodulation: Life together in the underground. Cell. 1989;56:203–214. doi: 10.1016/0092-8674(89)90893-3. [DOI] [PubMed] [Google Scholar]
- 32.Ruvkun GB, Sundaresan V, Ausubel FM. Directed transposon Tn5 mutagenesis and complementation analysis of Rhizobium meliloti symbiotic nitrogen fixation genes. Cell. 1982;29:551–9. doi: 10.1016/0092-8674(82)90171-4. [DOI] [PubMed] [Google Scholar]
- 33.Hershey DM, Lu X, Zi J, Peters RJ. Functional conservation of the capacity for ent-kaurene biosynthesis and an associated operon in certain rhizobia. J Bacteriol. 2014;196:100–6. doi: 10.1128/JB.01031-13. [DOI] [PMC free article] [PubMed] [Google Scholar]
- 34.Nett RS, et al. Elucidation of gibberellin biosynthesis in bacteria reveals convergent evolution. Nat Chem Biol. 2016;13:69–74. doi: 10.1038/nchembio.2232. [DOI] [PMC free article] [PubMed] [Google Scholar]
- 35.Scharf BE, Hynes MF, Alexandre GM. Chemotaxis signaling systems in model beneficial plant–bacteria associations. Plant Mol Biol. 2016;90:549–559. doi: 10.1007/s11103-016-0432-4. [DOI] [PubMed] [Google Scholar]
- 36.Büttner D, He SY. Type III protein secretion in plant pathogenic bacteria. Plant Physiol. 2009;150:1656–64. doi: 10.1104/pp.109.139089. [DOI] [PMC free article] [PubMed] [Google Scholar]
- 37.Gao R, et al. Genome-wide RNA sequencing analysis of quorum sensing-controlled regulons in the plant-associated Burkholderia glumae PG1 strain. Appl Environ Microbiol. 2015;81:7993–8007. doi: 10.1128/AEM.01043-15. [DOI] [PMC free article] [PubMed] [Google Scholar]
- 38.Weller-Stuart T, Toth I, De Maayer P, Coutinho T. Swimming and twitching motility are essential for attachment and virulence of Pantoea ananatis in onion seedlings. Mol Plant Pathol. 2016 doi: 10.1111/mpp.12432. [DOI] [PMC free article] [PubMed] [Google Scholar]
- 39.De Weger LA, et al. Flagella of a plant-growth-stimulating Pseudomonas fluorescens strain are required for colonization of potato roots. J Bacteriol. 1987;169:2769–73. doi: 10.1128/jb.169.6.2769-2773.1987. [DOI] [PMC free article] [PubMed] [Google Scholar]
- 40.De Weert S, et al. Flagella-Driven Chemotaxis Towards Exudate Components Is an Important Trait for Tomato Root Colonization by Pseudomonas fluorescens. 2002;15 doi: 10.1094/MPMI.2002.15.11.1173. [DOI] [PubMed] [Google Scholar]
- 41.Ravcheev DA, et al. Comparative genomics and evolution of regulons of the LacI-family transcription factors. Front Microbiol. 2014;5:294. doi: 10.3389/fmicb.2014.00294. [DOI] [PMC free article] [PubMed] [Google Scholar]
- 42.Yamauchi Y, Hasegawa A, Taninaka A, Mizutani M, Sugimoto Y. NADPH-dependent reductases involved in the detoxification of reactive carbonyls in plants. J Biol Chem. 2011;286:6999–7009. doi: 10.1074/jbc.M110.202226. [DOI] [PMC free article] [PubMed] [Google Scholar]
- 43.Burstein D, et al. Genome-scale identification of Legionella pneumophila effectors using a machine learning approach. PLoS Pathog. 2009;5:e1000508. doi: 10.1371/journal.ppat.1000508. [DOI] [PMC free article] [PubMed] [Google Scholar]
- 44.Dean P. Functional domains and motifs of bacterial type III effector proteins and their roles in infection. FEMS Microbiol Rev. 2011;35:1100–1125. doi: 10.1111/j.1574-6976.2011.00271.x. [DOI] [PubMed] [Google Scholar]
- 45.Stebbins CE, Galán JE. Structural mimicry in bacterial virulence. Nature. 2001;412:701–705. doi: 10.1038/35089000. [DOI] [PubMed] [Google Scholar]
- 46.Price CT, et al. Molecular mimicry by an F-Box effector of Legionella pneumophila hijacks a conserved polyubiquitination machinery within macrophages and protozoa. PLoS Pathog. 2009;5:e1000704. doi: 10.1371/journal.ppat.1000704. [DOI] [PMC free article] [PubMed] [Google Scholar]
- 47.Rothmeier E, et al. Activation of Ran GTPase by a Legionella effector promotes microtubule polymerization, pathogen vacuole motility and infection. PLoS Pathog. 2013;9:e1003598. doi: 10.1371/journal.ppat.1003598. [DOI] [PMC free article] [PubMed] [Google Scholar]
- 48.Xu RQ, et al. AvrACXcc8004, a Type III Effector with a Leucine-Rich Repeat domain from Xanthomonas campestris Pathovar campestris confers avirulence in vascular tissues of Arabidopsis thaliana ecotype Col-0. J Bacteriol. 2008;190:343–355. doi: 10.1128/JB.00978-07. [DOI] [PMC free article] [PubMed] [Google Scholar]
- 49.Shevchik VE, Robert-Baudouy J, Hugouvieux-Cotte-Pattat N. Pectate lyase PelI of Erwinia chrysanthemi 3937 belongs to a new family. J Bacteriol. 1997;179:7321–30. doi: 10.1128/jb.179.23.7321-7330.1997. [DOI] [PMC free article] [PubMed] [Google Scholar]
- 50.Cesari S, Bernoux M, Moncuquet P, Kroj T, Dodds PN. A novel conserved mechanism for plant NLR protein pairs: the ‘integrated decoy’• hypothesis. Front Plant Sci. 2014;5 doi: 10.3389/fpls.2014.00606. [DOI] [PMC free article] [PubMed] [Google Scholar]
- 51.Sarris PF, et al. A plant immune receptor detects pathogen effectors that target WRKY transcription factors. Cell. 2015;161:1089–1100. doi: 10.1016/j.cell.2015.04.024. [DOI] [PubMed] [Google Scholar]
- 52.Sarris PF, et al. Comparative analysis of plant immune receptor architectures uncovers host proteins likely targeted by pathogens. BMC Biol. 2016;14:8. doi: 10.1186/s12915-016-0228-7. [DOI] [PMC free article] [PubMed] [Google Scholar]
- 53.Le Roux C, et al. A receptor pair with an integrated decoy converts pathogen disabling of transcription factors to immunity. Cell. 2015;161:1074–1088. doi: 10.1016/j.cell.2015.04.025. [DOI] [PubMed] [Google Scholar]
- 54.Immunology of fungal infections. Springer; Netherlands: 2007. [DOI] [Google Scholar]
- 55.Gadjeva M, Takahashi K, Thiel S. Mannan-binding lectin–a soluble pattern recognition molecule. Mol Immunol. 2004;41:113–21. doi: 10.1016/j.molimm.2004.03.015. [DOI] [PubMed] [Google Scholar]
- 56.Ma QH, Tian B, Li YL. Overexpression of a wheat jasmonate-regulated lectin increases pathogen resistance. Biochimie. 2010;92:187–193. doi: 10.1016/j.biochi.2009.11.008. [DOI] [PMC free article] [PubMed] [Google Scholar]
- 57.Xiang Y, et al. A jacalin-related lectin-like gene in wheat is a component of the plant defence system. J Exp Bot. 2011;62:5471–5483. doi: 10.1093/jxb/err226. [DOI] [PMC free article] [PubMed] [Google Scholar]
- 58.Yamaji Y, et al. Lectin-mediated resistance impairs plant virus infection at the cellular level. Plant Cell. 2012;24:778–93. doi: 10.1105/tpc.111.093658. [DOI] [PMC free article] [PubMed] [Google Scholar]
- 59.Weidenbach D, et al. Polarized defense against fungal pathogens is mediated by the Jacalin-related lectin domain of modular Poaceae-specific proteins. Mol Plant. 2016;9:514–527. doi: 10.1016/j.molp.2015.12.009. [DOI] [PubMed] [Google Scholar]
- 60.Sahly H, et al. Surfactant protein D binds selectively to Klebsiella pneumoniae lipopolysaccharides containing mannose-rich O-antigens. J Immunol. 2002;169:3267–74. doi: 10.4049/jimmunol.169.6.3267. [DOI] [PubMed] [Google Scholar]
- 61.Osborn MJ, Rosen SM, Rothfield L, Zelenick LD, Horecker BL. Lipopolysaccharide of the gram-negative cell wall. Science. 1964;145:783–9. doi: 10.1126/science.145.3634.783. [DOI] [PubMed] [Google Scholar]
- 62.Tans-Kersten J, Huang H, Allen C. Ralstonia solanacearum needs motility for invasive virulence on tomato. J Bacteriol. 2001;183:3597–605. doi: 10.1128/JB.183.12.3597-3605.2001. [DOI] [PMC free article] [PubMed] [Google Scholar]
- 63.Cole BJ, et al. Genome-wide identification of bacterial plant colonization genes. PLOS Biol. 2017;15:e2002860. doi: 10.1371/journal.pbio.2002860. [DOI] [PMC free article] [PubMed] [Google Scholar]
- 64.Poggio S, et al. A complete set of flagellar genes acquired by horizontal transfer coexists with the endogenous flagellar system in Rhodobacter sphaeroides. J Bacteriol. 2007;189:3208–16. doi: 10.1128/JB.01681-06. [DOI] [PMC free article] [PubMed] [Google Scholar]
- 65.Ho BT, Dong TG, Mekalanos JJ. A view to a kill: the bacterial type VI secretion system. Cell Host Microbe. 2014;15:9–21. doi: 10.1016/j.chom.2013.11.008. [DOI] [PMC free article] [PubMed] [Google Scholar]
- 66.MacIntyre DL, Miyata ST, Kitaoka M, Pukatzki S. The Vibrio cholerae type VI secretion system displays antimicrobial properties. Proc Natl Acad Sci U S A. 2010;107:19520–4. doi: 10.1073/pnas.1012931107. [DOI] [PMC free article] [PubMed] [Google Scholar]
- 67.Tian Y, et al. The type VI protein secretion system contributes to biofilm formation and seed-to-seedling transmission of Acidovorax citrulli on melon. Mol Plant Pathol. 2015;16:38–47. doi: 10.1111/mpp.12159. [DOI] [PMC free article] [PubMed] [Google Scholar]
- 68.Peiffer JA, et al. Diversity and heritability of the maize rhizosphere microbiome under field conditions. Proc Natl Acad Sci U S A. 2013;110:6548–53. doi: 10.1073/pnas.1302837110. [DOI] [PMC free article] [PubMed] [Google Scholar]
- 69.Agler MT, et al. Microbial hub taxa link host and abiotic factors to plant microbiome variation. PLOS Biol. 2016;14:e1002352. doi: 10.1371/journal.pbio.1002352. [DOI] [PMC free article] [PubMed] [Google Scholar]
- 70.Bokulich NA, Thorngate JH, Richardson PM, Mills DA. Microbial biogeography of wine grapes is conditioned by cultivar, vintage, and climate. Proc Natl Acad Sci U S A. 2014;111:E139–48. doi: 10.1073/pnas.1317377110. [DOI] [PMC free article] [PubMed] [Google Scholar]
- 71.Coleman-Derr D, et al. Plant compartment and biogeography affect microbiome composition in cultivated and native Agave species. New Phytol. 2016;209:798–811. doi: 10.1111/nph.13697. [DOI] [PMC free article] [PubMed] [Google Scholar]
- 72.Shade A, McManus PS, Handelsman J. Unexpected diversity during community succession in the apple flower microbiome. MBio. 2013;4:e00602–12. doi: 10.1128/mBio.00602-12. [DOI] [PMC free article] [PubMed] [Google Scholar]
- 73.Turner TR, et al. Comparative metatranscriptomics reveals kingdom level changes in the rhizosphere microbiome of plants. ISME J. 2013;7:2248–2258. doi: 10.1038/ismej.2013.119. [DOI] [PMC free article] [PubMed] [Google Scholar]
- 74.Edwards J, et al. Structure, variation, and assembly of the root-associated microbiomes of rice. Proc Natl Acad Sci U S A. 2015;112:E911–20. doi: 10.1073/pnas.1414592112. [DOI] [PMC free article] [PubMed] [Google Scholar]
- 75.Kroj T, Chanclud E, Michel-Romiti C, Grand X, Morel JB. Integration of decoy domains derived from protein targets of pathogen effectors into plant immune receptors is widespread. New Phytol. 2016;210:618–26. doi: 10.1111/nph.13869. [DOI] [PMC free article] [PubMed] [Google Scholar]
- 76.Mukhtar MS, et al. Independently evolved virulence effectors converge onto hubs in a plant immune system network. Science (80-) 2011;333:596–601. doi: 10.1126/science.1203659. [DOI] [PMC free article] [PubMed] [Google Scholar]
- 77.Vimr E, Lichtensteiger C. To sialylate, or not to sialylate: that is the question. Trends Microbiol. 2002;10:254–7. doi: 10.1016/s0966-842x(02)02361-2. [DOI] [PubMed] [Google Scholar]
- 78.de Jonge R, et al. Conserved fungal LysM efector Ecp6 prevents chitin-triggered immunity in plants. Science (80-) 2010;329 doi: 10.1126/science.1190859. [DOI] [PubMed] [Google Scholar]
- 79.Doty SL, et al. Diazotrophic endophytes of native black cottonwood and willow. Symbiosis. 2009;47:23–33. [Google Scholar]
- 80.Weston DJ, et al. Pseudomonas fluorescens induces strain-dependent and strain-independent host plant responses in defense networks, primary metabolism, photosynthesis, and fitness. Mol Plant-Microbe Interact. 2012;25:765–778. doi: 10.1094/MPMI-09-11-0253. [DOI] [PubMed] [Google Scholar]
- 81.Rinke C, et al. Insights into the phylogeny and coding potential of microbial dark matter. Nature. 2013;499:431–437. doi: 10.1038/nature12352. [DOI] [PubMed] [Google Scholar]
- 82.Integrated Microbial Genomes. Available at: https://img.jgi.doe.gov/cgi-bin/mer/main.cgi.
- 83.Beszteri B, Temperton B, Frickenhaus S, Giovannoni SJ. Average genome size: a potential source of bias in comparative metagenomics. ISME J. 2010;4:1075–1077. doi: 10.1038/ismej.2010.29. [DOI] [PubMed] [Google Scholar]
- 84.Parks DH, Imelfort M, Skennerton CT, Hugenholtz P, Tyson GW. CheckM: assessing the quality of microbial genomes recovered from isolates, single cells, and metagenomes. Genome Res. 2015;25:1043–55. doi: 10.1101/gr.186072.114. [DOI] [PMC free article] [PubMed] [Google Scholar]
- 85.Varghese NJ, et al. Microbial species delineation using whole genome sequences. Nucleic Acids Res. 2015;43:6761–71. doi: 10.1093/nar/gkv657. [DOI] [PMC free article] [PubMed] [Google Scholar]
- 86.Kerepesi C, Bánky D, Grolmusz V. AmphoraNet: The webserver implementation of the AMPHORA2 metagenomic workflow suite. Gene. 2014;533:538–540. doi: 10.1016/j.gene.2013.10.015. [DOI] [PubMed] [Google Scholar]
- 87.Wu M, et al. Accounting for alignment uncertainty in phylogenomics. PLoS One. 2012;7:e30288. doi: 10.1371/journal.pone.0030288. [DOI] [PMC free article] [PubMed] [Google Scholar]
- 88.Price MN, et al. FastTree 2 – approximately Maximum-Likelihood trees for large alignments. PLoS One. 2010;5:e9490. doi: 10.1371/journal.pone.0009490. [DOI] [PMC free article] [PubMed] [Google Scholar]
- 89.Sen A, et al. Phylogeny of the class Actinobacteria revisited in the light of complete genomes. Int J Syst Evol Microbiol. 2014;64:3821–3832. doi: 10.1099/ijs.0.063966-0. [DOI] [PubMed] [Google Scholar]
- 90.Edgar RC. Search and clustering orders of magnitude faster than BLAST. Bioinformatics. 2010;26:2460–2461. doi: 10.1093/bioinformatics/btq461. [DOI] [PubMed] [Google Scholar]
- 91.Buchfink B, Xie C, Huson DH. Fast and sensitive protein alignment using DIAMOND. Nat Methods. 2014;12:59–60. doi: 10.1038/nmeth.3176. [DOI] [PubMed] [Google Scholar]
- 92.Wang Z, Wu M. A Phylum-Level Bacterial Phylogenetic Marker Database. Mol Biol Evol. 2013;30:1258–1262. doi: 10.1093/molbev/mst059. [DOI] [PubMed] [Google Scholar]
- 93.Benjamini Y, Hochberg Y. Controlling the false discovery rate: A practical and powerful approach to multiple testing. Source J R Stat Soc Ser B J R Stat Soc Ser B J R Stat Soc B. 1995;57:289–300. [Google Scholar]
- 94.Finn RD, et al. HMMER web server: 2015 update. Nucleic Acids Res. 2015;43:W30–W38. doi: 10.1093/nar/gkv397. [DOI] [PMC free article] [PubMed] [Google Scholar]
- 95.Alexeyev MF. The pKNOCK series of broad-host-range mobilizable suicide vectors for gene knockout and targeted DNA insertion into the chromosome of gram-negative bacteria. Biotechniques. 1999;26828:824–6. doi: 10.2144/99265bm05. [DOI] [PubMed] [Google Scholar]
- 96.Hadjithomas M, et al. IMG-ABC: a knowledge base to fuel discovery of biosynthetic gene clusters and novel secondary metabolites. MBio. 2015;6:e00932. doi: 10.1128/mBio.00932-15. [DOI] [PMC free article] [PubMed] [Google Scholar]
- 97.Katoh K, Misawa K, Kuma K, Miyata T. MAFFT: a novel method for rapid multiple sequence alignment based on fast Fourier transform. Nucleic Acids Res. 2002;30:3059–66. doi: 10.1093/nar/gkf436. [DOI] [PMC free article] [PubMed] [Google Scholar]
- 98.Stamatakis A, Hoover P, Rougemont J. A rapid bootstrap algorithm for the RAxML web servers. Syst Biol. 2008;57:758–771. doi: 10.1080/10635150802429642. [DOI] [PubMed] [Google Scholar]
- 99.Finkel OM, Béjà O, Belkin S. Global abundance of microbial rhodopsins. ISME J. 2013;7:448–451. doi: 10.1038/ismej.2012.112. [DOI] [PMC free article] [PubMed] [Google Scholar]
- 100.Traore SM. Characterization of Type Three Effector Genes of A citrulli, the Causal Agent of Bacterial Fruit Blotch of Cucurbits. Virginia Polytechnic Institute and State University; 2014. [Google Scholar]
- 101.Basler M, Ho BT, Mekalanos JJ. Tit-for-Tat: Type VI Secretion System Counterattack during Bacterial Cell-Cell Interactions. Cell. 2013;152:884–894. doi: 10.1016/j.cell.2013.01.042. [DOI] [PMC free article] [PubMed] [Google Scholar]
Associated Data
This section collects any data citations, data availability statements, or supplementary materials included in this article.
Supplementary Materials
Data Availability Statement
All new genomes (Supplementary Table 3) were submitted and are publicly available in at least one of the following databanks (see accessions in Supplementary Table 3):
A dedicated website: http://labs.bio.unc.edu/Dangl/Resources/gfobap_website/index.html
The dedicated website contains nucleotide and AA fasta files of all datasets used, protein/domain annotations (COG, KO, TiGRfam, Pfam), metadata, phylogenetic trees, OrthoFinder orthogroups, Orthogroups HMMs, full enrichment datasets, correlation between orthogroups, and predicted operons (see URLs).
Different scripts that were used in analysis appear in the URLs section.
Full genome sequence, gene annotation, and metadata of each genome used can be found in IMG website https://img.jgi.doe.gov/. For example the metadata of taxon id 2558860101 can be found in: https://img.jgi.doe.gov/cgi-bin/mer/main.cgi?section=TaxonDetail&page=taxonDetail&taxon_oid=2558860101.