Abstract
Smartphone cameras can measure heart rate (HR) by detecting pulsatile photoplethysmographic (iPPG) signals from post-processing the video of a subject’s face. The iPPG signal is often derived from variations in the intensity of the green channel as shown by Poh et. al. and Verkruysse et. al.. In this pilot study, we have introduced a novel iPPG method where by measuring variations in color of reflected light, i.e., Hue, and can therefore measure both HR and respiratory rate (RR) from the video of a subject’s face. This paper was performed on 25 healthy individuals (Ages 20–30, 15 males and 10 females, and skin color was Fitzpatrick scale 1–6). For each subject we took two 20 second video of the subject’s face with minimal movement, one with flash ON and one with flash OFF. While recording the videos we simultaneously measuring HR using a Biosync B-50DL Finger Heart Rate Monitor, and RR using self-reporting. This paper shows that our proposed approach of measuring iPPG using Hue (range 0–0.1) gives more accurate readings than the Green channel. HR/Hue (range 0–0.1) ( ,
,  -value = 4.1617, and RMSE = 0.8887) is more accurate compared with HR/Green (
 ,
,  -value = 11.60172, and RMSE = 0.9068). RR/Hue (range 0–0.1) (
 ,
,  -value = 0.2885, and RMSE = 3.8884) is more accurate compared with RR/Green (
 ,
,  -value = 0.5608, and RMSE = 5.6885). We hope that this hardware agnostic approach for detection of vital signals will have a huge potential impact in telemedicine, and can be used to tackle challenges, such as continuous non-contact monitoring of neo-natal and elderly patients. An implementation of the algorithm can be found at https://pulser.thinkbiosolution.com
Keywords: Heart rate, respiratory rate, hue, photoplethysmography, smartphone, smartphone camera
This paper presents the development and validation of a noninvasive point-of-care method for monitoring heart rate and respiratory rate from video of a user's face.
I. Introduction
In recent years, we have seen smartphones and their accessories move from an extremely niche market, to occupying a central role in the lives of a significant share of the global population. What used to be an obscure toy for a handful of tinkerers and executives is now our alarm clock, notebook, camera, dictionary, encyclopedia, fitness and wellness assistant, and window to the greater world. In this present work we utilize the extensive gamut of imaging technologies present in our smartphone camera, to measure and monitor bio-signals, towards better management of physical wellness, as well as towards taking precautionary and preventive action for alleviating medical issues.
An upcoming and fast growing field in smartphone based accessorization [1] is that of health and wellness. We now have thermometers [2], pulse monitors [3]–[6], pedometers [7], sleep trackers [8], calorie trackers [9], vein detectors [10], blood sugar monitors [11] and a plethora of other devices, either connected to or as part of smartphones. Some of these devices [1], [9], at least in part, use the sensors built inside the smartphones themselves to acquire and process the data thus needed.
Heart rate/pulse (HR) is often measured using contact based optical sensors that use PPG i.e. the variation of transmissivity and/or reflectivity of light through the finger tip as a function of arterial pulsation [12]–[14], followed by different signal post-processing approaches [12]–[16]. This approach works due to the differential absorption of certain frequency by hemoglobin in the blood, compared to the surrounding tissue such as flesh and bone. The wavelength under consideration varies from near-infrared (NIR) [12], to red [13] and even high intensity white flashlight [17] for fingertip based sensor systems. In other systems, sound reflectivity i.e. Doppler effect [18] is utilized to obtain similar parameters. Non-contact based optical sensors, have been used to measure HR from a video of a human face [14], by looking at the variation of average pixel value of the green channel in the subject’s forehead.
Several techniques exist [19]–[21] to enhance accuracy and reduce error rates for signals associated with HR both for the contact based approaches. For example, to reduce movement artefacts, one can look for aperiodic components at the lower end of the spectrum [20], or consider correlation between several signals across different channels [22]. In the case of the non-contact based approach, continuous facial detection (facial tracking) is used [23] to mitigate error introduced by natural movement. Other common error sources in the face based approach include the effects of ambient light, skin color and real-time constraints. Camera-based methods (particularly in the case of cameraphones) [5], [18], [23], [24], in addition to the above problems, have their own additional set of challenge such as spectral response range of the camera modules and ambient noise.
Contact based measurements of respiratory rate(RR) typically consists of electrophysiological measurements [25] analogous to electrocardiography (ECG) and/or pressure sensors [26], [27]. Non-contact measurement techniques usually utilize ultrasound [28] or microwave [29] readings. While there has been some work [12]–[14], [30], [31]–[33] in the optical and near optical frequency ranges, non-contact optical respiratory rate measurement still has potential for improvement.
In this manuscript we present a novel Hue (HSV colorspace) based observable for reflection based iPPG. By tracking time dependent changes of the average Hue, we can measure arterial pulsations from the forehead region. In what follows, in Section 2 we first discuss the Hue channel based iPPG in detail, and compare that with the traditional Green channel based iPPG approach. This is followed by Section 3 and 4 where we discuss the various experimental setup and validate the performance of Hue based iPPG with standard approaches to measure heart rate and respiratory rate, using videos of the user’s face procured using a commercial smartphone (LG G2, LG Electronics Inc., Korea). In Section 5 we summarize the new Hue based iPPG approach, and address possible applications and limitations.
II. Method
A. iPPG Obtained Using the Green Versus the Hue Channel
iPPG is based on the principle that arterial pulsation is the major differential component of blood flow. In a iPPG based approach, we measure arterial pulsation using a photodiode as a sensor and a LED as an illuminant with appropriate illumination frequency [15], both in the case of transmission or reflectance mode. In the case of using a camera as a sensor, a particular channel like the Green channel  , at which oxygenated hemoglobin absorbs light differentially compared to the surrounding tissue is used. The optical sensor when taking a video of the face measures the the signal
  from the forehead (which is average fluctuation of the green channel of the video obtained using the smartphone camera in our case).
  is obtained over frames 0 to t, where each frame has
  pixels (Similar to “Raw Signal” in Fig.3),
 |
and  is the power of a given light source at the given wavelength
  ,
,  is the reflectance of the surface at a wavelength
  , and
, and  are the CIE (International Commission on Illumination) color-matching functions accounting for the response of the optical sensor (eyes, camera, etc.) [34]. Since the incident light can be assumed to be time-invariant,
  can be further decoupled as the intensity of the incident light
  and the frequency distribution of the light normalized with respect to the total energy
  .
.
 |
Also, the change in the reflectance of the pulsating tissue  , can be further modeled as a sum of a static non-pulsatile (DC) component and a pulsatile (AC) component. Both of these are dependent on the volume
  and reflectivity
  of the individual components.
 |
As a result the observable for iPPG can be written as a function of pulsatile (AC) and non-pulsatile (DC) part,
 |
The time dependent variance of pulsatile (AC) component is strongly correlated to the ECG signal corresponding to HR and the RR. In literature where an RGB color space was directly used to measure the pulsatile (AC) component we find the best results for the green instead of the red channel [30], as an artefact of the parameterization of the RGB color-space.
FIGURE 3.
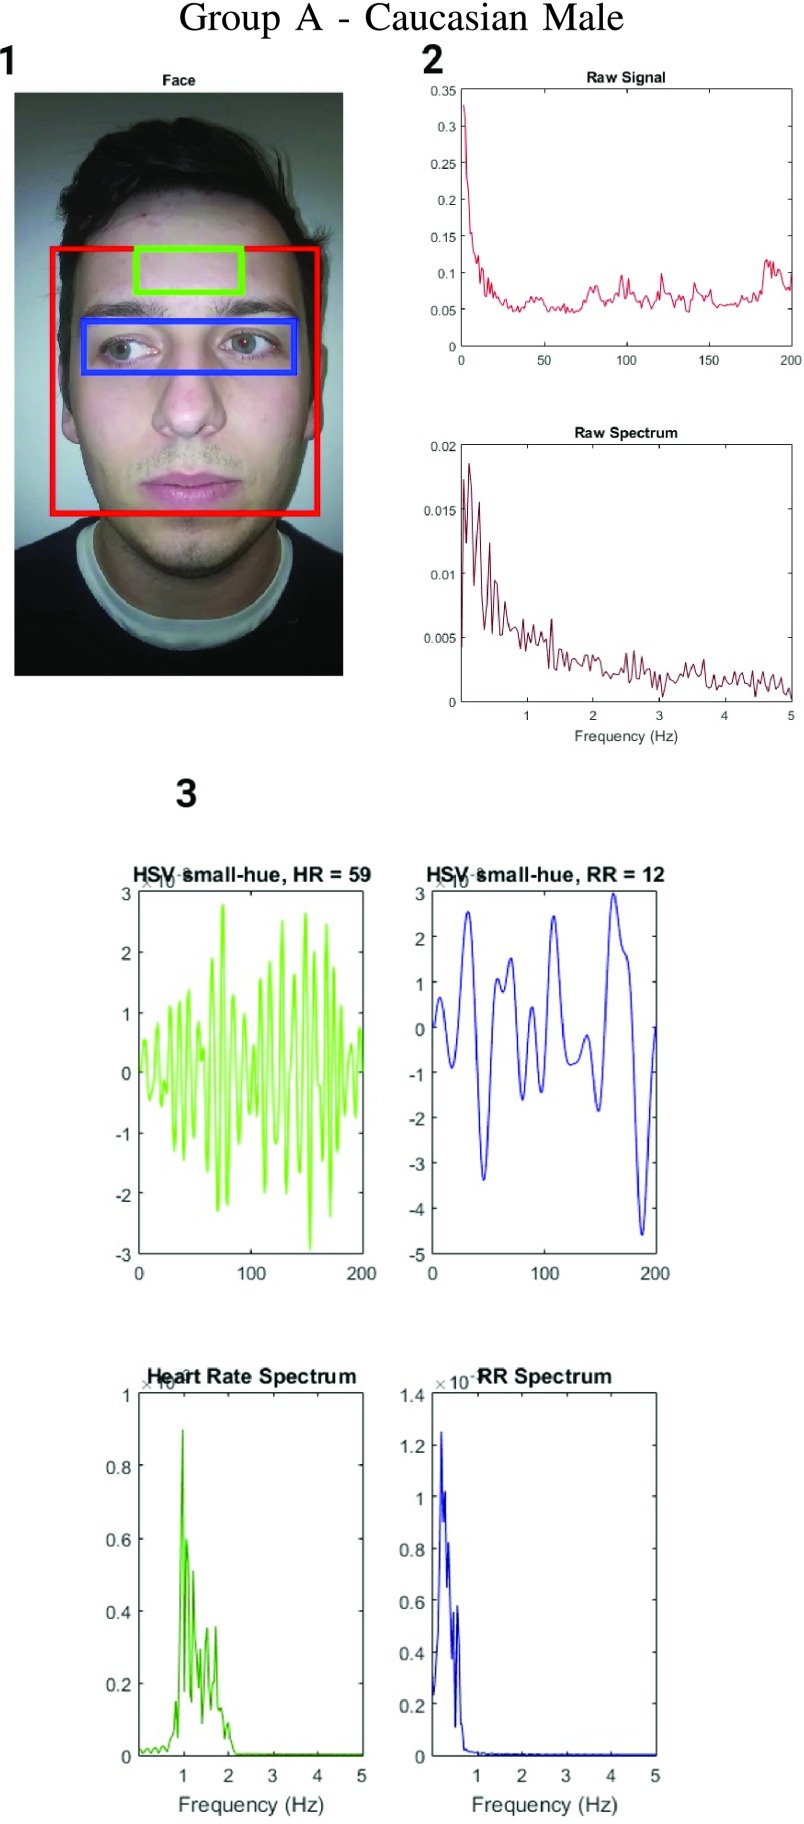
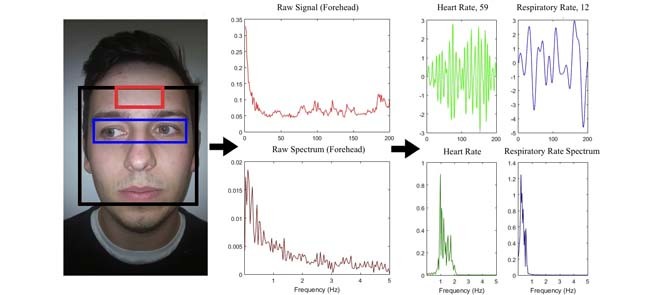
Figure showing the heart and respiratory rate obtained from a video of captured from a face captured using phone-flash. (1) Image of a face corresponding to the first frame, superimposed with detected face (red box), detected eyes (blue box) and the detected forehead (green box.). (2) Average Hue as a function of time for the forehead region and it’s corresponding frequency spectrum. (3) Average post-processed Hue (from 0 – 0.1) as a function of time for the forehead region using HR and RR IIR bandpass filters  and
and  , and it’s corresponding frequency spectrum
  and
and  .
.
Unlike the standard iPPG which measures average fluctuations of the the Green channel, in our proposed iPPG approach we measures average fluctuations of Hue values. To do this we first convert each RGB pixel in the image to the corresponding HSV pixel, and then for each frame compute the average Hue. The resulting iPPG signal  (“Raw Signal” in Fig.3) can hence be written as,
 |
In addition by choosing the Hue range from 0 to 0.1, we can measure fluctuations corresponding to the skin color and avoid external noise in the measurements. The choice of Hue range corresponds to a choice of a particular  range (
 ), which can then be modelled as
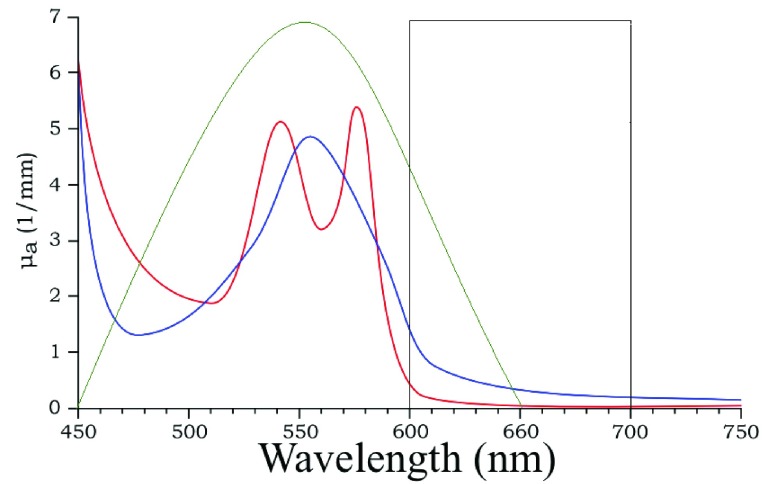
  (shown as a square well in Fig.1). Since this primarily depends on the AC component, we can further approximate it as,
 |
FIGURE 1.
Schematic representation of extension co-efficient of hemoglobin  (red) and oxygenated hemoglobin
  (blue) as a function of absorption wavelength. Overlaid are the
  (green) i.e. CIE color matching function for green channel, and
  (black).
B. Getting Hue From RGB Pixels
As defined in the previous sub-section, we measure fluctuations in pixels that fall within a given Hue range. To do this we first transform each RGB pixel  to a HSV pixel
  (which is equivalent to
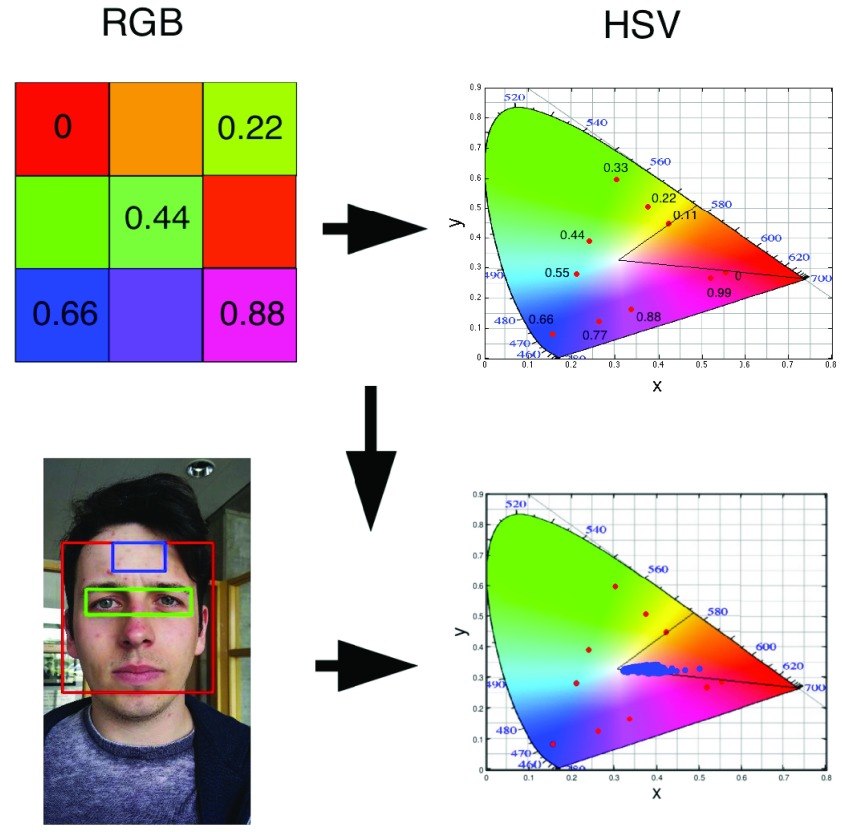
  ) using [35]. Each Hue value corresponds to a different color, for example 0 is red, green is 0.33, and blue is 0.66 (As shown in Fig.2.Top Panel.) Hence by choosing a range in the Hue values, one can effectively choose corresponding absorption frequency.
FIGURE 2.
Schematic representation of mapping between an RGB to a Hue color space. The top image is a toy model with 9 different colors with ( , 0.11,
  ) and the corresponding points
  (red dots) in the xyY plot. The same transformation when applied to the pixels in the forehead region, shows that they have a Hue in the range of 0 and 0.1.
We have further demonstrated that under normal ambient light the Hue of the vast majority of forehead pixels is in the range of 0 to 0.1 which corresponds to the color of a human skin, as shown in Fig.2.Bottom Panel. Detailed HSV model of color based segmentation of human skin has been implemented by [36]–[39].
C. Facial and Forehead Detection
In this work we have used a Haar cascade based detection function to detect the face and eyes in each frame using OpenCV [40]. The function effectively returns a box representing the  and
and  for each frame. Where
  and
and  are the location of the x-pixels (column) on the top-left corner of the box, and
  and
and  are the location of the y-pixels (row) on the top-left corner of the box.
  are the height of the boxes (i.e. lengths of the column), and
  are the width of the boxes (i.e. lengths of the rows). In MATLAB the top left corner of a frame
  is (x,y) = (0,0), and bottom right corner is (x,y) = (
 ). Object detection such as faces and eyes using Haar like feature-based cascade is a machine learning approach, where a cascade function is trained from a lot of positive and negative images, which is subsequently used to detect objects in other images [41], [42]. Using these face and eye boxes, we then compute the forehead parameters from each frame using,
  (See Fig.3.). The parameters for computing forehead are optimized using multiple videos, and agrees with available literature such as Poh et al.
[23] who chose the center 60% of the bounding box width and the full height.
III. Experimental Setup - Video Acquisition of the Face, and Post-Processing of the iPPG Signal Obtained Using the Hue Channel (Range 0–0.1)
Two videos of each subject’s face was acquired for 20 seconds using the rear-camera and standard video capturing application provided with a commercial smartphone (LG G2, LG Electronics Inc., Korea), one with and one without the flash. While the videos were shot, an external pulse oximeter was attached to the subjects’ fingers to measure the HR (Biosync B-50DL Finger Pulse Oximeter and Heart Rate Monitor, Contec Medical Systems Co. Ltd, China). The Biosync B-50DL Finger Pulse Oximeter has a measurement accuracy of ±2 beats per minute (BPM) [43]. In addition the subjects were asked to count their respiration rate (for the duration of a minute). In order to ensure that the RR were correct the subjects were asked to practise estimating their RR 5–10 times, and accuracy was corroborated by visual inspection of the subjects’ chest rising. This is consistent with the method recommended by John Hopkins University and John Hopkins Hospital [44]. The videos of the face was taken with minimal movement to simulate the standardized best case scenario. The distance between the subject’s face and the camera was typically ~0.5 meter (± 20%). and had little effect on the accuracy of the final result.
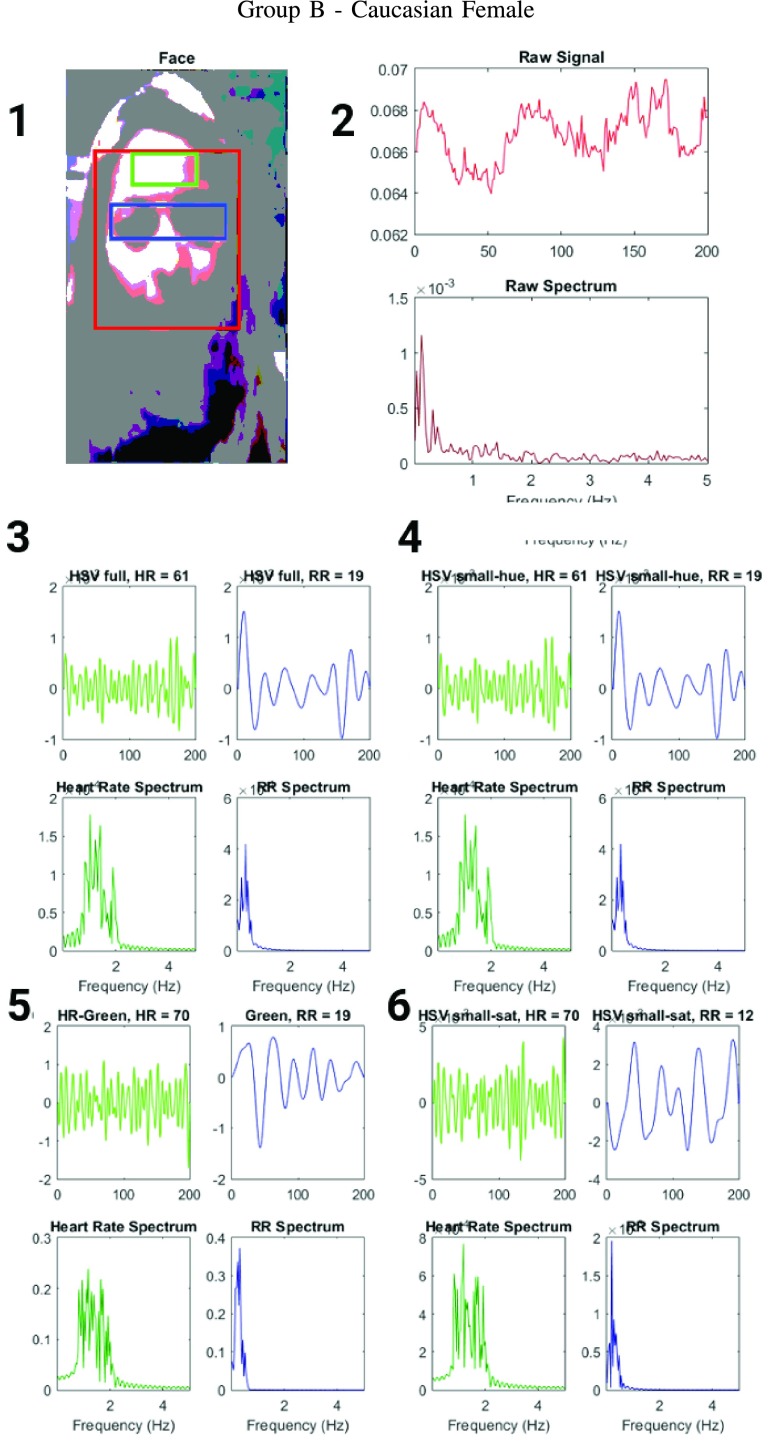
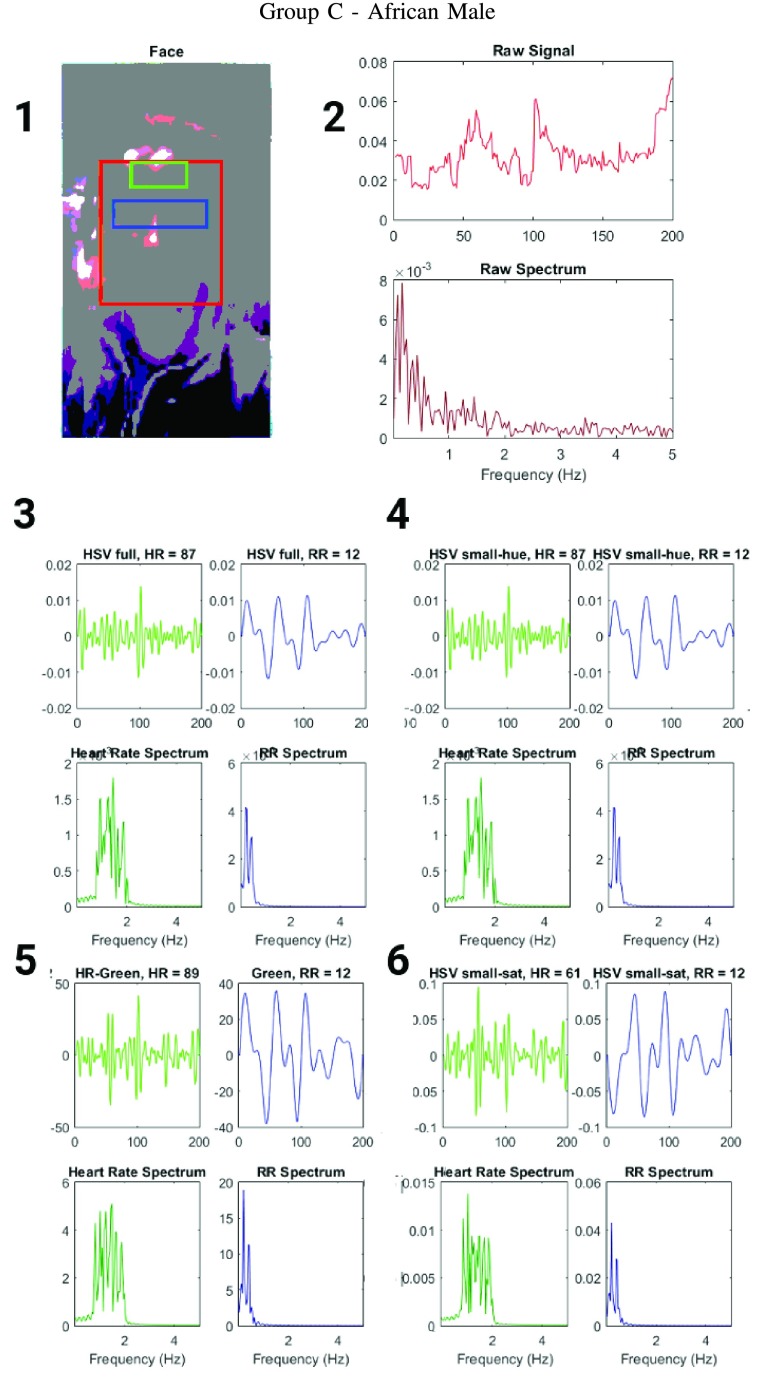
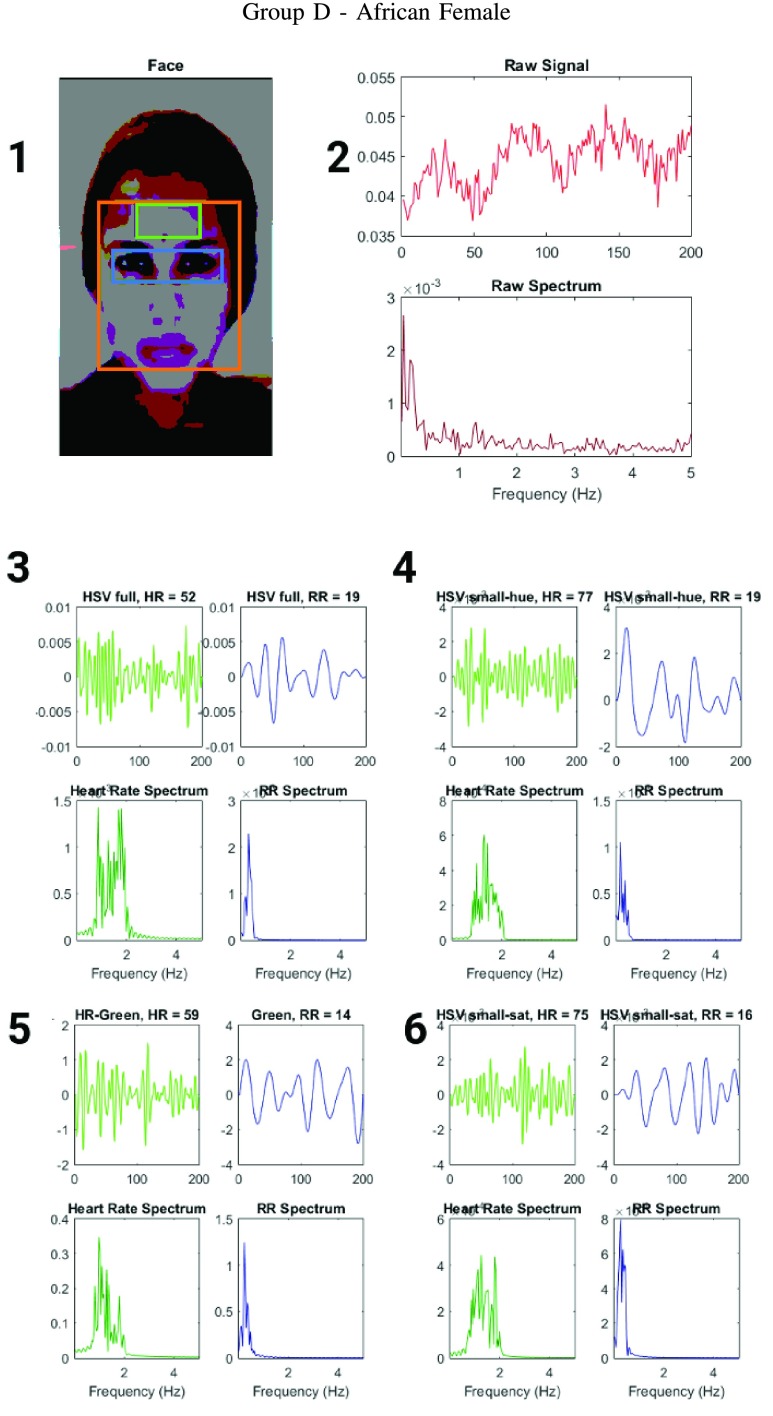
The 25 subjects (ages ranging between 20–30) were chosen to represent different skin types (Fitzpatrick scale 1–6) and gender. 5 subgroups were established based on skin types and gender - Group A is Caucasian male (Fitzpatrick scale 1–3), Group B is Caucasian female (Fitzpatrick scale 1–3), Group C is African male (Fitzpatrick scale 6), Group D is African female (Fitzpatrick scale 6) and Group E is Indian male (Fitzpatrick scale 4–5). The detailed results for some of these subjects are shown in Figs.4, 5 and 6. The authors have used human subjects to acquire readings and data in the form of videos of their face under various lighting conditions. The subjects were informed in detail about the nature and scope of the work, and provided their informed consent to be included in the investigation. The subject’s facial images have been anonymized for privacy reasons (singular exception has provided permission for image use, and was de-anonymized for representative purposes). The subject data was acquired and handled based on the general principles of the Declaration of Helsinki 2013 [45], specifically in regard to informed consent, scientific requirements and research protocols, privacy and confidentiality.
FIGURE 4.
Figure showing the heart and respiratory rate obtained from a video of a human face captured using phone-flash(Fitzgerald scale 1–2). (1) Image of a face corresponding to the first frame, superimposed with detected face (red box), detected eyes (blue box) and the detected forehead (green box.) (2) Average preprocessed Hue as a function of time for the forehead region and it’s corresponding frequency spectrum. (3–6) Average post-processed values as a function of time for the forehead region, using HR and RR IIR bandpass filters and it’s corresponding frequency spectrum (3) Hue, (4) Hue from 0 – 0.1, (5) Green channel from RGB, and (6) Saturation using Hue from 0 – 0.1.
FIGURE 5.
Figure showing the heart and respiratory rate obtained from a video of a human face captured using phone-flash(Fitzgerald scale 5–6). (1) Image of a face corresponding to the first frame, superimposed with detected face (red box), detected eyes (blue box) and the detected forehead (green box.) (2) Average preprocessed Hue as a function of time for the forehead region and it’s corresponding frequency spectrum. (3–6) Average post-processed values as a function of time for the forehead region, using HR and RR IIR bandpass filters and it’s corresponding frequency spectrum (3) Hue, (4) Hue from 0 – 0.1, (5) Green channel from RGB, and (6) Saturation using Hue from 0 – 0.1.
FIGURE 6.
Figure showing the heart and respiratory rate obtained from a video of a human face captured using phone-flash(Fitzgerald scale 5–6). (1) Image of a face corresponding to the first frame, superimposed with detected face (red box), detected eyes (blue box) and the detected forehead (green box.) (2) Average preprocessed Hue as a function of time for the forehead region and it’s corresponding frequency spectrum. (3–6) Average post-processed values as a function of time for the forehead region, using HR and RR IIR bandpass filters and it’s corresponding frequency spectrum (3) Hue, (4) Hue from 0 – 0.1, (5) Green channel from RGB, and (6) Saturation using Hue from 0 – 0.1.
Once the 50 videos were obtained they were post processed using a MATLAB R2016a script, and the resulting plots are shown in Figs.4, 5 and 6. In order to measure the HR and the RR from a iPPG signal, from the video of a subject’s face, the MATLAB script first capture a 20 seconds video at 30fps. These videos were then post processed at 10fps, by using one in every three consecutive frames and rejecting the rest. We have further checked that the down-sampling does not affect the final results by processing each of these videos at 15 and 30fps and computing HR and RR values. The video length needs to be a minimum of 20 seconds long to gather statistically significant data since RR can be as low as 6 per minute, or 0.1 Hz. To ensure that at least 2 complete breaths are acquired within the sample, sampling period needs to be ≥ 20 seconds.
The MATLAB script then detect faces and eyes using the approach mentioned in section Sec.II-C. For each processed frame, the script then computes the average Hue for the forehead region for the 200 frames, which then gives us the raw iPPG signal  . This is followed by conversion of the time series data to its frequency spectrum,
  . This is followed by application of IIR bandpass filters corresponding to the frequency ranges of interest, typically associated with HR (3dB cutoffs: 0.8 to 2.2 Hz) and RR (3dB cutoffs: 0.18 to 0.5 Hz). The order for the HR filter used was 20, and the order for the RR filter used was 8. The peaks of the filtered frequency spectra
  and
and  ,correspond to the HR and RR respectively as shown in Fig.3.3). To visualize the effect of the filter on the raw iPPG signal we replot it as
  and
and  .
.
In addition the MATLAB script computes HR and RR, using iPPG obtained from the average value of the pixels in the forehead region, using Hue (without any range specifications), Green channel (Similar to the approach of Poh et al. [23]), and Saturation (HSV colorspace), for pixels with Hue within a range of 0–0.1.
IV. Results and Discussion
A. Qualitative Comparison of HR and RR Obtained From the iPPG Signal Using the Hue Channel, With Other Algorithmic Approaches
To compare the accuracy of the different iPPG approaches, we have simultaneously measured HR and RR of 25 subjects using standard instruments like pulse oximeters (HR) and self-reporting (RR). These results are further tabulated in details in Table.2 and Table.3 (Flash on), and Table.4 and Table.5 (Flash Off).
TABLE 2. Table Showing the HR of a Subject Obtained From Pulse Oximeter, Compared With HR Computed From a iPPG Obtained From the Forehead of the Subject (With Phone-Flash). The iPPG was Computed Using Average Values of (A) Hue Within a Range of 0–0.1 (B) Hue (C) Green and (D) Saturation (For Pixels With Hue Within a Range of 0–0.1).
| Subject | Flash | Pulse Ox. | Hue (0–0.1) | Hue | Green | Sat. with Hue (0–0.1) |
|---|---|---|---|---|---|---|
| A1 | On | 77 | 59 | 59 | 56 | 56 |
| A2 | On | 75 | 75 | 52 | 61 | 75 |
| A3 | On | 82 | 84 | 54 | 61 | 84 |
| A4 | On | 60 | 59 | 54 | 89 | 89 |
| A5 | On | 71 | 75 | 75 | 66 | 59 |
| B1 | On | 60 | 61 | 61 | 70 | 70 |
| B2 | On | 68 | 71 | 72 | 74 | 61 |
| B3 | On | 72 | 70 | 68 | 77 | 88 |
| B4 | On | 87 | 90 | 90 | 98 | 64 |
| B5 | On | 65 | 61 | 59 | 64 | 78 |
| C1 | On | 87 | 87 | 87 | 61 | 69 |
| C2 | On | 84 | 86 | 87 | 88 | 63 |
| C3 | On | 88 | 90 | 91 | 94 | 64 |
| C4 | On | 57 | 58 | 59 | 64 | 63 |
| C5 | On | 72 | 73 | 74 | 77 | 83 |
| D1 | On | 79 | 77 | 52 | 75 | 59 |
| D2 | On | 82 | 84 | 86 | 87 | 89 |
| D3 | On | 63 | 64 | 64 | 49 | 86 |
| D4 | On | 54 | 55 | 56 | 56 | 56 |
| D5 | On | 63 | 68 | 63 | 68 | 68 |
| E1 | On | 69 | 68 | 70 | 68 | 68 |
| E2 | On | 78 | 79 | 79 | 77 | 72 |
| E3 | On | 83 | 84 | 89 | 89 | 86 |
| E4 | On | 64 | 65 | 67 | 68 | 78 |
| E5 | On | 68 | 68 | 69 | 64 | 58 |
TABLE 3. Table Showing the RR of a Subject Obtained From Self-Reporting, Compared With RR Computed From a iPPG Obtained From the Forehead of the Subject (With Phone-Flash). The iPPG was Computed Using Average Values of (A) Hue Within a Range of 0–0.1 (B) Hue (C) Green and (D) Saturation (For Pixels With Hue Within a Range of 0–0.1).
| Subject | Flash | Self Reported | Hue (0–0.1) | Hue | Green | Sat. with Hue (0–0.1) |
|---|---|---|---|---|---|---|
| A1 | On | 14 | 12 | 12 | 12 | 12 |
| A2 | On | 14 | 12 | 12 | 14 | 12 |
| A3 | On | 20 | 12 | 12 | 23 | 16 |
| A4 | On | 32 | 16 | 14 | 9 | 16 |
| A5 | On | 22 | 23 | 9 | 14 | 14 |
| B1 | On | 17 | 19 | 19 | 12 | 19 |
| B2 | On | 19 | 18 | 18 | 21 | 23 |
| B3 | On | 12 | 10 | 8 | 14 | 17 |
| B4 | On | 22 | 23 | 22 | 19 | 14 |
| B5 | On | 19 | 21 | 21 | 24 | 25 |
| C1 | On | 12 | 12 | 12 | 12 | 12 |
| C2 | On | 25 | 23 | 24 | 26 | 17 |
| C3 | On | 15 | 12 | 11 | 12 | 26 |
| C4 | On | 17 | 18 | 19 | 20 | 18 |
| C5 | On | 12 | 13 | 14 | 9 | 24 |
| D1 | On | 19 | 19 | 19 | 16 | 14 |
| D2 | On | 13 | 11 | 12 | 19 | 19 |
| D3 | On | 22 | 22 | 22 | 23 | 16 |
| D4 | On | 15 | 17 | 19 | 19 | 14 |
| D5 | On | 12 | 13 | 12 | 13 | 13 |
| E1 | On | 21 | 23 | 14 | 19 | 12 |
| E2 | On | 17 | 18 | 19 | 19 | 21 |
| E3 | On | 16 | 17 | 18 | 16 | 11 |
| E4 | On | 22 | 23 | 23 | 28 | 32 |
| E5 | On | 20 | 22 | 22 | 19 | 27 |
TABLE 4. Table Showing the HR of a Subject Obtained From the Pulse Oximeter, Compared With HR Computed From a iPPG Obtained From the Forehead of the Subject (With Phone-Flash Off). The iPPG was Computed Using Average Values of (A) Hue Within a Range of 0–0.1 (B) Hue (C) Green and (D) Saturation (For Pixels With Hue Within a Range of 0–0.1).
| Subject | Flash | Pulse Ox. | Hue (0–0.1) | Hue | Green | Sat. with Hue (0–0.1) |
|---|---|---|---|---|---|---|
| A1 | Off | 69 | 70 | 70 | 70 | 70 |
| A2 | Off | 76 | 66 | 66 | 73 | 73 |
| A3 | Off | 84 | 49 | 49 | 49 | 86 |
| A4 | Off | 57 | 52 | 66 | 68 | 68 |
| A5 | Off | 70 | 68 | 63 | 68 | 68 |
| B1 | Off | 73 | 70 | 69 | 69 | 80 |
| B2 | Off | 81 | 78 | 78 | 76 | 71 |
| B3 | Off | 65 | 57 | 56 | 61 | 52 |
| B4 | Off | 63 | 67 | 66 | 69 | 60 |
| B5 | Off | 87 | 89 | 93 | 95 | 86 |
| C1 | Off | 84 | 87 | 87 | 73 | 80 |
| C2 | Off | 64 | 67 | 69 | 78 | 72 |
| C3 | Off | 78 | 71 | 71 | 70 | 66 |
| C4 | Off | 89 | 84 | 83 | 76 | 79 |
| C5 | Off | 91 | 89 | 84 | 82 | 76 |
| D1 | Off | 82 | 88 | 88 | 93 | 70 |
| D2 | Off | 94 | 85 | 86 | 78 | 73 |
| D3 | Off | 71 | 79 | 78 | 82 | 84 |
| D4 | Off | 67 | 64 | 65 | 86 | 79 |
| D5 | Off | 62 | 64 | 67 | 71 | 86 |
| E1 | Off | 62 | 67 | 67 | 70 | 70 |
| E2 | Off | 67 | 66 | 66 | 73 | 73 |
| E3 | Off | 89 | 82 | 83 | 81 | 76 |
| E4 | Off | 75 | 72 | 72 | 69 | 68 |
| E5 | Off | 81 | 84 | 85 | 86 | 89 |
TABLE 5. Table Showing the RR of a Subject Obtained From Self-Reporting, Compared With RR Computed From a iPPG Obtained From the Forehead of the Subject (With Phone-Flash Off). The iPPG was Computed Using Average Values of (A) Hue Within a Range of 0–0.1 (B) Hue (C) Green and (D) Saturation (For Pixels With Hue Within a Range of 0–0.1).
| Subject | Flash | Self Reported | Hue (0–0.1) | Hue | Green | Sat. with Hue (0–0.1) |
|---|---|---|---|---|---|---|
| A1 | Off | 12 | 12 | 12 | 16 | 16 |
| A2 | Off | 14 | 14 | 14 | 21 | 16 |
| A3 | Off | 26 | 21 | 21 | 12 | 16 |
| A4 | Off | 26 | 21 | 21 | 21 | 14 |
| A5 | Off | 24 | 23 | 23 | 9 | 14 |
| B1 | Off | 14 | 11 | 10 | 19 | 27 |
| B2 | Off | 21 | 23 | 24 | 14 | 27 |
| B3 | Off | 19 | 14 | 15 | 10 | 29 |
| B4 | Off | 17 | 19 | 22 | 20 | 26 |
| B5 | Off | 15 | 12 | 12 | 9 | 19 |
| C1 | Off | 25 | 24 | 23 | 19 | 29 |
| C2 | Off | 11 | 12 | 14 | 19 | 21 |
| C3 | Off | 13 | 12 | 13 | 17 | 15 |
| C4 | Off | 17 | 17 | 19 | 19 | 24 |
| C5 | Off | 19 | 14 | 12 | 13 | 7 |
| D1 | Off | 25 | 12 | 12 | 16 | 16 |
| D2 | Off | 10 | 09 | 06 | 19 | 18 |
| D3 | Off | 22 | 25 | 27 | 12 | 10 |
| D4 | Off | 14 | 19 | 18 | 21 | 24 |
| D5 | Off | 23 | 21 | 22 | 29 | 25 |
| E1 | Off | 16 | 17 | 14 | 24 | 12 |
| E2 | Off | 20 | 18 | 19 | 22 | 24 |
| E3 | Off | 11 | 13 | 14 | 17 | 23 |
| E4 | Off | 27 | 24 | 24 | 22 | 8 |
| E5 | Off | 15 | 18 | 17 | 21 | 19 |
The face video based approaches in literature show that observables designed to measure HR and RR using the Green channel outperform Red or Blue channel [23]. Table.2 and Table.3, show that the Hue channel and particularly the Hue channel within a range of 0–0.1 show excellent correspondence with the experimentally measured data as compared to the other observables including the Green channel. Also, the average Saturation as a function of time (for pixels with Hue within a range of 0–0.1), shows the least correlation with the experimental data.
B. Quantitative Comparison of Accuracy of Measurement of HR and RR Obtained From the iPPG Signal Using the Hue Channel Versus With Green Channel
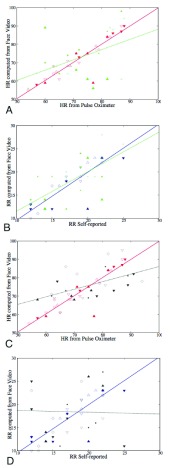
We can further use inferential statistics such as linear fitting, to plot different sets of computed HR/RR with their corresponding measured values. The closer the slope of the fitted line ( ) is to 1, higher is the correlation. In the case of HR as shown in Fig.7.A. the
  using Hue (0–0.1) (Red line) is 0.9885, and using Green channel (Green line) is 0.5576. In the case of RR as shown in Fig.7.B. the
  using Hue (0–0.1) (Blue line) is 1.0386, and using Green channel (Green line) is 0.8545. This shows that HR and RR measured using iPPG obtained from Hue (0–0.1) is quantitatively better than the Green channel. In Fig. 7.C. and D. we have used the
  to compare the accuracy of HR and RR measured in the presence and absence of a flash illuminating the subject’s face. In the case of HR using Hue (0–0.1) as shown in Fig.7.C. the
  obtained using flash (Red line) is 0.9885, and in the absence of flash (Grey line) is 0.4118. This is even more distinct, in the case of RR using Hue (0–0.1) as shown in Fig.7.B. where the
  obtained using flash (Blue line) is 1.0386, and in the absence of flash (Gray line) is −0.0388. This shows that additional illumination can substantially increase the accuracy of measuring the HR and RR.
FIGURE 7.
Scatter plots comparing accuracy of HR and RR obtained from a iPPG using a face video, with standard approaches for measuring HR (Panel A and C) and RR (Panel B and D). Panel A shows results for HR computed using two iPPGs obtained from a single video with flash on (a) Hue (0–0.1) (Red Full) and (b) Green channel (Green Dashed), compared with HR measured using pulse oximetry. Panel B shows results for RR computed using two iPPG obtained from a single video with flash on (a) Hue (0–0.1) (Blue Full) and (b) Green channel (Green Dashed), compared with RR measured using self reporting. Panel C shows results for HR computed using two iPPG obtained from two separate videos (a) Hue (0–0.1) with flash on (Red Full) and (b) Hue (0–0.1) with flash off (Grey Dashed), compared with HR measured using pulse oximetry. Panel D shows results for RR computed using (a) Hue (0–0.1) with flash on (Blue Full) and (b) Hue (0–0.1) with flash off (Grey Dashed), compared with RR measured using self reporting. In each set of data their are 5 subgroups based on skin types, Caucasian male (Triangle Up Fill), Caucasian female (Triangle Up), African male (Triangle Down Fill), Africa female (Triangle Down) and Indian Male (Empty Box).
This could be further illustrated using the Pearson Correlation test, where  equals to 1 (or −1) corresponds to a linear correlation,
  equals to 0 corresponds to no linear correlation. In the case of HR the Pearson’s
  using Hue (0–0.1) is 0.9201, and using Green channel is 0.4916. In the case of RR the Pearson’s
  using Hue (0–0.1) is 0.6575, and using Green channel is 0.3352. Like the scatter plots the Pearson Correlation tests show, that HR and RR measured using iPPG obtained from Hue (0–0.1) is quantitatively better than the Green channel. In the case of HR using Hue (0–0.1) the Pearson’s
  obtained using flash is 0.9201, and in the absence of flash is 0.3373. In the case of RR using Hue (0–0.1) the Pearson’s
  obtained using flash is 0.6575, and in the absence of flash is −0.07707. The Pearson Correlation tests also show that additional illumination can substantially increase the accuracy of measuring the HR and RR.
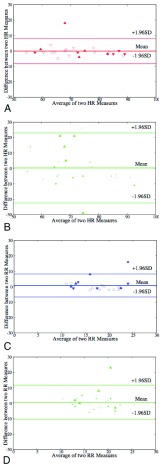
Once we have established, that the face videos illuminated with flash works better, we further analyse those results using the Bland-Altman plots as show in Fig.8. The corresponding mean of difference and standard deviation of difference (drawn as lines in Fig.8) are tabulated in Table.1. In the case of HR the standard deviation of the difference, using Hue (0–0.1) is 4.16 (as shown in Fig.8.A.), and using Green channel is 0.28 (as shown in Fig.8.B.). In the case of RR standard deviation of the difference using Hue (0–0.1) is 5.64 (as shown in Fig.8.A.), and using Green channel is 0.28 (as shown in Fig.8.B.). This further illustrates that the Hue (0–0.1) approach works better than Green for both HR and RR.
FIGURE 8.
Bland-Altman plots comparing accuracy of HR and RR obtained from a iPPG using a face video, with standard approaches for measuring HR (Panel A and B) and RR (Panel C and D). Panel A shows results for HR computed using Hue (0–0.1), compared with HR measured using pulse oximetry. Panel B shows results for HR computed using Green channel, compared with HR measured using pulse oximetry. Panel C shows results for RR computed using Hue (0–0.1), compared with RR measured using self reporting. Panel D shows results for RR computed using Green Channel, compared with RR measured using self reporting. In each set of data their are 5 subgroups based on skin types, Caucasian male (Triangle Up Fill), Caucasian female (Triangle Up), African male (Triangle Down Fill), African female (Triangle Down) and Indian Male (Empty Box).
TABLE 1. Accuracy of Measuring HR and RR Using iPPG Obtained From Video With Flash on, (A) Hue Within a Range of 0–0.1 (B) Green.
| Statistic | HR Hue (0–0.1) | Green | RR Hue (0–0.1) | Green |
|---|---|---|---|---|
| Mean of difference | −0.12 | 0.28 | 0.8 | 0.68 |
| Standard Deviation of difference | 4.16 | 11.59 | 3.8 | 5.64 |
| Paired Student t-test, p-value | 0.8887 | 0.9068 | 0.2885 | 0.5608 |
| RMSE (BPM) | 4.1617 | 11.6017 | 3.8884 | 5.6885 |
The efficacy of the Hue (0–0.1) approach over the Green channel, is further illustrated using the paired student’s t-test (as tabulated in Table.1). Where the in the case of HR the p-value, using Hue (0–0.1) is 0.8887, and using Green is 0.9068. Similarly in the case of RR the p-value, using Hue (0–0.1) is 0.2885, and using Green is 0.5608.
The standard for HR monitors as set by Advancement of Medical Instrumentation EC-13 states that, the accuracy requirements are root mean square error (RMSE) ≤ 5 BPM or ≤ 10%, whichever is greater. The RMSE values for HR using Hue (0–0.1) is 0.8887 BPM, and using Green is 0.9068 BPM. The RMSE values for RR using Hue (0–0.1) is 3.8884 BPM, and using Green is 5.6885 BPM. This clearly illustrates that the Hue (0–0.1) approach gives better results than traditional Green channel.
V. Conclusion
In this study, we have introduced a novel noninvasive approach to measure pulse and respiratory rate from a short video of the subject’s face. Unlike traditional iPPG approaches that measures the fluctuation of a particular RGB color space, we have measured the fluctuation in the Hue channel in the HSV color space. Since this observable primarily depends on the AC component of the pulsatile blood, this observable is a more accurate and robust approach to measure vital signs using a video. In this study, we have further shown that (1) HR and RR derived from iPPG obtained using the Hue channel (range 0–0.1) gives the most co-related results with standard instruments. (2) The HR and RR derived from iPPG in obtained from videos shot with an additional flash based illumination, is qualitatively better than those obtained without the flash light. This is further demonstrated since the Pearson’s r and RMSE values obtained using Hue (0–0.1) at rest in our current work is 0.9201 and 4.1617, compared to 0.89 and 6 obtained using green channel (before post-processing) as reported by Poh et al. [23].
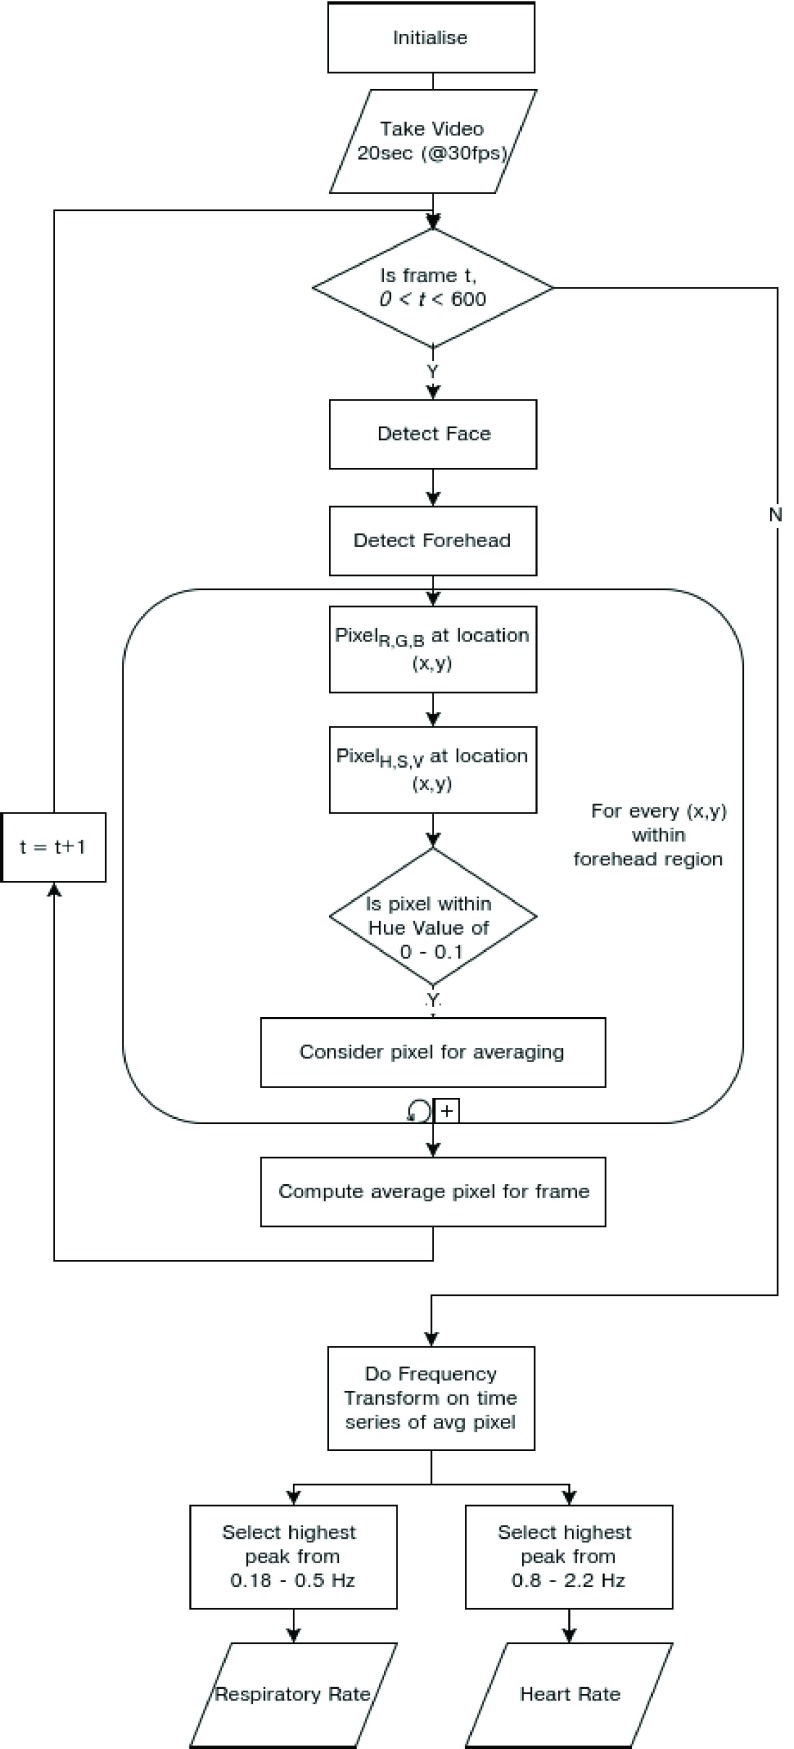
We have summarized our approach in the form of an flowchart as shown in Fig.9.
FIGURE 9.
Schematic representation of the process to compute iPPG using average Hue from 0 – 0.1.
However our proposed algorithms will not work in a number of real world scenarios. For example, if the forehead is partially / fully covered with hair (hairstyles such as devilock, bob cut, bettie page and beehive) or a head-gear (hat, cap, turban), or in the presence of scar tissue on forehead, and instances in which the facial detection algorithm does not detect a face due to non-traditional facial features such as presence of a heavy beard. Further studies are required to understand effects of external lighting, skin color and movement on the accuracy of the final results. In addition more accurate facial mapping technology to find the forehead region can be implemented to improve the accuracy of the face based pulse and respiratory rate detection method.
These current findings could be easily translated to a smartphone camera application to measure HR using a camera flash as an illumination source, more accurately than the current market alternatives. Smartphone applications (or APIs) coupled with such technology, will have further applications as a Software As A Medical Device (SAAMD) in the video based telemedicine market allowing an average user to monitor their HR and RR without buying additional equipment. The telemedicine market includes tele-hospital care (where the consultant doctor can dial in for monitoring patients), and tele-home care (where remote healthcare connection (initiated by the patient) with a network of clinicians is usually available 24/7 for non emergency care). The clinical relevance of telemedicine been accelerated by the advent of tele-home care platforms such as Babylon Health, MDLive, Doctor On Demand, Teladoc, and LiveHealth Online.
In addition HR measured in clinical settings using electrocardiogram (ECG), requires patients to wear chest straps with adhesive gel patches that can be both uncomfortable and abrasive for the user. HR monitored using pulse oximetry at the finger-tip or the earlobe can also be inconvenient for long-term wear. A video based software solution will be critical towards avoiding such inconveniences. This is of particular interest to neo-natal and elderly care, where contact based approaches can cause additional irritation to the subjects’ fragile skin.
In summary, we hope this will lead to development of easy to access smartphone camera based technology, for continuous monitoring of vital signs both for fitness applications as well as predicting the overall health of the user.
Acknowledgment
The authors report salaries, personal fees and non-financial support from their employer Think Biosolution Limited, which is active in the field of camera-based diagnostics and fitness tracking, outside the submitted work.
References
- [1].Song W., Yu H., Liang C., Wang Q., and Shi Y., “Body monitoring system design based on android smartphone,” in Proc. World Congr. Inf. Commun. Technol. (WICT), Nov. 2012, pp. 1147–1151. [Google Scholar]
- [2].Kinsa Smart Thermometer. Accessed: Sep. 18, 2016. [Online]. Available: https://kinsahealth.com/
- [3].Al-Ali A. and Kiani M. E., “Pulse oximeter monitor for expressing the urgency of the patient’s condition,” U.S. Patent 6 542 764, Apr. 1, 2003.
- [4].Achten J. and Jeukendrup A. E., “Heart rate monitoring,” Sports Med., vol. 33, no. 7, pp. 517–538, 2003. [DOI] [PubMed] [Google Scholar]
- [5].Jonathan E. and Leahy M., “Investigating a smartphone imaging unit for photoplethysmography,” Physiol. Meas., vol. 31, no. 11, p. N79, 2010. [DOI] [PubMed] [Google Scholar]
- [6].Deepu C. J., Zhang X., Liew W.-S., Wong D. L. T., and Lian Y., “Live demonstration: An ecg-on-chip for wearable wireless sensors,” in Proc. IEEE Asia–Pacific Conf. Circuits Syst., Nov. 2014, pp. 177–178. [Google Scholar]
- [7].Takacs J., Pollock C. L., Guenther J. R., Bahar M., Napier C., and Hunt M. A., “Validation of the fitbit one activity monitor device during treadmill walking,” J. Sci. Med. Sport, vol. 17, no. 5, pp. 496–500, 2014. [DOI] [PubMed] [Google Scholar]
- [8].Fitbit. Accessed: Sep. 18, 2016. [Online]. Available: https://fitbit.com/
- [9].Lee W., Chae Y. M., Kim S., Ho S. H., and Choi I., “Evaluation of a mobile phone-based diet game for weight control,” J. Telemed. Telecare, vol. 16, no. 5, pp. 270–275, 2010. [DOI] [PubMed] [Google Scholar]
- [10].Nundy K. K. and Sanyal S., “A low cost vein detection system using integrable mobile camera devices,” in Proc. Annu. IEEE India Conf. (INDICON), Dec. 2010, pp. 1–3. [Google Scholar]
- [11].Tran J., Tran R., and White J. R., “Smartphone-based glucose monitors and applications in the management of diabetes: An overview of 10 salient ‘Apps’ and a novel smartphone-connected blood glucose monitor,” Clin. Diabetes, vol. 30, no. 4, pp. 173–178, 2012. [Google Scholar]
- [12].Rolfe P., “In vivo near-infrared spectroscopy,” Annu. Rev. Biomed. Eng., vol. 2, no. 1, pp. 715–754, Aug. 2000. [DOI] [PubMed] [Google Scholar]
- [13].Roald N. G., “Estimation of vital signs from ambient-light non-contact photoplethysmography,” Ph.D. dissertation, Dept. Electron. Telecommun, Norwegian Univ. Sci. Technol, Trondheim, Norway, 2013. [Google Scholar]
- [14].Tamura T., Maeda Y., Sekine M., and Yoshida M., “Wearable photoplethysmographic sensors—past and present,” Electronics, vol. 3, no. 2, pp. 282–302, 2014. [Google Scholar]
- [15].Zijlstra W. G., Buursma A., and Meeuwsen-van der Roest W. P., “Absorption spectra of human fetal and adult oxyhemoglobin, de-oxyhemoglobin, carboxyhemoglobin, and methemoglobin,” Clin. Chem., vol. 37, no. 9, pp. 1633–1638, 1991. [PubMed] [Google Scholar]
- [16].Task Force of the European Society of Cardiology the North American Society of Pacing Electrophysiology, “Heart rate variability standards of measurement, physiological interpretation, and clinical use,” Eur. Heart J., vol. 17, pp. 354–381, 1996. [PubMed] [Google Scholar]
- [17].Instant Heart Rate by Azumio. Accessed: Sep. 18, 2016. [Online]. Available: http://www.azumio.com/s/instantheartrate/index.html
- [18].Rubins U., Upmalis V., Rubenis O., Jakovels D., and Spigulis J., “Real-time photoplethysmography imaging system,” IFMBE Proc., vol. 34, no. 2008, pp. 183–186, 2011. [Google Scholar]
- [19].Wu H.-Y., Rubinstein M., Shih E., Guttag J., Durand F., and Freeman W., “Eulerian video magnification for revealing subtle changes in the world,” ACM Trans. Graph., vol. 31, no. 4, 2012, Art. no. 65. [Google Scholar]
- [20].Poets C. F. and Stebbens V. A., “Detection of movement artifact in recorded pulse oximeter saturation.,” Eur. J. Pediatrics, vol. 156, no. 10, pp. 808–811, Oct. 1997. [DOI] [PubMed] [Google Scholar]
- [21].Stojanovic R. and Karadaglic D., “A LED-LED-based photoplethysmography sensor,” Physiol. Meas., vol. 28, no. 6, pp. N19–N27, Jun. 2007. [DOI] [PubMed] [Google Scholar]
- [22].Goldman J. M., Petterson M. T., Kopotic R. J., and Barker S. J., “Masimo signal extraction pulse oximetry,” J. Clin. Monitor. Comput., vol. 16, no. 7, pp. 475–483, Jan. 2000. [DOI] [PubMed] [Google Scholar]
- [23].Poh M.-Z., McDuff D. J., and Picard R. W., “Non-contact, automated cardiac pulse measurements using video imaging and blind source separation.,” Opt. Exp., vol. 18, no. 10, pp. 10762–10774, 2010. [DOI] [PubMed] [Google Scholar]
- [24].Humphreys K., Ward T., and Markham C., “A CMOS camera-based pulse oximetry imaging system,” in Proc. IEEE Eng. Med. Biol. 27th Annu. Conf., vol. 4 Jun. 2005, pp. 3494–3497. [DOI] [PubMed] [Google Scholar]
- [25].Wu D., Yang P., Liu G.-Z., and Zhang Y.-T., “Automatic estimation of respiratory rate from pulse transit time in normal subjects at rest,” in Proc. IEEE-EMBS Int. Conf. Biomed. Health Informat., vol. 25 Jan. 2012, pp. 779–781. [Google Scholar]
- [26].Yilmaz T., Foster R., and Hao Y., “Detecting vital signs with wearable wireless sensors.,” Sensors, vol. 10, no. 12, p. 10837, Jan. 2010. [DOI] [PMC free article] [PubMed] [Google Scholar]
- [27].Simoes E. A., Roark R., Berman S., Esler L. L., and Murphy J., “Respiratory rate: Measurement of variability over time and accuracy at different counting periods,” Arch. Disease Childhood, vol. 66, no. 10, pp. 1199–1203, 1991. [DOI] [PMC free article] [PubMed] [Google Scholar]
- [28].Rolfe P., Zetterström R., and Persson B., “An appraisal of techniques for studying cerebral circulation in the newborn,” Acta Paediatr Scand, vol. 72, no. 311, pp. 5–13, 1983. [DOI] [PubMed] [Google Scholar]
- [29].Droitcour A. D.et al. , “Non-contact respiratory rate measurement validation for hospitalized patients,” in Proc. Annu. Int. Conf. IEEE Eng. Med. Biol. Soc., Sep. 2009, pp. 4812–4815. [DOI] [PMC free article] [PubMed] [Google Scholar]
- [30].Verkruysse W., Svaasand L. O., and Nelson J. S., “Remote plethysmographic imaging using ambient light,” Opt. Exp., vol. 16, no. 26, pp. 21434–21445, 2008. [DOI] [PMC free article] [PubMed] [Google Scholar]
- [31].Zhao F., Li M., Qian Y., and Tsien J. Z., “Remote measurements of heart and respiration rates for telemedicine,” PLoS ONE, vol. 8, no. 10, p. e71384, Oct. 2013. [DOI] [PMC free article] [PubMed] [Google Scholar]
- [32].Dangdang S., Yuting Y., Chenbin L., Francis T., Hui Y., and Nongjian T., “Noncontact monitoring breathing pattern, exhalation flow rate and pulse transit time,” IEEE Trans. Biomed. Eng., vol. 61, no. 11, pp. 2760–2767, Nov. 2014. [DOI] [PubMed] [Google Scholar]
- [33].Reyes B. A., Reljin N., Kong Y., Nam Y., and Chon K. H., “Tidal volume and instantaneous respiration rate estimation using a volumetric surrogate signal acquired via a smartphone camera,” IEEE J. Biomed. Health Inform., vol. 21, no. 3, pp. 764–777, May 2017. [DOI] [PubMed] [Google Scholar]
- [34].Henrie J., Kellis S., Schultz S., and Hawkins A., “Electronic color charts for dielectric films on silicon,” Opt. Exp., vol. 12, no. 7, pp. 1464–1469, 2004. [DOI] [PubMed] [Google Scholar]
- [35].RGB to HSV Color Conversion. Accessed: Sep. 18, 2016. [Online]. Available: http://www.rapidtables.com/convert/color/rgb-to-hsv.htm
- [36].Shaika K. B., Ganesana P., Kalista P., Sathisha B. S., and Jenitha J. M. M., “Comparative study of skin color detection and segmentation in HSV and YCbCr color space,” Procedia Comput. Sci., vol. 57, no. 2, pp. 41–48, 2015. [Google Scholar]
- [37].Albiol A., Torres L., and Delp E., “Optimum color spaces for skin detection,” in Proc. Int. Conf. Image Process. (ICIP), 2001, pp. 122–124. [Google Scholar]
- [38].Sigal L., Sclaroff S., and Athitsos V., “Estimation and prediction of evolving color distributions for skin segmentation under varying illumination,” Proc. IEEE Conf. Comput. Vis. Pattern Recognit., vol. 2 Jun. 2000, pp. 152–159. [Google Scholar]
- [39].Zarit B. D., Super B. J., and Quek F. K. H., “Comparison of five color models in skin pixel classification,” in Proc. Workshopon Recognit., Anal. Tracking Faces Gestures Real-Time Syst., Sep. 1999, pp. 58–63. [Google Scholar]
- [40].OpenCV Library. Accessed: Sep. 18, 2016. [Online]. Available: http://opencv.org/
- [41].Viola P. and Jones M., “Rapid object detection using a boosted cascade of simple features,” in Proc. IEEE Comput. Soc. Conf. Comput. Vis. Pattern Recognit., vol. 1 2001, pp. I-511–I-518. [Google Scholar]
- [42].Kasinski A. and Schmidt A., “The architecture and performance of the face and eyes detection system based on the haar cascade classifiers,” Pattern Anal. Appl., vol. 13, no. 2, pp. 197–211, 2010. [Google Scholar]
- [43].CMS50DL Pulse Oximeter User Manual. Accessed: Sep. 18, 2016. [Online]. Available: http://www.amperorblog.com/doc-lib/CMS50DL.pdf
- [44].Vital Signs (Body Temperature, Pulse Rate, Respiration Rate, Blood Pressure), Johns Hopkins Medicine Health Library. Accessed: Apr. 28, 2018. [Online]. Available: https://www.hopkinsmedicine.org/healthlibrary/conditions/adult/cardiovascular_diseases/vital_signs_body_temperature_pulse_rate_respiration_rate_blood_pressure_85,P00866
- [45].Association W. M., “World medical association declaration of helsinki: Ethical principles for medical research involving human subjects,” JAMA, vol. 310, no. 20, pp. 2191–2194, 2013. [DOI] [PubMed] [Google Scholar]


