Abstract
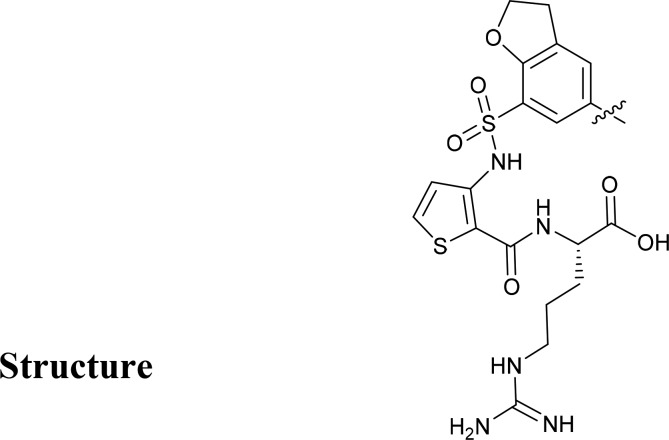
We report the design, synthesis, and biological evaluation of some potent small-molecule neuropilin-1 (NRP1) antagonists. NRP1 is implicated in the immune response to tumors, particularly in Treg cell fragility, required for PD1 checkpoint blockade. The design of these compounds was based on a previously identified compound EG00229. The design of these molecules was informed and supported by X-ray crystal structures. Compound 1 (EG01377) was identified as having properties suitable for further investigation. Compound 1 was then tested in several in vitro assays and was shown to have antiangiogenic, antimigratory, and antitumor effects. Remarkably, 1 was shown to be selective for NRP1 over the closely related protein NRP2. In purified Nrp1+, FoxP3+, and CD25+ populations of Tregs from mice, 1 was able to block a glioma-conditioned medium-induced increase in TGFβ production. This comprehensive characterization of a small-molecule NRP1 antagonist provides the basis for future in vivo studies.
Introduction
Neuropilin- 1 (NRP1) is a cell-surface coreceptor for a number of different growths factors, including several different isoforms of vascular endothelial growth factor (VEGF), transforming growth factor-β1 (TGF-β1), PLGF, HGF (also known as scatter factor) as well as Semaphorins 3A, 4F.1 As such, NRP1 plays key roles in both vascular and neuronal development.2,3 It has also been shown that NRP1 has an important immunological function.4 NRP1 is expressed on several types of immune cells, including T cells and dendritic cells, where it is one of the components of the immunological synapse.5 NRP1 is implicated in potentiating the function and survival of regulatory T cells (Tregs).6 This T cell fragility is linked to responses to PD1 checkpoint inhibitors.7 NRP1 expression can be used to distinguish Treg subsets arising in vivo, thus NRP1 is present on thymus derived Tregs (natural Tregs),8 whereas it is not present on Foxp3+ positive inducible Tregs.9,10 The Ikaros family protein Helios has been suggested as an additional and more general marker for thymic derived Tregs.11
NRP1 is also important in the control of the M2 shift in tumor associated macrophages/microglia in gliomas.12 NRP1 interacts with TGFβR1 to activate SMAD2/3 and drive secretion of TGF-β1, which results in expansion of Treg subsequent immune suppression.13−15 As the role of the immune system in cancer development becomes better understood,16 NRP1 is emerging as an attractive anticancer target.17 Novel drug compounds which act as NRP1 antagonists could therefore exhibit their anticancer effects in three different ways: blocking tumor angiogenesis by blocking the NRP1/VEGF-A interaction,18 preventing tumor cell migration by binding to NRP1,19 and reducing Treg or macrophage mediated suppression of the immune response.20
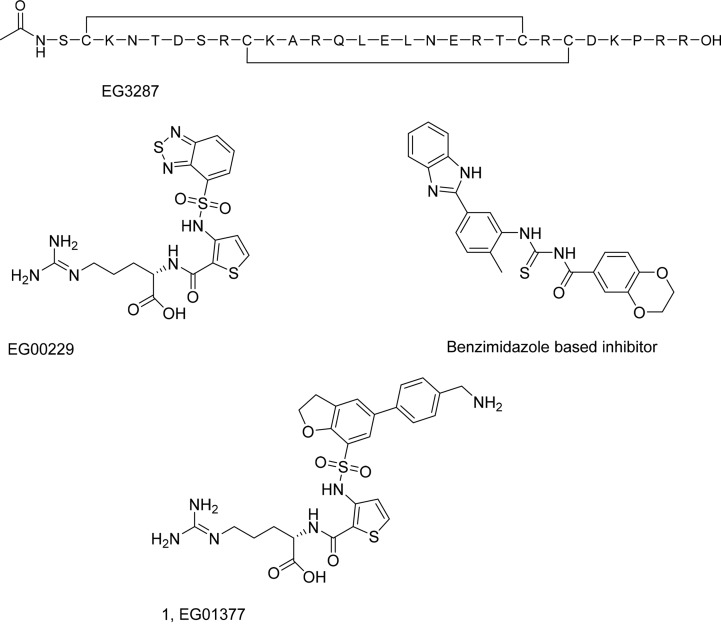
A number of peptide antagonists of neuropilin are known: ATWLPPR21 is a low affinity linear peptide, whereas a bicyclic disulfide bonded peptide, EG3287, is derived from the C-terminal domain of VEGF-A22 (Scheme 1). N-Terminal modification (N-octanoyl) resulted in a high affinity antagonist EG00086 (KD = 76 nM).23 EG00086 was also shown to inhibit VEGF-A mediated cell signaling, including cell adhesion, through reduction in p130Cas tyrosine phosphorylation. Its usefulness for in vivo studies was limited, however, by its low plasma stability (t1/2 < 5 min).23 In addition, NRP1 antibodies18 and a mini-protein based on the kalata cyclotide have been reported.24
Scheme 1. Previously Identified Small Molecule and Peptidic Antagonists of NRP1.
Development of a potent, small molecule NRP1 antagonist, with increased in vivo stability, would therefore be attractive. Despite the interest in this area, only a small number of molecules have been identified25−27 These molecules are reported to have micromolar potencies, and some antitumor effects have been claimed in vivo. The best characterized of these is (S)-2-(3-(benzo[c][1,2,5]thiadiazole-4-sulfonamido)thiophene-2-carboxamido)-5-((diaminomethylene)amino)pentanoic acid (EG00229), which has been previously identified as a specific inhibitor of the NRP1/VEGF-A interaction.27 Other compounds, such as the benzimidazole-based inhibitor exemplified by N-((5-(1H-benzo[d]imidazol-2-yl)-2-methylphenyl)carbamothioyl)-2,3-dihydrobenzo[b][1,4]dioxine-6-carboxamide were identified through screening approaches (Scheme 1).25 EG00229 was shown to inhibit the binding of biotinylated VEGFA (bt-VEGF-A) to NRP1 with an IC50 of 8 μM. It was also demonstrated to have functional effects on cell-migration and VEGF-R2 phosphorylation.27 Further studies have shown EG00229 to reverse an immune phenotype elicited by the immunomodulatory peptide tuftsin by blocking canonical TGFβ signaling through SMAD3/AKT.28 When delivered locally, the compound also inhibits glioma proliferation in vivo, replicating genetic ablation studies.12 In squamous cell carcinoma, the compound suppresses epidermal stem cell function and tumor formation in vivo.29 The binding mode of EG00229 has been confirmed by NMR and crystallographic studies, providing a useful starting point for the development of new NRP1 antagonists.27 Herein, we utilize EG00229 as a starting point for the discovery of potent and bioavailable inhibitors of the NRP1/VEGF-A interaction, resulting in the identification of 1 (EG013777) as a new lead.
Results and Discussion
Structure-Based Design of New NRP1 Antagonists
The crystal structure of EG00229 bound to human NRP1-b1 was previously solved to 2.9 Å resolution (PDB 3I97), and two different binding poses for the ligand were identified (Figure 1A,1B).27 The crystal structure revealed a close fit of the arginine portion of the molecule into the NRP1 binding pocket with near identical conformations observed for this part of the molecule. As previously noted, the 3-aminothiophene-2-carboxylic acid displays an H-bonded constrained conformation in the bound molecule, indicating the presence of an alternate tautomeric form of this substructure. In contrast, the positions of the benzothiadiazole group were markedly different. Although the two binding poses of EG00229 were distinct, the positions of the protein side chains were identical when overlapping the two chains, except for E348. We hypothesized that through further modification and elaboration of the EG00229 scaffold, more potent NRP1 antagonists could be synthesized. Using chain B as an illustration (Figure 1B), two key amino acids were identified which could be targeted either to improve existing H-bond interactions (S298) or to introduce new ones (E348).27
Figure 1.
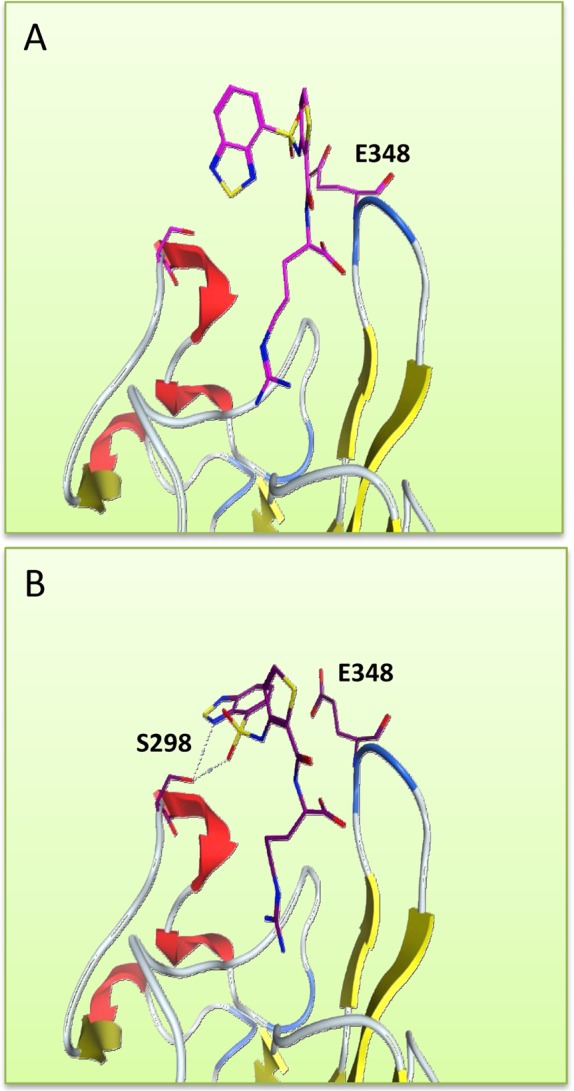
Two poses of EG00229 (PDB 3I97): C atoms in magenta and brown. In (B), a H-bond is formed with S298.
Chemistry
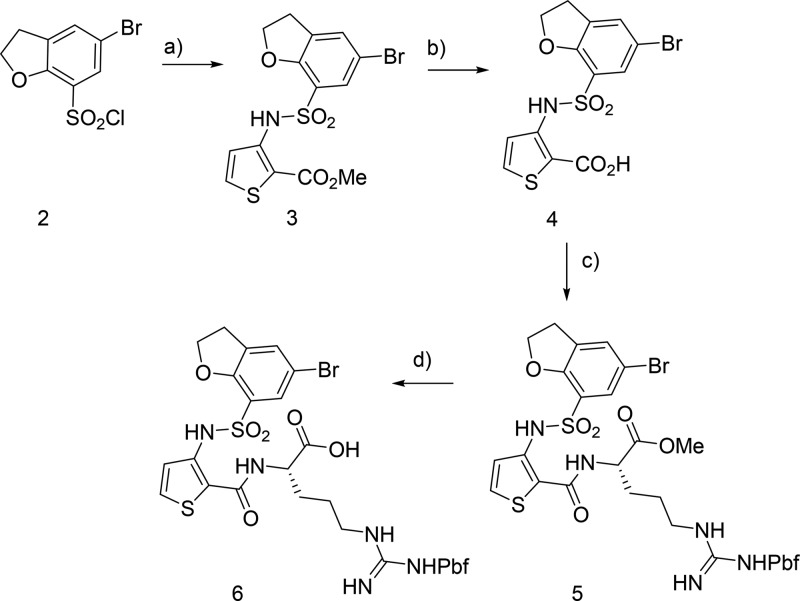
To target outer pocket residues, such as S298 and E348, a range of substituted dihydrobenzofurans were prepared. These were designed to be able to make potential hydrogen bonding or salt bridge contacts with the S298 and E348 residues. The first part of the general synthetic route for the 5-substituted dihydrobenzofuran series is shown (Scheme 2). The synthesis began with sulfonamide formation between 5-bromo-2,3-dihydrobenzofuran-7-sulfonyl chloride 2 and methyl 3-aminothiophene-2-carboxylate, to give sulfonamide 3. Hydrolysis of the methyl ester with LiOH gave acid 4, which was then coupled with the Pbf-protected arginine methyl ester to give 5. Subsequent hydrolysis of 5 gave the key intermediate 6, which was suitable for Suzuki–Miyaura couplings with a range of arylboronic acids.
Scheme 2. Synthesis of Brominated Dihydrobenzofuran Scaffold.
Reagents and conditions: (a) methyl 3-aminothiophene-2-carboxylate, pyridine, 0 °C to rt, 20 h; (b) LiOH, THF, MeOH, H2O, 45 °C, 20 h; (c) H-l-Arg(Pbf)-OMe, PyBrop, DIPEA, CH2Cl2, rt, 18 h; (d) LiOH·H2O, THF, H2O, rt, 3 h.
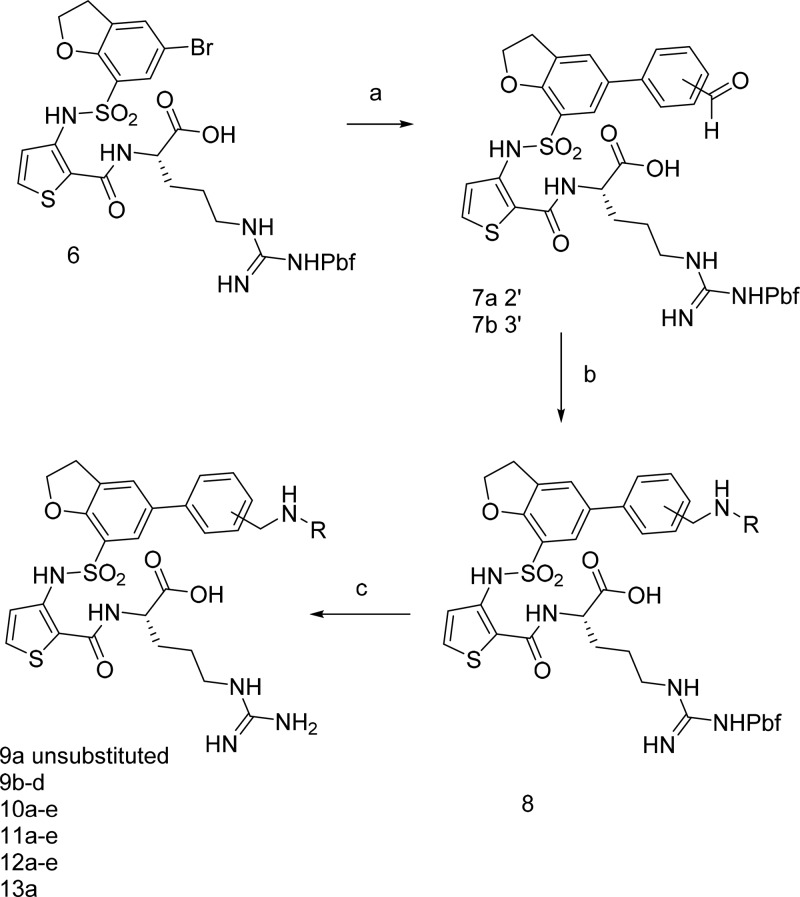
From this common brominated intermediate 6, a range of azaheterocycles were prepared as shown in (Scheme 3). First, intermediate 6 was coupled to either 2- or 3-formylphenyl boronic acid to give 7a,b, and then reductive aminations were carried out using the desired amine to furnish substituted analogues 8 (for definitions of R, see Tables 1–3). Removal of the Pbf-protecting group in acidic conditions gave the final products 9a–e, 10a–e (Table 1), 11a–e, 12a–e, and 13a (Table 2).
Scheme 3. Synthesis of Aryl Substituted Dihydrobenzofurans.
For definitions of R, see Tables 1–3. Reagents and conditions: (a) Pd(PPh4)Cl2, K2CO3, DME, H2O, 90°; (b) amine, AcOH, then NaHCNBH3, DMF; (c) DCM, TFA 1:1.
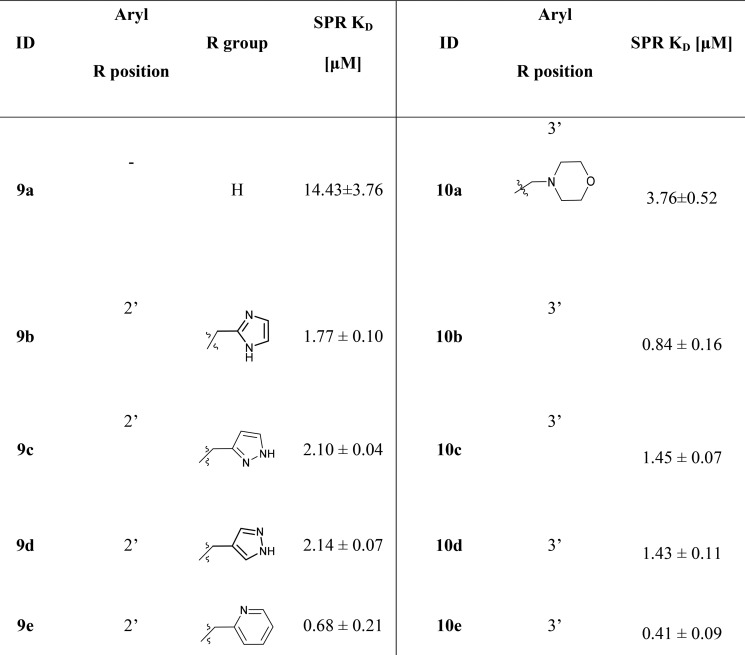
Table 1. Equilibrium Binding Constants for Substituted Azaheterocycles.

Table 3. Equilibrium Binding Constants for Methylamino Analogues.
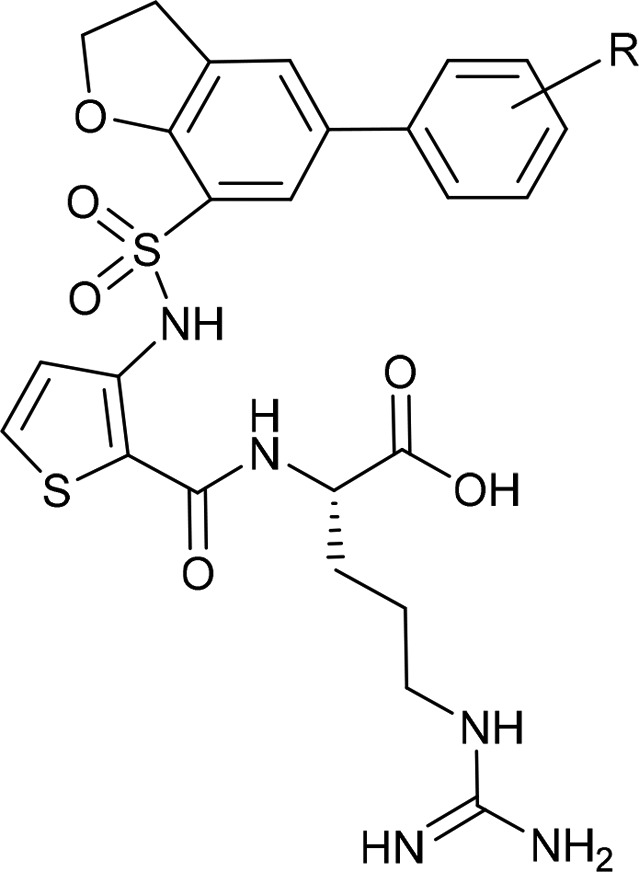
| ID | R | SPR KD [μM] |
|---|---|---|
| 13 | 3′-CH2NMe2 | 4.52 ± 1.36 |
| 15a | 2′-CH2NH2 | 1.87 ± 0.32 |
| 15b | 3′-CH2NH2 | 2.44 ± 0.71 |
| 1 | 4′-CH2NH2 | 1.32 ± 0.08 |
| 18a | 2′,3′-(CH2NHCH2) | 2.47 ± 0.25 |
| 18b | 3′,4′-(CH2NHCH2) | 2.17 ± 0.32 |
Table 2. Equilibrium Binding Constants for Substituted Methylpiperidines.
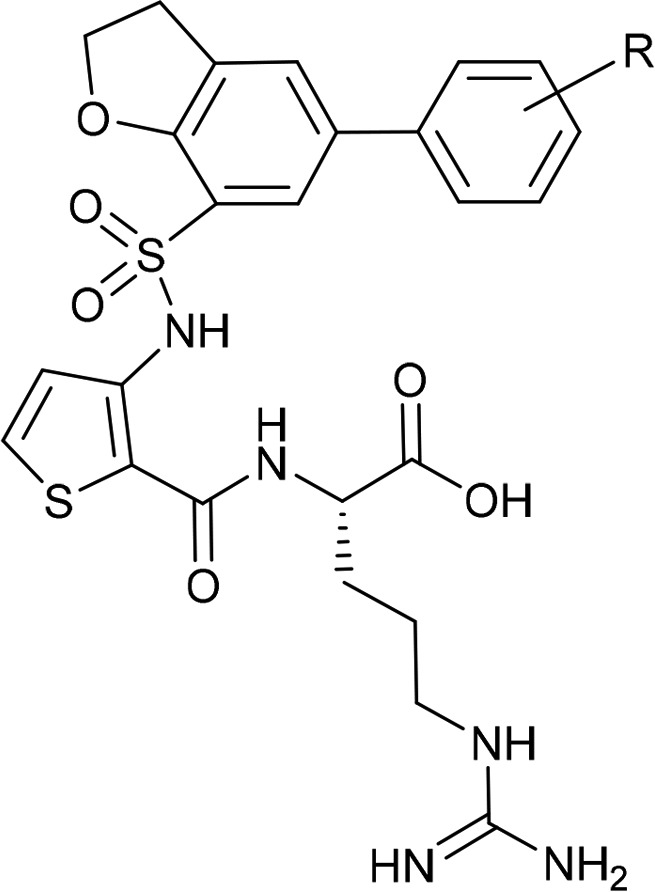
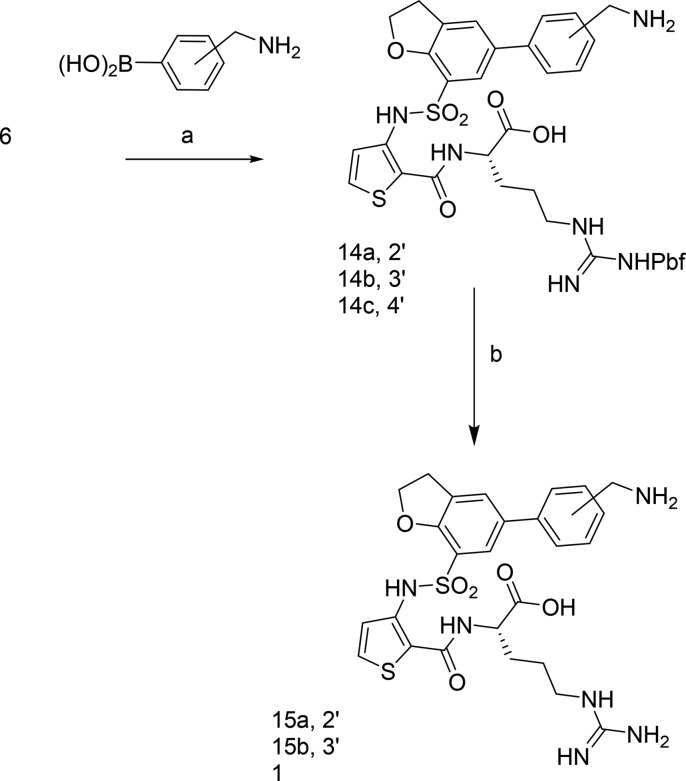
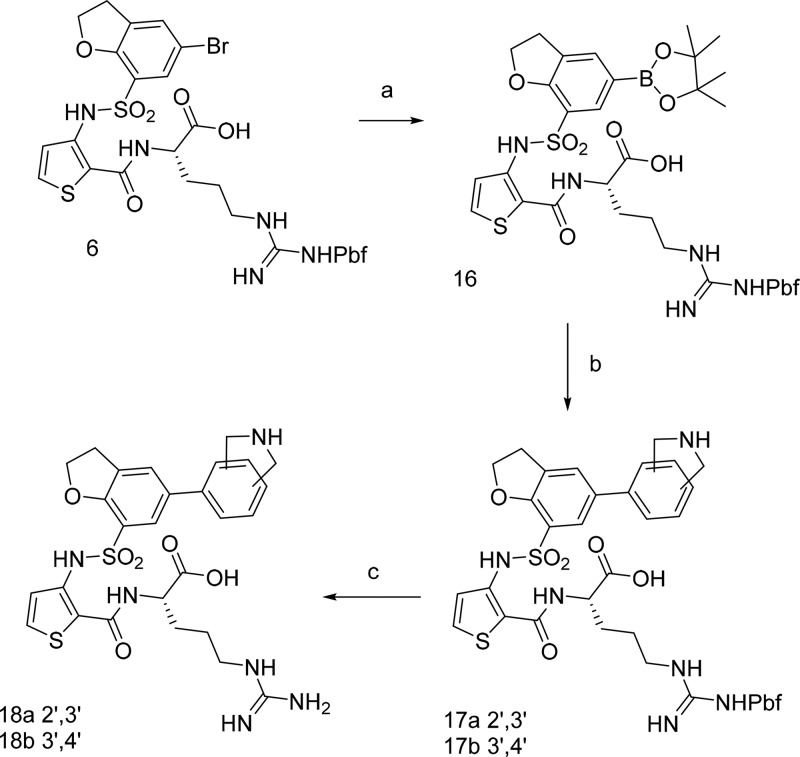
The synthesis of primary methylaminoaryl analogues was achieved by the use of preformed boronic acids (Scheme 4). Thus, 6 under Suzuki–Miyaura conditions with the 2- or 3-methylaminoboronic acids gave the intermediates 14a–c, which with Pbf removal gave the target molecules 15a, 15b, and 1. For large scale batches of 1, a slightly modified synthetic route was employed with a Boc protected methylaminoboronic acid (Supporting Information, Scheme S1). For the synthesis of cyclized isoindolyl analogues, 6 was transformed into the functionalized boronic acid 16 using bispinacolato diboron and Pd(dppf)Cl2, and this was used directly for the Suzuki–Miyaura coupling using potassium acetate as the base and Pd(PPh4) as the palladium catalyst (Scheme 5). In this case, cesium carbonate was preferred as the base. Final deprotection of the Pbf group furnished the isoindolyl analogues 18a and 18b.
Scheme 4. Synthesis of Methylaminoaryl Substituted Analogues.
Reagents (a) Pd(PPh4)Cl2, K2CO3, DME, H2O, 90°; (b) DCM, TFA 1:1.
Scheme 5. Synthesis of Isoindoyl Substituted Dihydrobenzofurans.
Reagents and conditions: (a) bispinacolato diboron, Pd(dppf)2Cl2, KOAc, dioxane; (b) Pd(PPh4)Cl2, CsCO3, DME, H2O, 90°; (c) DCM, TFA 1:1.
Crystallographic Studies of 1
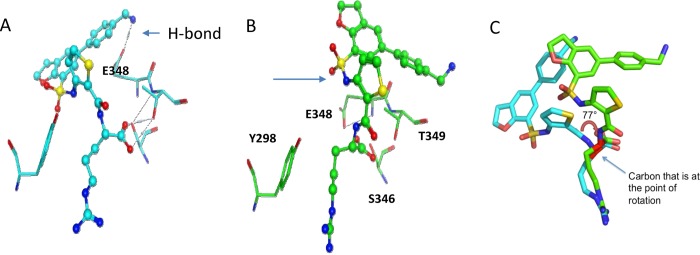
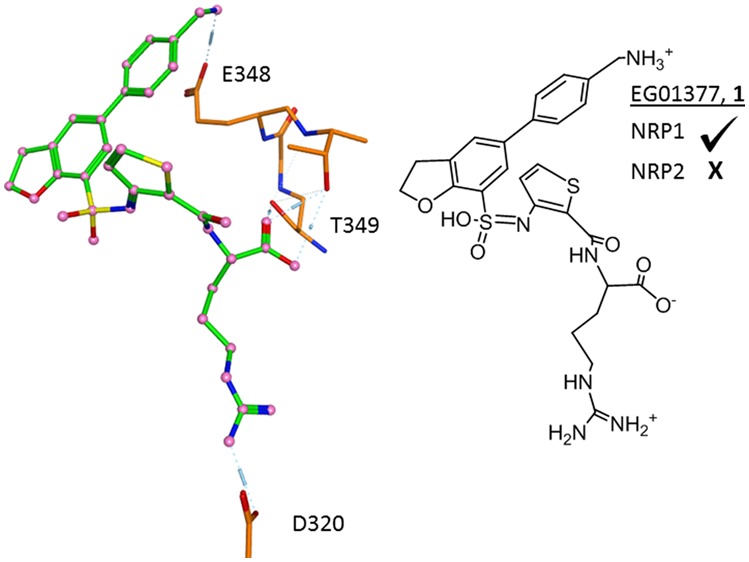
To further investigate the binding of 1 to NRP-1, X-ray crystallography studies were carried out. The differences in binding modes between 1 and EG00229 were then analyzed. The structure of 1 bound to NRP1-b1 was determined in two conformations: a high (0.9 Å) and a low (2.8 Å) resolution structure (Figure 1). The high-resolution crystal structure provides us with the most detailed view of the ligand-binding site to date. The refined model includes residues 273–427 of NRP1-b1, 39 non-hydrogen atoms of 1 and 472 water molecules. High resolution allowed us to observe multiple conformations of the side chains; 24 side chains were refined with at least two alternative rotamers. Comparison of NRP1-b1/compound 1 complexes indicate that the ligand can bind in two different conformations. In the low-resolution 2.8 Å structure (PDB 6FMF), the ligand’s bulky aromatics extend out of the back of the binding pocket. In the high resolution 0.9 Å structure (PDB 6FMC), they extend out of the top of the binding pocket (Figure 2). The difference in ligand conformation originates from a rotation about the carbon–carbon bond axis of the carboxyl group, which forms hydrogen bonds to S346 and T349. There is an approximate 77° rotation along this bond (Figure 2B and Supporting Information, Figure S1), resulting in more than 1 Å separation between the two different conformations. By exiting out of the top of the binding pocket, the ligand in the high-resolution structure forms additional interactions with the N-terminal residues (in particular G271–M276) of a symmetry mate located above the NRP1-b1 binding pocket. It is likely these interactions improve the crystal contacts, increasing crystal order, which is necessary to produce the higher resolution data explaining the difference in resolution between the two conformations. These contacts are however a crystallographic artifact, with the lower resolution structure more likely to represent the true conformation of 1 bound to NRP1-b1. The difference in ligand conformations results in a significant change in the side chain rotamer of E348. In the low resolution structure, E348 points away from the binding pocket and forms a hydrogen bond with the aryl-NH2 of 1, which may help to explain the compound’s increase in potency. In the high resolution structure, the aryl-NH2 of 1 does not interact with E348 changing the side chain rotamer such that it now faces toward the center of the binding pocket. The detection of the hydrogen-bond to E348 in the low resolution structure confirmed our modeling predictions.
Figure 2.
Two crystallized forms of 1 with NRP1-b1. (A) Low resolution 2.8 Å structure PDB 6FMF (cyan) shows the H-bond from the methylamino of 1 to E348. (B) High resolution 0.9 Å PDB 6FMC (green) showing alternate conformation of 1. The conformation of E348 is also different. (C) Overlay of low (cyan) and high (green) resolution structures showing bond rotation around the Cα-COO bond.
Biological Evaluation
All the compounds were evaluated using an SPR binding assay (Biacore) where recombinant NRP1-b1b2 protein was immobilized on a dextran coated chip.23 Selected compounds were then evaluated in competitive binding assay systems using biotinylated VEGF. As part of an extensive structure–activity investigation, the binding of 9a and 10a to the NRP1-b1 domain was assessed by SPR and promising activity noted for the morpholine extended analogue 10a with binding affinity of 3.76 ± 0.52 μM by SPR as opposed to 14.43 ± 3.76 μM for the unsubstituted compound 9a. This encouraging result prompted us to conduct a more focused structure–activity study around the 10a structure.
The first group of analogues examined heteroaryl substituents on the 2′ and 3′ positions. All of the synthesized compounds 9b–e and 10a–e showed binding to the NRP1-b1 domain, with some compounds demonstrating nanomolar KD values. Substitution at the 3-position seemed generally favorable, with all of the 3-substituted compounds, 10a–e, showing higher binding affinities than the 2-substituted analogues.
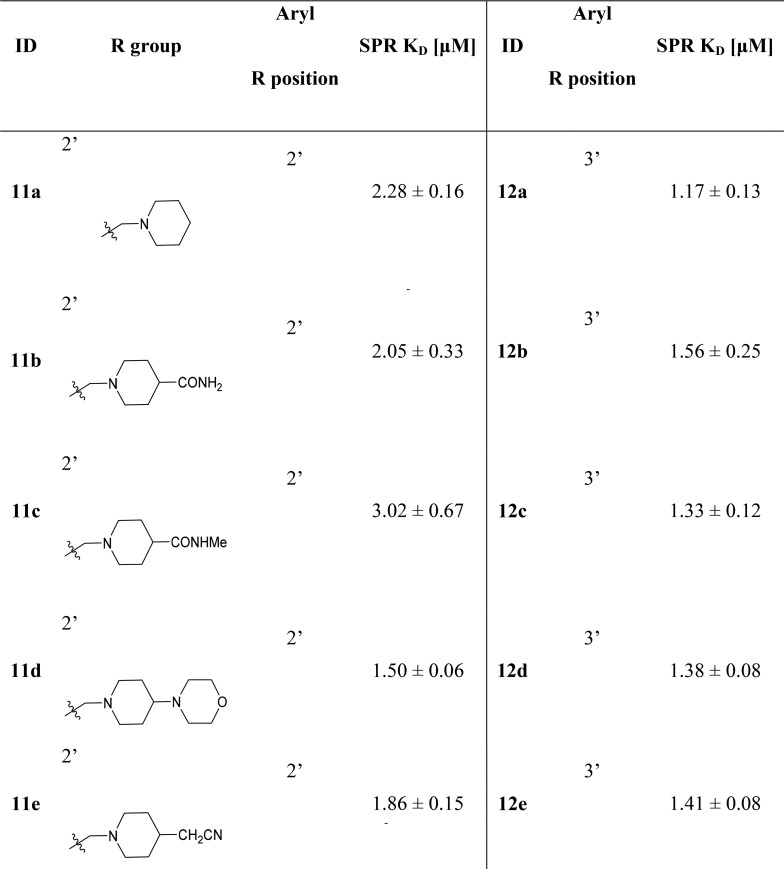
A further range of analogues, 11a–e and 12a–e, were designed which contained a functionalized piperidine linker to add length and flexibility to further explore outer-pocket interactions. Binding affinities to the NRP1-b1 domain were again assessed by SPR (Table 2).
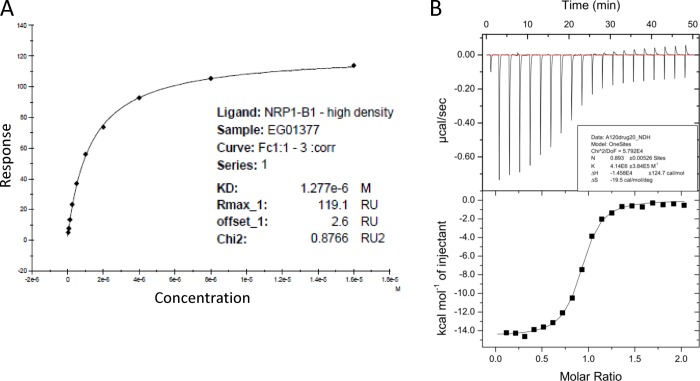
The resulting compounds once again showed binding to NRP1, although the binding affinities were generally lower than had been observed for the previous azaheterocyclic compounds. The highest binding affinity for this series was obtained for the nonfunctionalized piperidine 12a (KD = 1.17 μM). The generally lower binding affinities for 11a–e suggested that the addition of the piperidine linker was not an effective strategy to introduce specific interactions with any additional surface amino acid residues, and so this series was not pursued further. With these results in hand, a compound set with smaller methylamino substituents that could be accommodated at the 4-position was synthesized (Table 3). Compounds 1 and 13a–e showed consistent activity although this declined with the methylated analogue 13c. Compound 1 showed reasonable affinity (Figure 3A,B), which was encouragingly maintained in both cell-based and cell-free competition assays with bt-VEGF (Table 4). Isothermal calorimetry data for 1 fitted to a one-site binding model and provided an orthogonal assay system (Figure 3B). Evaluation of 1 against NRP2, a closely related receptor to NRP1, showed no detectable binding (Supporting Information, Figure S2), indicating very good selectivity. These results prompted us to investigate the pharmacokinetic profiles of some selected analogues.
Figure 3.
Biophysical binding data supports the interaction of compound 1 with NRP1-b1 protein. (A) Dose response analysis of equilibrium binding of 1 determined by SPR. (B) Isothermal calorimetry of 1 with NRP1-b1 using 19 consecutive injections of 1 (200 μM stock solution) applied at 2 min intervals.
Table 4. Cell-Free and Cell-Based Binding Data for Compound 1.
| binding assay | value |
|---|---|
| ITC NRP1-b1 (Ka) | 4.14 × 10⁶ ± 3.84 × 10⁵ |
| cell-free NRP1-a1,b1 (IC50) | 0.609 ± 0.066 μM |
| DU145/cells.Ad.NRP1, IC50 (HS) | 1.6 μM (0.9) |
Pharmacokinetics
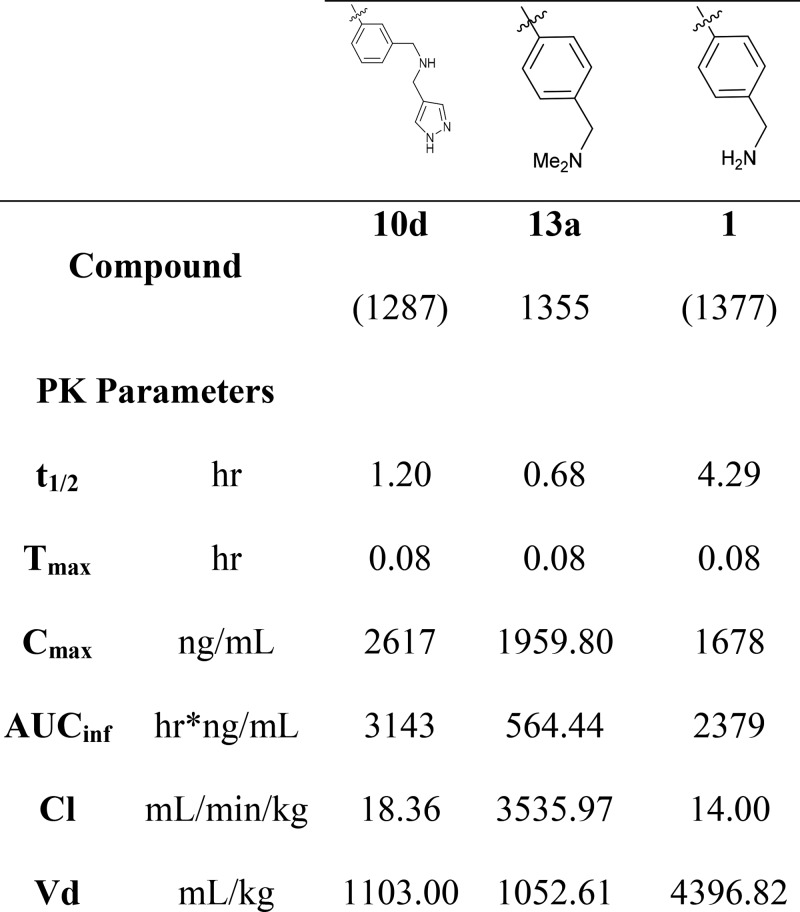
Both of the compounds from the dihydrobenzofuran series exhibited improved PK profiles over the historical compound EG00229, which has a relatively short half-life of 0.5 h.12 Compound 10d had a longer half-life (1.2 h) with an improved Vd of 1103 mL/kg (Table 4). Compound 1 also exhibited an encouraging half-life of 4.29 h, sufficient to sustain once per day dosing. The methylated analogue 13c showed less favorable parameters with a notably higher clearance and lower AUC than 1. With this data in hand demonstrating 1 to be a reasonably potent and stable inhibitor, we undertook a thorough biological characterization of 1 examining its antiangiogenic, antitumor, and immune effects.
Compound 1 Inhibits VEGF-A Stimulated Tyrosine Phosphorylation of VEGF-R2/KDR
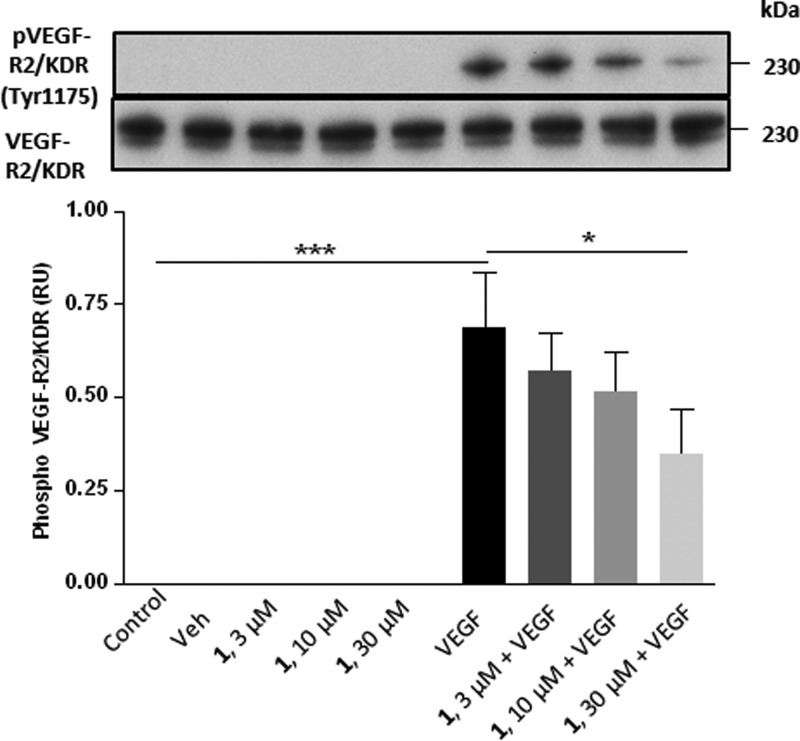
VEGF-A signaling through VEGF-R2/KDR plays an important role in cell function in endothelial, tumor, and other cell types.30 We investigated the effect of 1 on VEGF-R2/KDR tyrosine phosphorylation induced by VEGF-A in HUVECs. VEGF-A (1 ng /mL) stimulated a significant increase in VEGF-R2/KDR tyrosine phosphorylation at 10 min, which was inhibited by 50% on treatment with 1 at 30 μM (Figure 4). Studies with 1 had previously shown a 20% inhibition at 30 μM.27 These results once again indicate the importance of NRP1 for optimal VEGF function and signaling1 and confirmed the higher potency of 1 compared to EG00229 as indicated by its higher affinity for NRP1-b1 and higher potency in a cell-free binding assay.
Figure 4.
Compound 1 inhibits VEGF-A stimulated tyrosine phosphorylation of VEGF-R2/KDR. HUVECs were grown to confluence and serum-starved with medium containing 0.5% serum for 16 h. Cells were preincubated for 30 min with medium containing 0.1% DMSO (Veh) 3, 10, and 30 μM 1 or medium alone followed by stimulation with 1 ng mL–1 VEGF-A or with no further treatment (control) for 10 min. Cell lysates were then prepared, blotted, and probed with the indicated antibodies. The data shown are representative of three independent experiments. Quantitation of pVEGF-R2/KDR phosphorylation was performed by densitometry using ImageJ; see Materials and Methods. Data are presented as pVEGF-R2/KDR phosphorylation relative units (RU; means ± SEM) normalized to total VEGF-R2/KDR; p < 0.05 = * and p < 0.001 = ***.
Angiogenesis, Inhibition of VEGF-Induced Migration in HUVEC Cells
To investigate the importance of blocking NRP-1 in HUVEC cells, we performed transwell assays of chemotaxis and in vitro scratch assays of wound closure (chemokinesis). The transwell assay examines cell chemotaxis, the directional cell migration toward the chemo-attractant. To understand if 1 could inhibit VEGF-A-induced migration of HUVEC cells, 2 × 10⁵ HUVEC cells were plated in serum-free medium (EBM) with the addition of either 0.1% DMSO, 25 ng/mL VEGF-A, 1 (30 μM), or a combination of VEGF-A and 1 on the bottom chamber. Cells were allowed to migrate through the pores of the insets for 4 h. Data collected was consistent with previous reports,31 with VEGF-A being able to induce HUVEC cells migration by almost 3 times more compared to DMSO control (Figure 5A,B). Treatment of HUVEC cells with 1 alone did not influence the migratory ability of these cells but the administration of 1 at 30 μM in the presence of VEGF-A significantly reduces, by more than 60%, the ability of cells to migrate toward VEGF-A stimulus (Figure 5B). These results suggest that 1 has a higher potency than the previously reported compound, EG00229,27 that only displayed significant inhibition (≈34% reduction) once used at 100 μM in combination with VEGF-A.
Figure 5.

Compound 1 is able to significantly reduce HUVEC cell migration in response to VEGFA. (A) 8× magnified images representing HUVEC cells (stained in blue) that migrate through membrane pores toward serum free medium supplemented with 0.1% DMSO as vehicle control (Veh), VEGF 25 ng/mL, 1 (30 μM), and 1 (30uM) + VEGF 25 ng/mL. (B) Graphical representation. Data represent the average number of migrated cells of five independent experiments ± SEM; ***P ≤ 0.001. (C) HUVEC cells were starved overnight in 1% EBM before a precise scratch was generated using the WoundMaker (Essen BioScience). Migration was assessed in the presence or absence of medium containing 0.1%DMSO (Veh), VEGF 25 ng/mL, 1 (30 μM), and 1 (30 μM) + VEGF 25 ng/mL, using an IncuCyte ZOOM live-cell imaging platform. The graph represents three independent experiments: means ± SEM. Each treatment per experiment was performed in 12 replicates.
Wound Healing Scratch Assay
HUVEC cells were plated and once confluent a scratch was made as described in the methods. Cells were kept in culture for 5 days in 1% EGM with 0.1% DMSO, 25 ng/mL VEGF-A, 1 (30 μM), or a combination of VEGF-A and 1. Data shows that 1 can delay the VEGF-induced wound closure (Figure 5C).
Compound 1 in Combination with VEGF-A Reduces Network Area, Length, and Branching Points
Next, we used an organotypic endothelial–fibroblast coculture assay to recapitulate the endothelial tube formation characteristic of VEGF-A stimulated angiogenesis. The coculture assay of angiogenesis is a simple in vitro assay where HUVEC cells are cultured with human embryonic fibroblasts (HDF). The layer of fibroblasts secretes a complex extracellular matrix that contains collagen I with fibronectin, tenascin-C, decorin, and versican, mimicking the composition of tissue stroma. This matrix becomes remodelled into a 3D environment, allowing HUVECs to reorganize into a network of tubes.
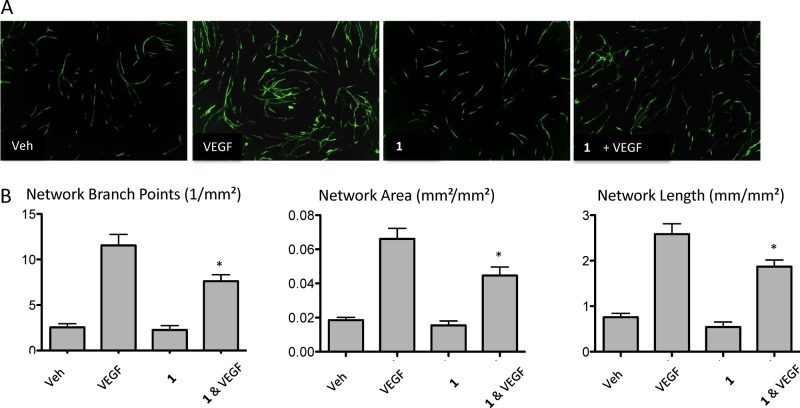
This assay is particularly suited to test factors that promote or inhibit angiogenesis. Thus, we next analyzed endothelial tubulogenesis in coculture HUVEC cells treated with either VEGF-A or VEGF-A + 1 during 4 days (Figure 6). Data collected shows that HUVEC cells stained for the endothelial marker Von Willebrand factor (VWF), have a ≈41% reduction in the number of VEGF-induced branch points in tubular networks upon NRP1 inhibition with 1 (Figure 6B). This reduction was also observed when overall network area (≈50%) and length (≈40%) (Figure 6B) were assessed. Results suggest that NRP1 inhibition can significantly influence the angiogenic properties of endothelial cells, thus being an attractive target to test on highly metastatic cancers that express NRP1.
Figure 6.
Blocking NRP1 is important for angiogenesis in a coculture assay. (A) Human dermal fibroblasts were grown in a 24-well format to confluence. HUVECs were seeded, treated with medium supplemented with 0.1%DMSO as vehicle control (Veh), VEGF 25 ng/mL, 1 (30 μM), and 1 (30 μM) + VEGF 25 ng/mL and kept in culture for 4 days. Endothelial cells were then visualized by immunofluorescence for Anti-von Willebrand. (B) Quantitation of coculture assays in A. The bar graph shows the mean ± SEM network branch points, area, and length. Data corresponds to the average of three independent experiments; *p < 0.05.
Reduced VEGF-Induced Angiogenesis after Treatment with 1
To further analyze the effect of blocking NRP1 during angiogenesis, we next used an ex vivo mouse aortic rings assay. The aortic ring assay provides a more complete picture of angiogenic processes compared with traditional cell-based assays. In this model, endothelial cells are able to proliferate and migrate, forming network tubes and branching points without the need for cellular dissociation.32 This allows us to assess different steps that occur during the angiogenic process, which we aim to target. Rings were embedded in collagen and kept in culture in medium containing 0.1% DMSO, 25 ng/mL VEGF-A, 1 (30 μM), or a combination of VEGF-A and 1. As expected, after 7 days in culture, VEGF-A increased vessel sprouting from WT aortic rings, but this response was significantly suppressed (≈7-fold reduction) by the administration of 30 μM of 1 (Figure 7A,B).
Figure 7.
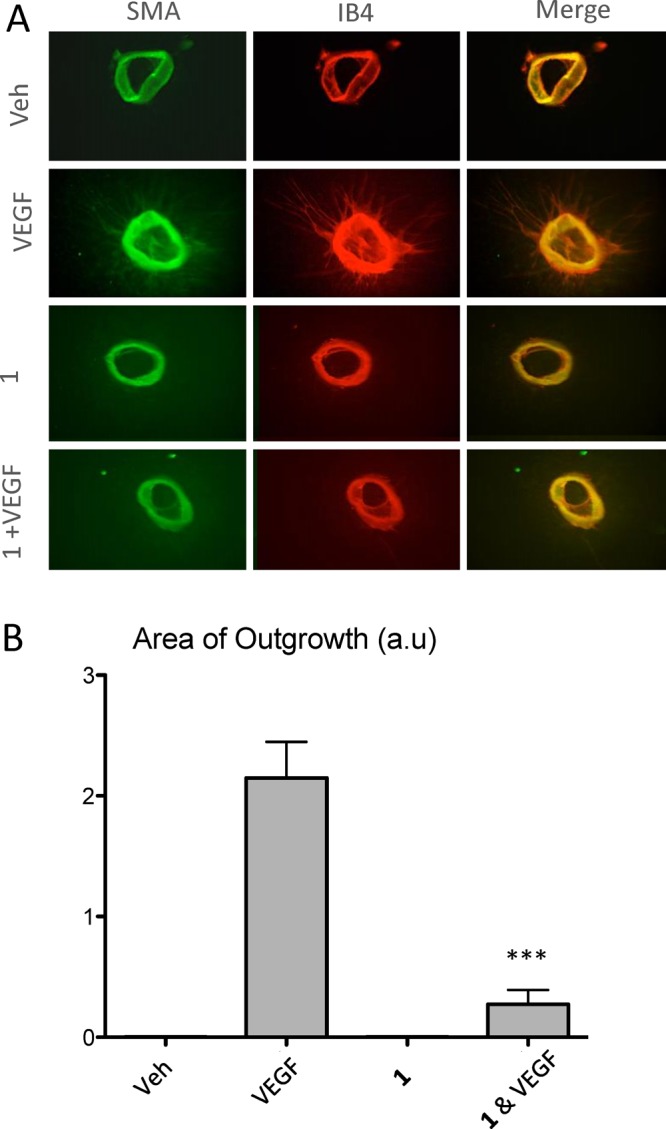
Compound 1 in combination with VEGFA reduces angiogenesis. (A) Representative pictures of mouse aortic rings stained with isolectin B4 (red) and SMA (green). Rings were treated with medium containing 0.1%DMSO as vehicle control (Veh), VEGF 25 ng/mL, 1 (30 μM), and 1 (30 μM) + VEGF 25 ng/mL. (B) Sprouts outgrowth area was quantified using imageJ. Data represent the average of three independent experiments ± SEM, ***P ≤ 0.001.
Studies have described that NRP1 up-regulation is associated with the tumor invasive behavior and metastatic potential, for instance, in melanoma and breast cancer.17,33 Thus, our data reinforces the importance of targeting NRP1 and suggest a possible attractive therapeutic approach for cancers that are so far resistance to the traditional angiogenic therapies.
Antitumor: Blocking NRP1 Reduces Melanoma Invasion in a 3D Spheroid Assay
To further investigate the effects of NRP1 blockade on cancer cells, we used a three-dimensional (3D) spheroid assay. 3D spheroids are a useful tool to replace the commonly used 2D cell culture systems. By using this system, we aimed to recapitulate how cells grow in vivo in three dimensions.
NRP1 expression is associated with melanoma progression and invasiveness. In addition, studies have shown that these properties can be inhibited by the use of anti NRP1 antibodies or shRNA constructs.34 Thus, we hypothesize that NRP1 is a potential target for the treatment of the metastatic melanoma. In our study, we have used A375P (malignant melanoma) cells that express NRP1 (data not shown).
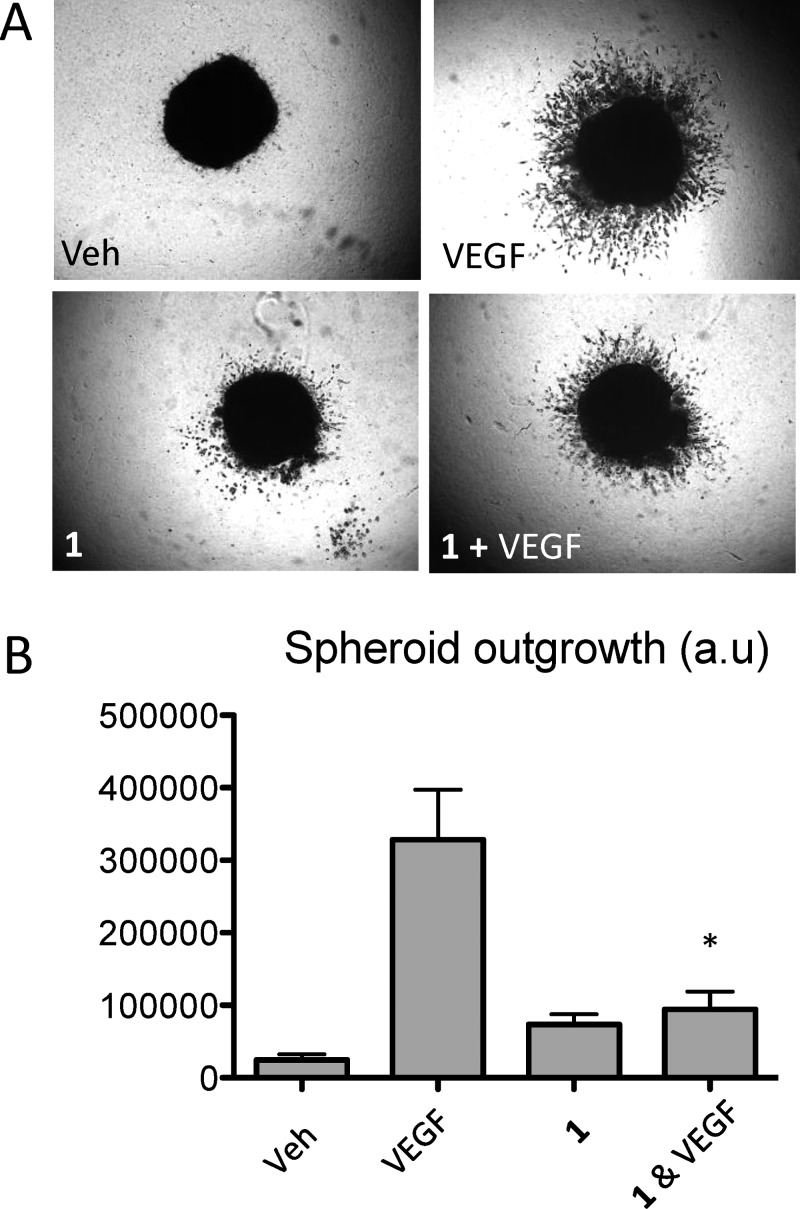
A375P spheroids were embedded in collagen and treated with medium supplemented with 0.1% DMSO, 25 ng/mL VEGF-A, 1 (30 μM), or a combination of VEGF-A and 1 (Figure 8A). Data collected shows that treatment with 1 in A375P cells significantly inhibited invasion induced by VEGF-A, whereas 1 treatment on its on its own had no significant effect on radial invasion compared to the DMSO control (Figure 8B). These results further establish an important role for blocking NRP1 in regulating VEGF-A mediated signaling, which are essential for cell motility and invasion in melanoma cells.
Figure 8.
Compound 1 in combination with VEGFA reduces A375P spheroid outgrowth. (A) A375P cells were resuspended and used to generate spheroids as described in Materials and Methods. Then 24 h after spheroid production, spheroids were imbedded in a collagen gel and incubated in medium containing 0.1% DMSO as a vehicle control (Veh), VEGF 25 ng/mL, 1 (30 μM), and 1 (30 μM) + VEGF 25 ng/mL for 7 days. (B) Spheroid outgrowth area was measured by quantifying the area corresponding to the invasion rim minus the area of the core for at least four different spheroids per condition. Data from at least three independent experiments ± SEM are presented as arbitrary units (a.u.) *p < 0.05.
Blocking NRP1 on Regulatory T Cells (Treg) with 1 Reduces Their Production of TGFβ in the Presence of Glioma-Conditioned Media (GCM)
Nrp1 is upregulated on the surface of Treg and is vital to their maintenance. Nrp1+ Treg populations have also been shown to induce allograft tolerance and limit potential antitumorigenic responses in murine models. Depletion of Nrp1+ Treg leads to enhancement of antitumoral immune responses, making them a favorable population of cells to target pharmacologically.6,35 To determine whether 1 had the potential to block the pro-tumorigenic polarization of Nrp1+ Treg, we isolated and purified Nrp1+, FoxP3+, and CD25+ populations of Treg from mice (Figure 9A) and exposed them to glioma conditioned media (GCM)12 for 12 h after pretreating the cells with 1. TGFβ is normally present in GCM36,37 and contributes to the immunosuppressive tumor microenvironment because interference with TGFβ expression has been shown to strongly promote recognition of glioma cells by cytotoxic T cells and NK cells.37 Treatment of the Nrp1+ Tregs with GCM alone activated the Tregs, which resulted in further increased TGFβ cytokine production, while pretreatment of the cells with 1 inhibited the GCM-induced production of TGFβ (Figure 9B).
Figure 9.

Compound 1 blocks the production of TGFβ by Nrp1+ Tregs in the presence of tumor cell-derived factors. (A) Primary T cells were isolated from the spleens of mice and purified for CD4 and CD304 (Nrp1) expression. The expression of these cell surface receptors as well as FOXP3 expression were verified by flow cytometry. (B) Nrp1+ Tregs were either exposed or not to 500 nM 1 for 2 h prior to incubation with glioma conditioned media (GCM). Production of TGFβ by the cells was assessed via ELISA after 12 h. The lanes correspond to media alone (Ctr), media with GCM (GCM alone), media with 1377 (1377), and then Nrp1+ Treg cells exposed to GCM (+GCM), or GCM + 1377 (1377 + GCM).
Conclusion
A focused set of novel NRP-1 antagonists were designed using structure-based drug design to allow targeting of specific residues located close to the binding pocket of arginine. X-ray crystallography was able to confirm that these interactions were being formed and enabled the design of further analogues.
Compounds were tested in several different assays to confirm binding to NRP1 and inhibition of NRP1–VEGF complex formation. Of these new inhibitors, compound 1 shows consistent biological activity and good stability in vivo. It exhibits submicromolar potency in inhibition of VEGF-A binding to NRP1 and good functional inhibition of VEGF driven angiogenesis, cell migration, tumor invasiveness, and notably Treg cell activation. The compound also demonstrates a sustained IV PK profile, making it an exciting new proof-of-concept molecule for the investigation of NRP-1 antagonists as anticancer therapies (Table 5).
Table 5. IV PK Data for Selected Compounds.
Experimental Section
Materials and Methods
Chemistry
All materials were obtained from commercial suppliers and used without further purification unless otherwise noted. Anhydrous solvents were either obtained from Aldrich or Fisher Scientific and used directly. All reactions involving air- or moisture-sensitive reagents were performed under a nitrogen atmosphere. Routine analytical thin layer chromatography was performed on precoated plates (Alugram, SILG/UV254). Reaction analyses and purity were determined by reverse-phase LC-MS using an analytical C18 column (Phenomenex Luna C18 (2) 50 mm × 4.6 mm, 5 μm for 4.5 and 13 min methods), using a diode array detector and an A:B gradient starting from 95% A:5% B at a flow rate of 2.25 mL/min or 1.5 mL/min, where eluent A was 0.1% formic acid/H2O and eluent B was 0.1% formic acid/MeOH or eluent A was 10 mM NH4HCO3 (aq) and eluent B was MeOH. Silica gel chromatography was performed with prepacked silica gel Biotage SNAP (KP-Sil) cartridges. Ion exchange chromatography was performed using Isolute Flash SCX-2 cartridges. Reverse-phase preparative HPLC was carried out on a Waters ZQ instrument using mass-directed purification on a preparative C18 column (Phenomenex Luna C18 (2), 100 mm × 21.2 mm, 5 μm). Depending upon the retention time and the degree of separation of the desired compound from any impurities, an A:B gradient was employed starting from high %A/low %B at a flow rate of 20 mL/min. The following combinations of A and B were typically used: A = H2O + 0.1% formic acid and B = MeOH + 0.1% formic acid, or A = 10 mM NH4HCO3 (aq) and B = methanol. 1H and 13C spectra were measured with Bruker NMR spectrometers as indicated. All observed protons are reported as parts per million (ppm) and are aligned to the residual solvent peak, e.g., for DMSO-d6 at δH 2.50 and δC 39.5 and for CDCl3 at δH 7.26. Data are reported as follows: chemical shift, multiplicity (s = singlet, d = doublet, t = triplet, br = broad, m = multiplet), coupling constants (J) recorded in Hz, and a number of protons. Low-resolution mass spectrometry data were determined on Waters ZQ4000 single quadrupole, Micromass Ultima triple quadruple mass spectrometers or Agilent 6100 single quadrupole/1200 series. High-resolution mass spectroetry was determined using an Orbitrap. All compounds tested (bioassays) were determined to be at least 95% pure by LC-MS unless otherwise stated.
Compound Synthesis and Characterization
(3-((5-(4-(Aminomethyl)phenyl)-2,3-dihydrobenzofuran)-7-sulfonamido)thiophene-2-carbonyl)-l-arginine (1)
The standard method for Suzuki coupling was used with (4-(aminomethyl)phenyl)boronic acid (1.5 equiv), 6 × 0.62 scale reactions. Combined reactions purified to give 14c as a white solid, 534 mg, 0.64 mmol, 35%. LC-MS Rt 2.29 min. MS m/z −839 [M + 1]+. Pbf protecting group was removed using the standard procedure to give a white solid, 164 mg, 0.55 mmol, 44%. HRMS (ES +ve): Calculated for C26H31N6O6S2 587.1746, Measured mass: 587.1745. 1H NMR (700 MHz, 19 mg in DMSO-d6,0.5 mL, plus 50 μL of D2O) δ 7.79 (s, 1H), 7.67 (s, 1H), 7.65–7.60 (m, 3H), 7.50 (d, J = 7.7 Hz, 2H), 7.18 (d, J = 5.5 Hz, 1H), 4.64 (t, J = 8.8 Hz, 2H), 4.34–4.29 (m, 1H), 4.04 (s, 2H), 3.30–3.19 (m, 2H), 3.10 (t, J = 7.1 Hz, 2H), 1.88–1.81 (m, 1H), 1.78–1.70 (m, 1H), 1.58–1.46 (m, 2H). 13C NMR (176 MHz, DMSO-d6 plus 50 μL of D2O) δ 172.93, 158.58, 158.38, 156.22, 141.03, 138.74, 132.75, 132.01, 131.98, 130.15, 129.61, 128.98, 126.56, 124.53, 119.95, 115.25, 113.27, 73.76, 51.90, 41.66, 40.12, 28.25, 27.13, 25.37.
3-(5-Bromo-2,3-dihydro-benzofuran-7-sulfonylamino)-thiophene-2-carboxylic Acid Methyl Ester (3)
To a stirred solution of 5-bromo-2,3-dihydro-benzofuran-7-sulfonyl chloride (1.25 equiv, 13.6 g, 47.6 mmol) in pyridine (anhydrous, 50 mL) under nitrogen (balloon), at 20 °C, was added dropwise over 2 h a solution of methyl-3-aminothiophene-2-carboxylate (1 equiv, 6 g, 38.1 mmol) in pyridine (anhydrous, 10 mL). The resulting suspension was stirred at 20 °C for 18 h, and after this time the reaction mixture was cooled (approx 0 °C) and water (50 mL) added dropwise. Precipitation occurred and the mixture was further diluted with water (100 mL) and the desired product collected by filtration, washed with ice-cold water (2 × 50 mL), and dried in vacuo to afford 3. Yield: 15.6 g, 37.4 mmol, 98%. Off-white solid. LC-MS: tR = 4.42 min. MS: m/z 416/418 [M – 1]−. HRMS: Calculated for C14H13BrNO5S2 417.9419. Measured mass: 417.9428. 1H NMR (600 MHz, DMSO-d6) δ 9.88 (s, 1H), 7.86 (d, J = 5.5 Hz, 1H), 7.71–7.67 (m, 1H), 7.63–7.59 (m, 1H), 7.22 (d, J = 5.5 Hz, 1H), 4.67 (t, J = 8.8 Hz, 2H), 3.82 (s, 3H), 3.27–3.20 (m, 2H). 13C NMR (151 MHz, DMSO-d6) δ 163.24, 155.98, 141.86, 134.12, 133.88, 133.53, 128.23, 121.05, 120.39, 111.30, 110.77, 74.21, 52.37, 28.31.
3-(5-Bromo-2,3-dihydro-benzofuran-7-sulfonylamino)-thiophene-2-carboxylic Acid (4)
The ester (3) (1 equiv, 15.6 g, 37.4 mmol) was stirred with lithium hydroxide monohydrate (5 equiv, 7.9 g, 187 mmol) in a tetrahydrofuran/methanol/water mixture (5:3:2; 40 mL) at 50 °C for 4 h. After this time, the organic solvents were removed in vacuo, and the residue diluted with water (50 mL) and then acidified to pH 1 with 6 M hydrochloric acid upon which precipitation occurred. The precipitate was washed with water (3 × 50 mL), collected by filtration, and dried in vacuo to give 4. Yield: 13 g, 32.2 mmol, 86%. Off-white solid. LC-MS: tR = 4.54 min. MS m/z 402/404 [M – 1]−. HRMS: Calculated for C13H11BrNO5S2 403.9262, Measured mass: 403.9246. 1H NMR (600 MHz, DMSO-d6) δ 10.11 (s, 1H), 7.79 (d, J = 5.5 Hz, 1H), 7.71–7.66 (m, 1H), 7.63–7.58 (m, 1H), 7.19 (d, J = 5.5 Hz, 1H), 4.67 (t, J = 8.8 Hz, 2H), 3.27–3.20 (m, 2H). 13C NMR (151 MHz, DMSO-d6) δ 164.75, 155.96, 141.69, 134.07, 133.51, 133.08, 128.24, 121.06, 119.85, 112.19, 110.77, 74.19, 28.32.
(S)-2-{[3-(5-Bromo-2,3-dihydro-benzofuran-7-sulfonylamino)-thiophene-2-carbonyl]-amino}-5-(2,2,4,6,7-pentamethyl-2,3-dihydro-benzofuran-5-sulfonyl-guanidino)-pentanoic Acid Methyl Ester (5)
The acid (4) (1 equiv, 13 g, 32.2 mmol) and bromo-tris-pyrrolidino-phosphonium hexafluorophosphate (PyBrOP; 1.1 equiv, 16.4 g, 35.4 mmol) were suspended in dichloromethane (100 mL) under nitrogen (balloon) and stirred at 20 °C for 10 min. N,N-Diisopropylethylamine (7 equiv, 39.2 mL, 225.4 mmol) was added to the mixture and stirred for a further 15 min. The protected amino acid H-l-arginine(Pbf)-OMe (hydrochloric acid salt; 1.1 equiv, 16.7 g, 35.4 mmol) was added as a single portion, and the reaction was then stirred for 18 h at 20 °C. After this time, the solvents were removed in vacuo and the resulting residue dissolved in EtOAc (200 mL) washed with 1 M hydrochloric acid (3 × 80 mL). The organic layer was washed with NaCl (aqueous satd solution, 80 mL), dried (Mg2SO4), and concentrated in vacuo. The residue was purified by flash column chromatography (silica; EtOAc in iso-hexane 50/50 to 0/100). The desired fractions were collected and concentrated in vacuo to give 5. Yield: 21 g, 25.5 mmol, 79%. Off-white solid. LC-MS tR = 4.77 min. MS m/z −826/828 [M + H]+. HRMS: Calculated for C33H41BrN5O9S3 826.1250. Measured Mass: 826.1279. 1H NMR (600 MHz, DMSO-d6) δ 11.02 (s, 1H), 8.64 (d, J = 7.3 Hz, 1H), 7.73 (d, J = 5.3 Hz, 1H), 7.65 (s, 1H), 7.57 (s, 1H), 7.16 (d, J = 5.4 Hz, 1H), 4.67–4.54 (m, 2H), 4.41–4.30 (m, 1H), 3.65 (s, 3H), 3.19 (s, 2H), 3.10–3.02 (m, 2H), 2.93 (s, 2H), 2.47 (s, 3H), 2.42 (s, 3H), 1.97 (s, 3H), 1.84–1.66 (m, 2H), 1.50–1.43 (m, 1H), 1.40 (m, 6H). 13C NMR (151 MHz, DMSO-d6) δ 172.08, 163.43, 157.48, 156.11, 155.98, 141.05, 137.27, 133.99, 133.31, 131.47, 130.56, 128.27, 124.35, 121.26, 120.02, 116.29, 113.47, 110.67, 86.33, 73.99, 52.20, 52.04, 42.48, 40.10, 30.42, 29.02, 27.54, 22.12, 13.97.
(S)-2-{[3-(5-Bromo-2,3-dihydro-benzofuran-7-sulfonylamino)-thiophene-2-carbonyl]-amino}-5-(2,2,4,6,7-pentamethyl-2,3-dihydro-benzofuran-5-sulfonyl-guanidino)-pentanoic Acid (6)
(S)-2-{[3-(5-Bromo-2,3-dihydro-benzofuran-7-sulfonylamino)-thiophene-2-carbonyl]-amino}-5-(2,2,4,6,7-pentamethyl-2,3-dihydro-benzofuran-5-sulfonyl-guanidino)-pentanoic acid methyl ester (1 eq, 2.45 g, 2.96 mmol) was stirred with 1 M lithium hydroxide (5 equiv, 14.82 mL mg, 14.82 mmol) in tetrahydrofuran (29 mL) at 20 °C for 3 h. After this time, the organic solvents were removed in vacuo and the (aqueous) residue diluted with water (30 mL) and then acidified to pH 1 with 6 M hydrochloric acid. Ethyl acetate (200 mL) was added to the resulting suspension and, after thorough mixing, the organic layer separated. The aqueous layer was further extracted with ethyl acetate (150 mL), and the organic extracts were combined, washed with brine (saturated aqueous solution; 3 × 75 mL), dried over magnesium sulfate, filtered, and the solvent removed in vacuo. The product (pale-yellow foam, 2.42 g, 100%) was used without further purification. LC-MS: Rt 4.89 min. MS m/z −812/814 [M + H]+. HRMS: Calculated for C32H39BrN5O9S3 812.1093. Measured mass: 812.1063. 1H NMR (700 MHz, DMSO-d6, plus 20 μL of D2O, 353.2 K) δ 7.52 (dd, J = 2.2, 0.8 Hz, 1H), 7.38 (dt, J = 2.2, 1.2 Hz, 1H), 7.29 (d, J = 5.4 Hz, 1H), 7.14 (d, J = 5.4 Hz, 1H), 4.54–4.45 (m, 2H), 4.26 (dd, J = 8.6, 4.8 Hz, 1H), 3.19–3.06 (m, 4H), 2.95 (s, 2H), 2.57 (s, 1H), 2.46–2.43 (m, 3H), 2.01 (s, 3H), 1.83–1.74 (m, 1H), 1.74–1.65 (m, 1H), 1.64–1.54 (m, 2H), 1.42 (s, 7H). 13C NMR (151 MHz, DMSO-d6, plus 20 μL D2O) δ 173.65, 163.18, 158.46, 158.25, 157.51, 156.18, 156.13, 155.49, 137.32, 131.53, 128.35, 124.42, 118.17, 116.36, 116.19, 114.22, 109.91, 86.38, 51.74, 42.44, 34.16, 28.38, 28.31, 28.18, 18.95, 17.62, 12.25.
General Procedure for Suzuki–Miyaura Couplings
(S)-2-{[3-(5-Bromo-2,3-dihydro-benzofuran-7-sulfonylamino)-thiophene-2-carbonyl]-amino}-5-(2,2,4,6,7-pentamethyl-2,3-dihydro-benzofuran-5-sulfonyl-guanidino)-pentanoic acid (approx 1 g, 1.23 mmol, 1.0 equiv), boronic acid (1.85 mmol, 1.5 equiv), and tetrakis(triphenylphosphine)palladium(0) (71 mg, 0.06 mmol, 0.05 equiv) were suspended in degassed 1,2-dimethoxyethane (3 mL). Potassium phosphate (4.92 mmol, tribasic, 2 M aqueous solution 2.46 mL, 4 equiv), also degassed, was further added and the reaction mixture heated using microwave conditions (100 W, 90 °C, ramp time = 10 min). After this time, the solvent was removed in vacuo and the resulting residue was partitioned between ethyl acetate (200 mL) and hydrochloric acid (1 M aqueous solution; 150 mL). The phases were separated and the aqueous phase further extracted with ethyl acetate (200 mL). The organic extracts were combined, washed with brine (saturated, aqueous solution; 2 × 100 mL), dried over magnesium sulfate, filtered, and the solvent removed in vacuo. The crude product (typically a yellow solid; approx 1.5 g) was purified by flash column chromatography on silica gel (eluent: dichloromethane increasing to dichloromethane/methanol; 75:25) to afford the desired product.
N2-(3-((5-(2-Formylphenyl)-2,3-dihydrobenzofuran)-7-sulfonamido)thiophene-2-carbonyl)-Nω-((2,2,4,6,7-pentamethyl-2,3-dihydrobenzofuran-5-yl)sulfonyl)-l-arginine (7a)
The general Suzuki method was used but with 2-formylphenylboronic acid (1.5 equiv). The product was isolated as a pale-yellow solid, 810 mg, 77% (LC-MS Rt 4.81 min. MS m/z −838 [M + H]+). HRMS: Calculated for C39H44BrN5O10S3 838.2247. Measured mass: 838.2250. 1H NMR (700 MHz, DMSO-d6, plus 80 μL D2O) δ 9.72 (s, 1H), 7.87 (d, J = 7.7 Hz, 1H), 7.73–7.68 (m, 1H), 7.65–7.61 (m, 1H), 7.63–7.49 (m, 3H), 7.43–7.34 (m, 2H), 7.15 (d, J = 5.4 Hz, 1H), 4.64 (t, J = 8.7 Hz, 2H), 4.28–4.22 (m, 1H), 3.20 (t, J = 8.9 Hz, 2H), 3.07–3.00 (m, 2H), 2.89 (s, 2H), 2.41 (s, 3H), 2.37 (s, 3H), 2.02 (s, 2H), 1.89 (s, 2H), 1.80–1.73 (m, 1H), 1.68 (m, 1H), 1.34 (s, 6H). 13C NMR (176 MHz, DMSO-d6) δ 191.41, 173.07, 163.36, 157.39, 156.53, 143.13, 141.22, 137.20, 133.95, 133.25, 131.86, 131.47, 131.39, 130.89, 130.08, 129.45, 128.75, 128.68, 128.12, 127.99, 127.88, 124.29, 120.00, 119.48, 116.22, 113.41, 86.26, 73.82, 52.09, 42.40, 28.25, 27.54, 18.90, 17.54, 12.16.
N2-(3-((5-(3-Formylphenyl)-2,3-dihydrobenzofuran)-7-sulfonamido)thiophene-2-carbonyl)-Nω-((2,2,4,6,7-pentamethyl-2,3-dihydrobenzofuran-5-yl)sulfonyl)-l-arginine (7b)
The general Suzuki method was used but with 3-formylphenylboronic acid (1.5 equiv). HRMS: Calculated for C39H44N5O10S3 838.2250. Measured mass: 838.225.5. 1H NMR (700 MHz, DMSO-d6) δ 11.06 (s, 1H), 10.08 (s, 1H), 8.48 (d, J = 7.6 Hz, 1H), 8.12 (t, J = 1.7 Hz, 1H), 7.94 (dt, J = 7.8, 1.3 Hz, 1H), 7.86 (dt, J = 3.9, 2.3 Hz, 2H), 7.77 (d, J = 1.9 Hz, 1H), 7.69–7.64 (m, 2H), 7.22 (d, J = 5.5 Hz, 1H), 4.67 (td, J = 8.8, 2.5 Hz, 2H), 4.32–4.26 (m, 1H), 3.24 (t, J = 8.8 Hz, 2H), 3.05 (hept, J = 6.7 Hz, 2H), 2.91 (s, 2H), 2.45 (s, 3H), 2.40 (s, 3H), 2.06 (s, 3H), 1.94 (s, 3H), 1.84–1.76 (m, 1H), 1.75–1.66 (m, 1H), 1.38 (s, 3H), 1.37 (s, 3H). 13C NMR (176 MHz, DMSO-d6) δ 193.18, 173.07, 163.39, 157.44, 156.51, 156.01, 141.26, 139.42, 137.25, 136.87, 134.00, 132.29, 132.07, 131.45, 131.34, 130.16, 129.92, 129.05, 128.70, 127.84, 127.76, 124.79, 124.32, 120.27, 119.99, 118.04, 86.28, 73.81, 52.10, 42.39, 28.28, 28.24, 20.73, 18.90, 17.54, 14.06, 12.17.
General Procedure for Reductive Amination
A solution of the aldehyde (1 equiv) in tetrahydrofuran/methanol (1:1, 1.5 mL) was added to the amine (commercially available; 1.1 equiv) followed by acetic acid (1–2 drops ∼ pH 6). The reaction was stirred at 20 °C for 2 h before sodium cyanoborohydride (2 equiv) in methanol (0.1 mL) was added in one portion. The reaction was stirred for a further 16 h at 20 °C. The reaction was filtered through a preconditioned SCX-2 (1 g) cartridge and the product eluted with 2 M ammonia in methanol. Solvent evaporation gave the product as a yellow oil, which was dissolved in dichloromethane/trifluoroacetic acid (1:1, 8 mL) and stirred at 20 °C for 1 h. The solvent was removed in vacuo and the crude residue dissolved in dimethyl sulfoxide and purified by (mass-directed) preparative LC-MS using a preparative C-18 column (Phenomenex Luna C18 (2), 100 mm × 21.2 mm, 5 μM) and a linear AB gradient of 5–95% for B over 12 min at a flow rate of 20 mL/min, where, (i) eluent A was 0.1% formic acid/water and eluent B was 0.1% formic acid/methanol or, (ii) eluent A was 10 mM ammonium bicarbonate (pH 9) and eluent B was 100% methanol. The purified compounds were isolated via solvent evaporation and carried through to Pbf removal.
General Procedure for Pbf Removal
The residue was dissolved in dichloromethane/trifluoroacetic acid (1:1, 5 mL) and stirred at room temperature for 1 h. The solvent was removed in vacuo and the crude residue dissolved in dimethyl sulfoxide and purified by (mass-directed) preparative LC-MS using a preparative C-18 column (Phenomenex Luna C18 (2), 100 mm × 21.2 mm, 5 μM) and a linear AB gradient of 5–95% for B over 12 min at a flow rate of 20 mL/min, where eluent A was 0.1% formic acid/water and eluent B was 0.1% formic acid/acetonitrile. The purified peptidomimetics were isolated via solvent evaporation.
(S)-2-({3-[5-(Phenyl)-2,3-dihydro-benzofuran-7-sulfonylamino]-thiophene-2-carbonyl}-amino)-5-guanidino(Pbf)-pentanoic Acid (9a)
The general Suzuki method was used but with phenylboronic acid 2.4 mmol scale reaction. Intermediate unsubstituted product 8, pale-yellow solid, 1.89 g, 2.3 mmol, 97%, Rt 3.31 min. MS m/z −812/814 [M + H]+. Standard Pbf removal 1 × 0.062 mmol scale reaction gave a white solid, 48 mg, 0.059 mmol, 96%. Rt 3.41 min. MS m/z −810 [M + H]+. HRMS (ES −ve): Calculated for C25H26N5O6S2 556.1324. Measured mass: 556.1315. 1H NMR (600 MHz, DMSO-d6) δ 10.06 (s, 1H), 7.69 (d, J = 2.0 Hz, 1H), 7.55 (d, J = 1.9 Hz, 1H), 7.53–7.49 (m, 2H), 7.42 (t, J = 7.7 Hz, 2H), 7.34–7.29 (m, 1H), 7.23 (d, J = 5.4 Hz, 1H), 7.17 (d, J = 5.4 Hz, 1H), 6.88 (bs, 2H), 4.73–4.44 (m, 2H), 4.22 (m, J = 6.8 Hz, 1H), 3.25–3.15 (m, 5H), 1.84 (m, 1H), 1.77–1.67 (m, 4H). 13C NMR (151 MHz, DMSO) δ 163.60, 157.38, 156.16, 150.47, 140.24, 135.19, 130.85, 129.44, 128.44, 127.29, 127.24, 126.64, 125.63, 125.31, 114.64, 72.40, 52.55, 29.08, 28.87, 25.60 [20C visible].
N2-(3-((5-(2-((((1H-Imidazol-2-yl)methyl)amino)methyl)phenyl)-2,3-dihydrobenzofuran)-7-sulfonamido)thiophene-2-carbonyl)-Nω-((2,2,4,6,7-pentamethyl-2,3-dihydrobenzofuran-5-yl)sulfonyl)-l-arginine (9b)
The standard reductive amination procedure was carried out with 7a and (1H-imidazol-4-yl)methanamine and then Pbf removal to give 9b as a white solid, 8.9 mg, 30%. Rt 4.48 min. MS m/z −667 [M + H]+. HRMS (ES +ve): Calculated for C30H34N8O6S2 666.2121. Measured mass: 667.2092. 1H NMR (600 MHz, DMSO-d6) δ 11.10 (s, 1H), 8.57 (d, J = 7.5 Hz, 1H), 7.82–7.77 (m, 1H), 7.70 (d, J = 5.5 Hz, 2H), 7.66–7.61 (m, 2H), 7.52–7.45 (m, 3H), 7.41 (d, J = 1.7 Hz, 1H), 7.23 (dd, J = 7.4, 1.7 Hz, 1H), 7.20 (d, J = 5.4 Hz, 1H), 4.70 (t, J = 8.8 Hz, 2H), 4.46–4.41 (m, 2H), 4.39–4.31 (m, 1H), 4.19 (s, 2H), 3.29–3.18 (m, 2H), 3.17–3.07 (m, 2H), 1.93–1.83 (m, 1H), 1.82–1.71 (m, 1H), 1.61–1.46 (m, 1H). 13C NMR (151 MHz, DMSO-d6) δ 173.15, 158.76, 158.73, 156.85, 156.11, 141.45, 140.49, 131.48, 131.42, 131.19, 130.55, 130.32, 129.74, 129.42, 129.02, 128.16, 127.40, 119.85, 119.71, 116.92, 114.98, 112.97, 73.70, 52.10, 47.71, 40.44, 40.32, 28.34, 27.33, 25.58.
N2-(3-((5-(2-((((1H-Pyrazol-3-yl)methyl)amino)methyl)phenyl)-2,3-dihydrobenzofuran)-7-sulfonamido)thiophene-2-carbonyl)-Nω-((2,2,4,6,7-pentamethyl-2,3-dihydrobenzofuran-5-yl)sulfonyl)-l-arginine (9c)
The standard reductive amination procedure was carried out with 7a and (1H-pyrazol-3-yl)methanamine) and then Pbf removal to give a white solid, 12.5 mg, 44%. Rt 4.44 min. MS m/z −667 [M + H]+. HRMS (ES +ve): Calculated for C30H35N8O6S2 667.2121. Measured mass: 667.2061. 1H NMR (600 MHz, DMSO-d6 plus 20 μL of D2O) δ 7.54 (d, J = 7.5 Hz, 1H), 7.48 (d, J = 2.0 Hz, 1H), 7.47 (d, J = 1.8 Hz, 1H), 7.35–7.31 (m, 2H), 7.31–7.27 (m, 1H), 7.23 (d, J = 5.4 Hz, 1H), 7.20 (s, 1H), 7.18 (d, J = 5.4 Hz, 1H), 7.11 (dd, J = 7.4, 1.5 Hz, 1H), 6.15 (d, J = 2.0 Hz, 1H), 4.64–4.53 (m, 3H), 4.21–4.15 (m, 1H), 3.20–3.12 (m, 5H), 1.83–1.74 (m, 1H), 1.72–1.58 (m, 4H). 13C NMR (151 MHz, DMSO-d6) δ 174.42, 163.18, 156.91, 155.28, 150.03, 140.91, 136.32, 131.57, 129.76, 129.39, 129.21, 127.58, 127.38, 127.34, 127.15, 127.06, 126.71, 122.86, 113.99, 103.63, 71.79, 52.12, 49.28, 44.58, 40.45, 28.62, 25.14.
N2-(3-((5-(2-((((1H-Pyrazol-4-yl)methyl)amino)methyl)phenyl)-2,3-dihydrobenzofuran)-7-sulfonamido)thiophene-2-carbonyl)-Nω-((2,2,4,6,7-pentamethyl-2,3-dihydrobenzofuran-5-yl)sulfonyl)-l-arginine (9d)
The standard reductive amination procedure was carried out with 7a and (1H-pyrazol-4-yl)methanamine) and then Pbf removal to give intermediate product 8, as a white solid, 8.6 mg, 30%. Rt 4.40 min. MS m/z −667 [M+ 1]+. HRMS (ES +ve): Calculated for C30H35N8O6S2 667.2121. Measured mass: 667.2081. 1H NMR (600 MHz, DMSO-d6) δ 10.01 (s, 1H), 7.58–7.48 (m, 5H), 7.35–7.27 (m, 2H), 7.24–7.18 (m, 3H), 7.13 (dd, J = 7.4, 1.5 Hz, 1H), 4.65–4.54 (m, 2H), 4.16 (d, J = 6.0 Hz, 1H), 3.71–3.60 (m, 4H), 3.20–3.11 (m, 4H), 1.81–1.74 (m, 1H), 1.70–1.54 (m, 3H). 13C NMR (151 MHz, DMSO-d6) δ 174.68, 163.09, 156.88, 155.31, 150.01, 141.11, 131.37, 129.84, 129.39, 129.30, 127.67, 127.52, 127.45, 127.30, 127.18, 126.48, 123.07, 114.10, 71.72, 52.38, 48.56, 42.05, 40.06, 29.07, 28.60, 25.20.
Nω-((2,2,4,6,7-Pentamethyl-2,3-dihydrobenzofuran-5-yl)sulfonyl)-N2-(3-((5-(2-(((pyridin-2-ylmethyl)amino)methyl)phenyl)-2,3-dihydrobenzofuran)-7-sulfonamido)thiophene-2-carbonyl)-l-arginine (9e)
The standard reductive amination procedure was carried out with 7a and pyridin-2-ylmethanamine and then Pbf removal to give a white solid, 6.3 mg, 21%. Rt 4.62 min. MS m/z −678 [M + H]+. HRMS (ES +ve): Calculated for C32H36N7O6S2 678.2169. Measured mass: 678.2175. 1H NMR (600 MHz, DMSO-d6) δ 11.11 (s, 1H), 9.39 (s, 1H), 8.59–8.53 (m, 1H), 8.42 (dt, J = 4.9, 1.4 Hz, 1H), 7.79 (td, J = 7.7, 1.8 Hz, 1H), 7.73 (dd, J = 7.7, 1.4 Hz, 1H), 7.68 (d, J = 5.5 Hz, 1H), 7.60–7.50 (m, 2H), 7.48 (td, J = 7.5, 1.4 Hz, 1H), 7.42–7.33 (m, 3H), 7.32 (d, J = 7.9 Hz, 1H), 7.26–7.16 (m, 2H), 4.74–4.63 (m, 2H), 4.39–4.32 (m, 1H), 4.18 (s, 2H), 4.16 (d, J = 4.2 Hz, 2H), 3.23–3.08 (m, 3H), 1.92–1.83 (m, 1H), 1.81–1.70 (m, 1H), 1.57–1.49 (m, 2H).
(3-((5-(3-(Morpholinomethyl)phenyl)-2,3-dihydrobenzofuran)-7-sulfonamido)thiophene-2-carbonyl)-l-arginine (10a)
The standard reductive amination procedure was carried out with 7b on a 0.1 mmol scale with morpholine (22 mg, 0.25 mmol) and then Pbf removal to give 10a as an off-white solid, 38 mg, 0.058 mmol, 58%. LC-MS(b) Rt 2.68 min. MS m/z −657 [M + H]+. HRMS: ES (−) Calculated for C30H35N6O7S2 655.2009. Measured mass: 655.2022. 1H NMR (700 MHz, DMSO-d6, plus 50 μL D2O) δ 7.82–7.78 (m, 1H), 7.77–7.74 (m, 1H), 7.74–7.72 (m, 1H), 7.70–7.66 (m, 1H), 7.64 (d, J = 5.5 Hz, 1H), 7.53 (td, J = 7.7, 3.5 Hz, 1H), 7.45 (dd, J = 15.8, 7.6 Hz, 1H), 7.17 (d, J = 5.4 Hz, 1H), 4.66 (t, J = 8.8 Hz, 2H), 4.39 (s, 1H), 4.36–4.29 (m, 2H), 3.98–3.94 (m, 1H), 3.63 (t, J = 12.7 Hz, 1H), 3.31–3.19 (m, 3H), 3.18–3.13 (m, 1H), 3.10 (t, J = 7.2 Hz, 2H), 2.75 (s, 2H), 1.86 (ddt, J = 13.7, 10.7, 5.5 Hz, 1H), 1.79–1.70 (m, 1H), 1.60–1.46 (m, 2H). 13C NMR (151 MHz, DMSO-d6) δ 173.14, 159.12, 158.89, 158.66, 141.32, 139.14, 131.98, 131.95, 131.31, 130.30, 130.11, 129.88, 129.64, 129.62, 119.88, 119.07, 117.12, 115.18, 113.24, 73.82, 63.28, 59.16, 52.12, 50.89, 41.83, 28.30, 27.33, 25.57.
N2-(3-((5-(3-((((1H-Imidazol-2-yl)methyl)amino)methyl)phenyl)-2,3-dihydrobenzofuran)-7-sulfonamido)thiophene-2-carbonyl)-Nω-((2,2,4,6,7-pentamethyl-2,3-dihydrobenzofuran-5-yl)sulfonyl)-l-arginine (10b)
The standard reductive amination procedure was carried out with 7b and (1H-imidazol-4-yl)methanamine and then Pbf removal to give a white solid, 9.6 mg, 32%. Rt 4.30 min. MS m/z 667 [M + H]+. HRMS (ES +ve): Calculated for C30H35N8O6S2 667.2121. Measured mass: 667.2071. 1H NMR (600 MHz, DMSO-d6) δ 11.10 (s, 1H), 8.56 (d, J = 7.6 Hz, 1H), 7.82 (q, J = 1.4 Hz, 1H), 7.81–7.75 (m, 2H), 7.71 (t, J = 5.7 Hz, 1H), 7.69–7.65 (m, 2H), 7.62 (s, 2H), 7.52 (t, J = 7.7 Hz, 1H), 7.50–7.44 (m, 1H), 7.18 (d, J = 5.5 Hz, 1H), 4.69 (t, J = 8.8 Hz, 2H), 4.37–4.32 (m, 3H), 3.33–3.20 (m, 2H), 3.17–3.07 (m, 2H), 1.93–1.83 (m, 1H), 1.81–1.70 (m, 1H), 1.62–1.46 (m, 2H). 13C NMR (151 MHz, DMSO-d6) δ 173.15, 163.49, 159.06, 158.84, 158.61, 141.34, 138.96, 132.09, 131.97, 130.33, 129.53, 129.07, 128.94, 128.18, 127.08, 124.62, 120.30, 119.75, 119.14, 117.19, 115.25, 113.30, 73.82, 52.07, 50.47, 40.59, 40.32, 28.31, 27.33, 25.57.
N2-(3-((5-(3-((((1H-Pyrazol-3-yl)methyl)amino)methyl)phenyl)-2,3-dihydrobenzofuran)-7-sulfonamido)thiophene-2-carbonyl)-Nω-((2,2,4,6,7-pentamethyl-2,3-dihydrobenzofuran-5-yl)sulfonyl)-l-arginine (10c)
The standard reductive amination procedure was carried out with 7b and (1H-pyrazol-3-yl)methanamine) and then Pbf removal to give a white solid, 13.1 mg, 48%. Rt 4.46 min. MS m/z −667 [M+ 1]+. HRMS (ES +ve): Calculated for C30H35N8O6S2 667.2121. Measured mass: 667.2056. 1H NMR (400 MHz, DMSO-d6) δ 11.08 (s, 1H), 9.45–9.39 (m, 2H), 8.53 (d, J = 7.6 Hz, 1H), 7.84–7.82 (m, 1H), 7.81 (d, J = 2.2 Hz, 1H), 7.80–7.77 (m, 2H), 7.68–7.62 (m, 2H), 7.51 (t, J = 7.6 Hz, 1H), 7.46 (dt, J = 7.6, 1.5 Hz, 1H), 7.18 (d, J = 5.4 Hz, 1H), 6.43 (d, J = 2.3 Hz, 1H), 4.68 (t, J = 8.8 Hz, 2H), 4.41–4.31 (m, 1H), 4.26 (t, J = 5.6 Hz, 2H), 4.20 (t, J = 5.5 Hz, 2H), 3.35–3.20 (m, 2H), 3.12 (q, J = 6.8 Hz, 2H), 1.94–1.80 (m, 1H), 1.83–1.68 (m, 1H), 1.63–1.43 (m, 2H). 13C NMR (151 MHz, DMSO-d6) δ 173.14, 163.49, 156.76, 156.29, 142.42, 141.34, 138.86, 132.61, 132.13, 131.98, 130.34, 129.45, 129.20, 128.97, 128.30, 126.94, 124.63, 120.27, 119.76, 105.14, 73.82, 52.06, 49.77, 43.38, 40.32, 28.33, 27.33, 25.57.
N2-(3-((5-(3-((((1H-Pyrazol-4-yl)methyl)amino)methyl)phenyl)-2,3-dihydrobenzofuran)-7-sulfonamido)thiophene-2-carbonyl)-Nω-((2,2,4,6,7-pentamethyl-2,3-dihydrobenzofuran-5-yl)sulfonyl)-l-arginine (10d)
The standard reductive amination procedure was carried out with 7b and (1H-pyrazol-4-yl)methanamine) and then Pbf removal to give an off-white solid, 11.2 mg, 40%. Rt 4.38 min. MS m/z −667 [M + H]+. HRMS (ES +ve): Calculated for C30H35N8O6S2 667.2121. Measured mass: 667.2069. 1H NMR (600 MHz, DMSO-d6) δ 12.44 (bs, 1H), 9.98 (d, J = 8.4 Hz, 1H), 7.82–7.77 (m, 2H), 7.76–7.70 (m, 1H), 7.67 (s, 2H), 7.50 (dd, J = 10.0, 1.8 Hz, 2H), 7.36 (t, J = 7.7 Hz, 1H), 7.28 (d, J = 5.4 Hz, 1H), 7.22 (d, J = 7.7 Hz, 1H), 7.18 (d, J = 5.4 Hz, 1H), 6.94 (s, 2H), 4.64–4.50 (m, 2H), 4.31–4.23 (m, 1H), 4.03–3.94 (m, 2H), 3.97–3.89 (m, 2H), 3.22–3.13 (m, 2H), 1.84–1.76 (m, 1H), 1.73–1.51 (m, 3H). 13C NMR (151 MHz, DMSO) δ 176.18, 162.97, 156.85, 155.96, 150.07, 139.89, 135.60, 131.38, 130.33, 128.89, 128.76, 128.22, 127.67, 127.40, 126.80, 126.28, 125.61, 125.56, 124.71, 123.23, 114.61, 113.21, 71.73, 53.10, 49.66, 40.46, 40.42, 29.75, 28.63, 25.50.
Nω-((2,2,4,6,7-Pentamethyl-2,3-dihydrobenzofuran-5-yl)sulfonyl)-N2-(3-((5-(3-(((pyridin-2-ylmethyl)amino)methyl)phenyl)-2,3-dihydrobenzofuran)-7-sulfonamido)thiophene-2-carbonyl)-l-arginine (10e)
The standard reductive amination procedure was carried out with 7b and pyridin-2-ylmethanamine and then Pbf removal to give a white solid, 8.8 mg, 31%. Rt 4.72 min. MS m/z −678 [M + H]+. HRMS (ES +ve): Calculated for C32H36N7O6S2 678.2169. Measured mass: 678.2166. 1H NMR (600 MHz, DMSO-d6, plus 20 μL of D2O) δ 8.65 (ddd, J = 4.9, 1.8, 0.9 Hz, 1H), 7.88 (td, J = 7.7, 1.8 Hz, 1H), 7.81 (dt, J = 11.6, 1.6 Hz, 2H), 7.79–7.75 (m, 1H), 7.70–7.63 (m, 2H), 7.55–7.45 (m, 3H), 7.49–7.41 (m, 1H), 7.18 (d, J = 5.5 Hz, 1H), 4.67 (t, J = 9.0 Hz, 2H), 4.39–4.27 (m, 5H), 3.32–3.22 (m, 2H), 3.11 (t, J = 7.1 Hz, 2H), 1.92–1.82 (m, 1H), 1.80–1.69 (m, 1H), 1.60–1.46 (m, 2H). 13C NMR (151 MHz, DMSO-d6) δ 173.14, 163.48, 158.59, 158.37, 158.15, 151.94, 149.09, 141.33, 138.85, 137.47, 132.56, 132.14, 131.98, 130.35, 129.46, 129.25, 128.97, 128.36, 126.97, 124.61, 123.76, 123.39, 120.28, 119.76, 73.82, 52.07, 50.11, 49.88, 40.32, 28.34, 27.34, 25.57.
(S)-5-Guanidino(Pbf)-2-({3-[5-(2-piperidin-1-ylmethyl-phenyl)-2,3-dihydro-benzofuran-7-sulfonylamino]-thiophene-2-carbonyl}amino)-pentanoic Acid (11a)
The standard reductive amination procedure was carried out with 7a and piperidine and then Pbf removal to give a white solid, 3 mg, 23%. Rt 4.61 min. MS m/z −655 [M + H]+. HRMS (ES +ve): Calculated for C31H39N6O6S2 655.2372. Measured mass: 655.2372. 1H NMR (600 MHz, DMSO-d6) δ 11.11 (s, 1H), 9.23 (s, 1H), 8.56 (d, J = 7.6 Hz, 1H), 7.76–7.68 (m, 2H), 7.68–7.62 (m, 1H), 7.57–7.50 (m, 2H), 7.48 (d, J = 1.7 Hz, 1H), 7.43 (d, J = 1.8 Hz, 1H), 7.27 (dd, J = 6.9, 2.0 Hz, 1H), 7.20 (d, J = 5.4 Hz, 1H), 4.76–4.66 (m, 2H), 4.38–4.31 (m, 1H), 4.27–4.17 (m, 2H), 3.36–3.21 (m, 2H), 3.17–3.06 (m, 4H), 1.92–1.83 (m, 1H), 1.81–1.70 (m, 1H), 1.67–1.47 (m, 7H), 1.27–1.19 (m, 1H). 13C NMR (151 MHz, DMSO-d6) δ 173.15, 163.54, 158.33, 158.11, 156.72, 156.17, 141.83, 131.68, 131.55, 131.19, 130.90, 130.35, 129.59, 127.64, 127.37, 119.78, 112.95, 73.73, 56.22, 52.04, 40.05, 28.40, 27.34, 25.58, 22.27, 21.00.
(S)-2-[(3-{5-[2-(4-Carbamoyl-piperidin-1-ylmethyl)-phenyl]-2,3-dihydro-benzofuran-7-sulfonylamino}-thiophene-2-carbonyl)-amino]-5-guanidino-pentanoic Acid (11b)
The standard reductive amination procedure was carried out with 7a and piperidine-4-carboxamide and then Pbf removal to give a white solid, 4 mg, 32%. Rt 4.43 min. MS m/z −698 [M + H]+. HRMS (ES +ve): Calculated for C32H40N7O7S2 698.2430. Measured mass: 698.2401. 1H NMR (600 MHz, DMSO-d6, plus 50 μL of D2O) δ 7.72–7.65 (m, 2H), 7.55–7.48 (m, 2H), 7.44 (s, 1H), 7.38 (d, J = 1.7 Hz, 1H), 7.26–7.21 (m, 1H), 7.17 (d, J = 5.4 Hz, 1H), 4.73–4.62 (m, 2H), 4.32 (dd, J = 10.0, 5.0 Hz, 1H), 4.25–4.15 (m, 2H), 3.32–3.16 (m, 4H), 3.10 (t, J = 7.1 Hz, 2H), 2.65–2.56 (m, 2H), 2.23 (tt, J = 11.5, 3.8 Hz, 1H), 1.91–1.82 (m, 1H), 1.85–1.63 (m, 5H), 1.60–1.45 (m, 2H). 13C NMR (151 MHz, DMSO-d6, plus 50 μL of D2O) δ 174.94, 173.00, 163.39, 158.74, 158.53, 158.31, 141.74, 141.10, 131.70, 131.61, 131.22, 130.92, 130.23, 129.80, 128.45, 127.25, 127.17, 120.02, 119.62, 117.85, 73.77, 56.51, 51.96, 51.18, 40.19, 28.33, 27.19, 25.42.
(S)-5-Guanidino-2-[(3-{5-[2-(4-methylcarbamoyl-piperidin-1-ylmethyl)-phenyl]-2,3-dihydro-benzofuran-7-sulfonylamino}thiophene-2-carbonyl)-amino]-pentanoic Acid (11c)
The standard reductive amination procedure was carried out with 7a and N-methylpiperidine-4-carboxamide and then Pbf removal to give a white solid, 9.8 mg, 29%. Rt 4.51 min. MS m/z −712 [M + H]+. HRMS (ES +ve): Calculated for C33H42N7O7S2 712.2587. Measured mass: 712.2426. 1H NMR (600 MHz, DMSO-d6, plus 50 μL of D2O) δ 7.74–7.67 (m, 2H), 7.56–7.48 (m, 2H), 7.45 (s, 1H), 7.40 (d, J = 1.7 Hz, 1H), 7.27–7.22 (m, 1H), 7.18 (d, J = 5.4 Hz, 1H), 4.69 (td, J = 8.7, 2.3 Hz, 2H), 4.34 (dd, J = 9.9, 5.0 Hz, 1H), 4.27–4.18 (m, 2H), 3.30–3.17 (m, 4H), 3.11 (t, J = 7.1 Hz, 2H), 2.69–2.61 (m, 1H), 2.54 (s, 3H), 2.22 (td, J = 11.2, 5.7 Hz, 1H), 1.92–1.82 (m, 1H), 1.81–1.67 (m, 6H), 1.61–1.46 (m, 2H). 13C NMR (151 MHz, DMSO-d6) δ 172.98, 158.50, 158.29, 156.45, 156.18, 141.78, 131.73, 131.64, 131.57, 131.15, 130.91, 130.26, 129.66, 128.38, 127.31, 119.95, 119.75, 118.03, 116.05, 113.20, 73.73, 56.47, 51.94, 51.06, 28.38, 27.27, 25.62, 25.49, 25.42.
(S)-5-Guanidino-2-[(3-{5-[2-(4-morpholin-4-yl-piperidin-1-ylmethyl)-phenyl]-2,3-dihydro-benzofuran-7-sulfonylamino}thiophene-2-carbonyl)-amino]-pentanoic Acid (11d)
The standard reductive amination procedure was carried out with 7a and 4-(piperidin-4-yl)morpholine and then then Pbf removal to give a white solid, 5.8 mg, 18%. Rt 3.84 min. MS m/z −640 [M + H]+). HRMS (ES −ve): Calculated for C35H46N7O7S2 738.2749. Measured mass: 738.2744. 1H NMR (700 MHz, DMSO-d6, plus 25 μL of D2O at 80 °C) δ 7.71–7.65 (m, 2H), 7.53–7.49 (m, 2H), 7.48–7.43 (m, 2H), 7.28–7.23 (m, 1H), 7.18 (d, J = 5.4 Hz, 1H), 4.70 (td, J = 8.6, 1.5 Hz, 2H), 4.38 (dd, J = 9.4, 5.2 Hz, 1H), 4.10–4.06 (m, 2H), 3.84 (s, 4H), 3.31–3.24 (m, 2H), 3.15 (t, J = 7.2 Hz, 6H), 2.16–2.10 (m, 2H), 1.95–1.87 (m, 1H), 1.85–1.76 (m, 2H), 1.64–1.52 (m, 2H), 1.32–1.26 (m, 2H). 13C NMR (151 MHz, DMSO-d6) δ 173.14, 163.55, 158.71, 158.49, 158.26, 156.15, 141.45, 131.78, 131.42, 130.94, 130.40, 127.45, 119.82, 119.24, 118.16, 117.28, 115.33, 113.38, 112.94, 73.71, 63.48, 63.33, 53.56, 52.08, 48.52, 42.85, 41.83, 28.41, 27.33, 25.58.
Cyanomethyl-piperidin-1-ylmethyl)-phenyl]-2,3-dihydro-benzofuran-7-sulfonylamino}-thiophene-2-carbonyl)-amino]-5-guanidino-pentanoic Acid (11e)
The standard reductive amination procedure was carried out with 7a and 2-(piperidin-4-yl)acetonitrile and then then Pbf removal to give a white solid, 7.3 mg, 23%. Rt 4.52 min. MS m/z −694.5 [M + H]+. HRMS (ES +ve): Calculated for C33H40N7O6S2 694.2482. Measured mass: 694.2451. 1H NMR (600 MHz, DMSO-d6, plus 20 μL of D2O) δ 7.74–7.67 (m, 3H), 7.56–7.49 (m, 3H), 7.48–7.44 (m, 1H), 7.45–7.40 (m, 1H), 7.26 (dd, J = 6.6, 2.3 Hz, 1H), 7.19 (d, J = 5.5 Hz, 1H), 4.75–4.64 (m, 3H), 4.33 (dd, J = 10.0, 5.0 Hz, 1H), 4.21 (s, 2H), 3.26 (q, J = 7.9 Hz, 2H), 3.24–3.18 (m, 3H), 3.11 (t, J = 7.1 Hz, 3H), 2.69–2.57 (m, 2H), 2.54 (d, J = 5.3 Hz, 2H), 1.91–1.83 (m, 1H), 1.80–1.69 (m, 3H), 1.61–1.49 (m, 2H), 1.48–1.39 (m, 2H).
(S)-5-Guanidino-2-({3-[5-(3-piperidin-1-ylmethyl-phenyl)-2,3-dihydro-benzofuran-7-sulfonylamino]-thiophene-2-carbonyl}-amino)-pentanoic Acid (12a)
The standard reductive amination procedure was carried out with 7b and piperidine and then Pbf removal to give a white solid, 8.6 mg, 55%. Rt 4.59 min. MS m/z −655 [M + H]+. HRMS (ES +ve): Calculated for C35H46N7O7S2 698.2430. Measured mass: 698.2407. 1H NMR (600 MHz, DMSO-d6) δ 11.10 (s, 1H), 9.48 (s, 1H), 8.56 (d, J = 7.5 Hz, 1H), 7.84 (d, J = 1.8 Hz, 1H), 7.78 (q, J = 1.8 Hz, 2H), 7.72 (dt, J = 8.1, 1.2 Hz, 1H), 7.67 (d, J = 5.5 Hz, 1H), 7.61 (t, J = 5.7 Hz, 1H), 7.55 (t, J = 7.7 Hz, 1H), 7.47 (dt, J = 7.6, 1.3 Hz, 1H), 7.18 (d, J = 5.5 Hz, 1H), 4.69 (td, J = 8.6, 1.7 Hz, 2H), 4.39–4.31 (m, 3H), 3.35 (d, J = 11.7 Hz, 2H), 3.31–3.22 (m, 2H), 3.15–3.08 (m, 2H), 2.96–2.86 (m, 2H), 1.92–1.80 (m, 3H), 1.79–1.73 (m, 1H), 1.73–1.67 (m, 1H), 1.66–1.58 (m, 2H), 1.57–1.49 (m, 1H), 1.42–1.32 (m, 1H). 13C NMR (151 MHz, DMSO-d6) δ 173.15, 163.48, 158.06, 157.85, 156.70, 156.35, 139.09, 132.00, 131.95, 130.62, 130.30, 129.62, 129.35, 127.51, 124.62, 119.82, 113.14, 73.84, 58.99, 52.04, 51.92, 36.53, 28.33, 27.35, 25.56, 22.56, 21.35.
(S)-2-[(3-{5-[3-(4-Carbamoyl-piperidin-1-ylmethyl)-phenyl]-2,3-dihydro-benzofuran-7-sulfonylamino}-thiophene-2-carbonyl)-amino]-5-guanidino-pentanoic Acid (12b)
The standard reductive amination procedure was carried out with 7b and piperidine-4-carboxamide and then Pbf removal to give a white solid, 8 mg, 57%. Rt 4.37 min. MS m/z −698 [M + H]+. HRMS (ES +ve): Calculated for C32H40N7O7S2 698.2430. Measured mass: 698.2437. 1H NMR (600 MHz, DMSO-d6 plus 50 μL of D2O) δ 7.81 (d, J = 1.8 Hz, 1H), 7.74 (d, J = 2.1 Hz, 2H), 7.70–7.67 (m, 1H), 7.64 (d, J = 5.4 Hz, 1H), 7.56–7.51 (m, 1H), 7.45 (d, J = 7.7 Hz, 1H), 7.18 (d, J = 5.5 Hz, 1H), 4.69–4.64 (m, 2H), 4.34–4.29 (m, 3H), 3.40 (d, J = 11.8 Hz, 2H), 3.34–3.19 (m, 4H), 3.10 (t, J = 7.1 Hz, 2H), 3.00–2.91 (m, 2H), 2.42–2.33 (m, 1H), 1.92 (d, J = 12.5 Hz, 2H), 1.89–1.81 (m, 1H), 1.78–1.69 (m, 4H), 1.58–1.47 (m, 1H). 13C NMR (151 MHz, DMSO-d6) δ 174.89, 174.76, 173.14, 163.49, 158.71, 158.49, 141.33, 139.07, 132.00, 131.95, 130.58, 130.35, 130.29, 129.62, 129.34, 129.03, 127.52, 124.60, 120.33, 119.84, 73.84, 59.12, 52.07, 51.03, 48.80, 40.32, 27.34, 25.73, 25.57, 23.57.
(S)-5-Guanidino-2-[(3-{5-[3-(4-methylcarbamoyl-piperidin-1-ylmethyl)-phenyl]-2,3-dihydro-benzofuran-7-sulfonylamino}thiophene-2-carbonyl)-amino]-pentanoic Acid (12c)
The standard reductive amination procedure was carried out with 7a and N-methylpiperidine-4-carboxamide and then Pbf removal to give a white solid, 9.0 mg, 27%. Rt 4.50 min. MS m/z −712 [M + 1]+. HRMS (ES +ve): Calculated for C33H43N7O7S2 712.2587. Measured mass: 712.2591. 1H NMR (600 MHz, DMSO-d6, plus 50 μL of D2O) δ 7.68 (d, J = 1.9 Hz, 1H), 7.54 (d, J = 1.9 Hz, 1H), 7.49–7.45 (m, 1H), 7.43–7.40 (m, 1H), 7.37 (t, J = 7.6 Hz, 1H), 7.26 (d, J = 5.4 Hz, 1H), 7.22 (dt, J = 7.6, 1.4 Hz, 1H), 7.18 (d, J = 5.4 Hz, 1H), 4.65–4.54 (m, 2H), 4.26–4.20 (m, 1H), 3.55 (s, 2H), 3.25–3.18 (m, 4H), 2.90–2.83 (m, 2H), 2.54 (d, J = 4.6 Hz, 3H), 2.07 (dt, J = 15.8, 5.5 Hz, 1H), 2.03–1.96 (m, 2H), 1.87–1.78 (m, 1H), 1.71 (qt, J = 10.1, 4.8 Hz, 3H), 1.65–1.54 (m, 4H).
(S)-5-Guanidino-2-[(3-{5-[3-(4-morpholin-4-yl-piperidin-1-ylmethyl)-phenyl]-2,3-dihydro-benzofuran-7-sulfonylamino-thiophene-2-carbonyl)-amino]-pentanoic Acid (12d)
The standard reductive amination procedure was carried out with 7b and 4-(piperidin-4-yl)morpholine and then then Pbf removal to give a white solid, 9.5 mg, 29%. Rt 3.72 min. MS m/z −740 [M + H]+. HRMS (ES +ve): Calculated for C35H46N7O7S2 740.2900. Measured mass: 740.2964. 1H NMR (600 MHz, DMSO-d6, plus 50 μL of D2O) δ 7.81 (s, 1H), 7.75 (d, J = 2.0 Hz, 2H), 7.73–7.68 (m, 1H), 7.64 (d, J = 5.4 Hz, 1H), 7.55 (t, J = 7.7 Hz, 1H), 7.47 (d, J = 7.6 Hz, 1H), 7.18 (d, J = 5.4 Hz, 1H), 4.67 (t, J = 9.0 Hz, 2H), 4.37 (s, 2H), 4.32 (dd, J = 10.1, 4.9 Hz, 1H), 4.00 (s, 3H), 3.56 (d, J = 12.2 Hz, 3H), 3.46–3.42 (m, 4H), 3.32–3.19 (m, 2H), 3.11 (t, J = 7.1 Hz, 3H), 3.03 (t, J = 13.5 Hz, 3H), 2.35–2.25 (m, 2H), 1.92–1.81 (m, 3H), 1.80–1.69 (m, 1H), 1.60–1.46 (m, 2H). 13C NMR (151 MHz, DMSO-d6) δ 173.03, 163.40, 158.76, 158.54, 156.44, 141.09, 139.18, 132.04, 131.95, 130.29, 130.07, 129.77, 129.37, 129.12, 127.76, 124.63, 120.11, 119.86, 115.45, 73.88, 63.42, 59.60, 58.80, 51.98, 49.71, 48.61, 40.16, 28.26, 27.16, 25.46, 23.46.
Cyanomethyl-piperidin-1-ylmethyl)-phenyl]-2,3-dihydro-benzofuran-7-sulfonylamino}-thiophene-2-carbonyl)-amino]-5-guanidino-pentanoic Acid (12e)
The standard reductive amination procedure was carried out with 7b and 2-(piperidin-4-yl)acetonitrile and then then Pbf removal to give a white solid, 6.4 mg, 19%. Rt 4.46 min. MS m/z −694.5 [M+ 1]+. HRMS (ES +ve): Calculated for C33H40N7O6S2 694.2482. Measured mass 694.2455. 1H NMR (600 MHz, DMSO-d6) δ 10.06–10.01 (m, 1H), 8.27 (s, 1H), 7.69 (s, 1H), 7.64 (s, 1H), 7.53 (s, 1H), 7.46–7.33 (m, 3H), 7.28–7.08 (m, 3H), 4.60 (h, J = 8.9 Hz, 2H), 4.22 (s, 1H), 3.19 (t, J = 6.4 Hz, 3H), 2.85 (d, J = 11.1 Hz, 2H), 2.54 (s, 1H), 1.98 (m, 1H), 1.75–1.64 (m, 2H).
(3-((5-(3-((Dimethylamino)methyl)phenyl)-2,3-dihydrobenzofuran)-7-sulfonamido)thiophene-2-carbonyl)-l-arginine (13a)
Using the standard method for reductive amination 1 × 0.12 mmol scale reaction, the crude intermediate product was treated using the standard conditions for Pbf removal. White solid, 21 mg, 0.025 mmol, 21% over 2 steps. LC-MS (pH 2): Rt 4.29 min. MS m/z −615 [M + H]+. HRMS (ES +ve): Calculated for C28H33N6O6S2 613.1903. Measured mass: 613.1912. 1H NMR (600 MHz, DMSO-d6) δ 10.08 (d, J = 7.6 Hz, 1H), 7.73 (d, J = 2.0 Hz, 1H), 7.60 (s, 1H), 7.54 (d, J = 1.9 Hz, 1H), 7.52–7.45 (m, 2H), 7.40 (t, J = 7.6 Hz, 1H), 7.27–7.23 (m, 1H), 7.23–7.17 (m, 2H), 6.81 (s, 2H), 4.60 (dq, J = 13.1, 8.8 Hz, 2H), 4.30–4.23 (m, 1H), 3.78 (d, J = 12.9 Hz, 1H), 3.71 (d, J = 12.9 Hz, 1H), 3.25–3.15 (m, 4H), 2.37 (s, 6H), 1.89–1.78 (m, 1H), 1.76–1.60 (m, 3H). 13C NMR (151 MHz, DMSO) δ 175.01, 163.66, 163.13, 156.85, 155.95, 150.11, 139.85, 136.40, 131.38, 130.46, 128.97, 128.24, 127.31, 126.69, 125.59, 125.17, 125.06, 122.88, 114.15, 71.85, 61.71, 60.72, 52.17, 43.47, 28.83, 28.63, 25.29.
(3-((5-(2-(Aminomethyl)phenyl)-2,3-dihydrobenzofuran)-7-sulfonamido)thiophene-2-carbonyl)-l-arginine (15a)
The general Suzuki method was used with 2-aminomethylboronic acid 1 × 3.6 mmol scale reaction. This gave 14a as a pale-yellow solid, 2.56 g, 3.2 mmol, 88%. Rt 3.31 min. MS m/z −812/814 [M + H]+. Standard Pbf removal 1 × 0.12 mmol scale reaction. White solid, 48 mg, 0.057 mmol, 48%. Rt 2.37 min. MS m/z −839 [M + H]+. HRMS (ES +ve): Calculated for C26H29N6O6S2 585.1590. Measured mass: 585.1590. 1H NMR (600 MHz, DMSO-d6) δ 9.80 (d, J = 7.5 Hz, 1H), 8.30 (s, 1H), 7.92 (s, 1H), 7.61–7.56 (m, 1H), 7.45 (d, J = 1.9 Hz, 1H), 7.42–7.37 (m, 1H), 7.37–7.33 (m, 1H), 7.31 (d, J = 5.4 Hz, 1H), 7.22 (d, J = 5.4 Hz, 1H), 7.19–7.15 (m, 2H), 4.55 (dq, J = 30.7, 8.8 Hz, 2H), 4.15–4.11 (m, 1H), 4.11 (d, J = 6.6 Hz, 0H), 3.94–3.82 (m, 2H), 3.17 (t, J = 8.8 Hz, 2H), 3.11 (s, 2H), 3.09 (s, 0H), 1.70 (d, J = 6.8 Hz, 1H), 1.53 (dq, J = 22.5, 7.7, 7.0 Hz, 3H). 13C NMR (151 MHz, DMSO) δ 175.52, 165.55, 162.92, 156.99, 155.49, 149.80, 140.98, 132.76, 130.76, 130.09, 129.67, 128.22, 127.94, 127.47, 127.39, 126.16, 123.51, 114.31, 71.76, 53.05, 29.81, 28.62, 25.30.
(3-((5-(3-(Aminomethyl)phenyl)-2,3-dihydrobenzofuran)-7-sulfonamido)thiophene-2-carbonyl)-l-arginine (15b)
The general Suzuki method was used with 3-aminomethylboronic acid 3.6 mmol scale reaction. This gave 14b as a pale-yellow solid, 2.56 g, 3.2 mmol, 88%. Rt 3.31 min. MS m/z −812/814 [M + H]+. Standard Pbf removal 1 × 0.12 mmol scale reaction, 1 × 0.062 mmol scale reaction. White solid, 15 mg, 0.018 mmol, 29%. Rt 2.29 min. MS m/z −839 [M + H]+. HRMS (ES +ve): Calculated for C26H29N6O6S2 585.1590. Measured mass: 585.1610. 1H NMR (600 MHz, DMSO-d6) δ 9.97 (d, J = 8.6 Hz, 1H), 8.28 (s, 1H), 7.90 (s, 1H), 7.86 (d, J = 1.9 Hz, 1H), 7.82–7.75 (m, 1H), 7.54–7.52 (m, 1H), 7.52 (d, J = 1.8 Hz, 1H), 7.38 (t, J = 7.7 Hz, 1H), 7.31 (d, J = 5.4 Hz, 1H), 7.27 (d, J = 7.6 Hz, 1H), 7.16 (d, J = 5.5 Hz, 1H), 4.63–4.50 (m, 2H), 4.28–4.16 (m, 1H), 4.03–3.93 (m, 2H), 3.22–3.11 (m, 4H), 1.84–1.74 (m, 1H), 1.73–1.51 (m, 3H). 13C NMR (151 MHz, DMSO) δ 176.15, 164.85, 162.91, 161.15, 156.86, 155.97, 150.15, 139.95, 135.65, 131.34, 130.25, 129.06, 128.86, 127.23, 126.48, 126.08, 125.91, 125.55, 124.49, 123.33, 114.57, 71.64, 53.08, 42.12, 30.02, 28.64, 25.53.
Methyl Nω-((2,2,4,6,7-Pentamethyl-2,3-dihydrobenzofuran-5-yl)sulfonyl)-N2-(3-((5-(4,4,5,5-tetramethyl-1,3,2-dioxaborolan-2-yl)-2,3-dihydrobenzofuran)-7-sulfonamido)thiophene-2-carbonyl)-l-argininate (16)
(S)-2-{[3-(5-Bromo-2,3-dihydro-benzofuran-7-sulfonylamino)-thiophene-2-carbonyl]-amino}-5-(2,2,4,6,7-pentamethyl-2,3-dihydro-benzofuran-5-sulfonyl-guanidino)-pentanoic acid methyl ester (5 g, 6.00 mmol), bispinacolato diboron (1.85 g, 7.3 mmol), Pd(dppf)2Cl2 (443 mg, 0.6 mmol), and KOAc (1.78 g, 18.1 mmol) were combined and suspended in dioxane (30 mL). The suspension was degassed with nitrogen for 30 min before heating at 100 °C for 16 h. The reaction was allowed to cool to room temperature and partitioned between EtOAc (200 mL) and water (200 mL). The aqueous phase was extracted with EtOAc (2 × 100 mL), and the combined organic extracts were washed with water (300 mL) then brine (300 mL) and dried over Na2SO4. Concentration in vacuo provided the crude product as a brown residue (6.6 g). The crude product was purified by flash column chromatography on silica gel (eluent: neat ethyl acetate, increasing to ethyl acetate/MeOH 95:5), affording the desired product as a brown foam (3.73 g, 71%). Used directly in the Suzuki reactions. LC-MS (pH 2): Rt 3.27 min. MS m/z 873 [M + H]+.
(3-((5-(Isoindolin-4-yl)-2,3-dihydrobenzofuran)-7-sulfonamido)thiophene-2-carbonyl)-l-arginine (18a)
Following the general Suzuki procedure but with CsCO3 as the base and 4-bromoisoindoline used as coupling partner 0.34 mmol scale (single reaction), 120 °C, 10 min. This yielded 17a as a pale-pink solid, 128 mg, 0.15 mmol, 43% (pH 2). Rt 2.38 min. MS m/z −865 [M + H]+. Hydrolysis of the methyl ester and Pbf removal 0.15 mmol scale. Product white solid, 58 mg, 0.097 mmol, 65% (pH 2). Rt 4.25 min. MS m/z −599 [M + H]+ (pH 9). Rt 5.28 min; purity 99%. MS m/z −599 [M + H]+. HRMS (ES +ve): Calculated for C25H26N5O6S2 597.1590. Measured mass: 597.1554. 1H NMR (600 MHz, DMSO-d6) δ 12.88 (s, 1H), 11.11 (s, 1H), 8.57 (d, J = 7.5 Hz, 1H), 7.75–7.71 (m, 1H), 7.69 (d, J = 5.5 Hz, 1H), 7.63 (d, J = 1.8 Hz, 1H), 7.52 (d, J = 1.8 Hz, 1H), 7.48 (t, J = 7.5 Hz, 1H), 7.44 (d, J = 7.0 Hz, 1H), 7.38 (dd, J = 7.5, 1.2 Hz, 1H), 7.21 (d, J = 5.4 Hz, 1H), 4.73–4.66 (m, 2H), 4.58 (m, 2H), 4.54 (m, 2H), 4.38–4.34 (m, 1H), 3.33–3.20 (m, 2H), 3.16–3.06 (m, 2H), 1.92–1.83 (m, 1H), 1.79–1.69 (m, 1H), 1.61–1.45 (m, 2H). 13C NMR (151 MHz, DMSO) δ 173.14, 163.49, 156.79, 156.33, 141.36, 136.25, 135.13, 132.73, 132.01, 130.99, 129.30, 128.17, 126.00, 122.26, 119.90, 113.21, 73.86, 52.07, 50.35, 49.96, 40.32, 28.38, 27.34, 25.57.
(3-((5-(isoindolin-5-yl)-2,3-dihydrobenzofuran)-7-sulfonamido)thiophene-2-carbonyl)-l-arginine (18b)
Using the standard Suzuki procedure but with CsCO3 (3 equiv) as the base and boronic acid 16 following the Suzuki procedure used for 18a above and t-butyl-5-bromoisoindoline-2-carboxylate as the coupling partners (scale 2 × 0.11 mmol and 1 × 0.23 mmol – total scale = 0.46 mmol of boronic acid). Product 17b white solid, 71 mg, 0.074 mmol, 16%. LC-MS (pH 2): Rt 3.40 min. MS m/z −965 [M + 1]+. Rt 3.46 min. MS m/z −951 [carboxylic acid + 1]+. Hydolysis of the methyl ester using LiOH followed by standard Pbf removal. To a stirred solution of the methyl ester (71 mg, 0.073 mmol) in THF (2.5 mL) was added 1 M lithium hydroxide (aq, 0.37 mL, 0.36 mmol) and the reaction mixture stirred at room temperature for 1.5 h. The solvent was removed in vacuo and the residue dissolved in DCM/TFA (1:1, 1.8 mL) and stirred at room temperature for 18 h and then 40 °C for 24 h. The solvent was removed in vacuo and the crude residue dissolved in DMSO and purified by (mass-directed) preparative LC-MS using a preparative C-18 column (Phenomenex Luna C18 (2), 100 mm × 21.2 mm, 5 μM) and a linear AB gradient of 5–95% for B over 12 min at a flow rate of 20 mL/min, where eluent A was 0.1% formic acid/water and eluent B was 0.1% formic acid/MeOH. The combined HPLC fractions were concentrated in vacuo to provide the title compound as a white solid, 29 mg, 0.05 mmol, 66%. LC-MS (pH 2): Rt 4.03 min. MS m/z −599 [M + H]+. HRMS (ES +ve): Calculated for C25H26N5O6S2 597.1590. Measured mass: 597.1576. 1H NMR (600 MHz, DMSO-d6) δ 12.88 (s, 1H), 11.08 (s, 1H), 8.71–8.35 (m, 1H), 7.80 (d, J = 1.8 Hz, 1H), 7.75–7.70 (m, 2H), 7.69–7.65 (m, 2H), 7.60 (dd, J = 7.9, 1.7 Hz, 1H), 7.48 (d, J = 8.0 Hz, 1H), 7.19 (d, J = 5.5 Hz, 1H), 4.72–4.64 (m, 2H), 4.60–4.51 (m, 4H), 4.39–4.29 (m, 1H), 3.32–3.19 (m, 2H), 3.15–3.07 (m, 2H), 1.91–1.82 (m, 1H), 1.81–1.66 (m, 1H), 1.59–1.46 (m, 2H). 13C NMR (151 MHz, DMSO) δ 173.15, 171.49, 163.48, 156.79, 156.58, 156.28, 141.36, 138.90, 136.25, 130.31, 126.67, 124.74, 123.58, 120.20, 119.88, 113.17, 73.79, 52.05, 40.32, 36.53, 28.37, 27.35, 22.55, 1.20.
Biology
United Kingdom: All in vivo study protocols, husbandry, and anesthesia were performed by followed guidelines of United Kingdom Home Office Scientific Procedures Act (1986). USA: All animal work was approved by the Stony Brook University IACUC.
Protein Expression, Purification, and Crystallization
Recombinant human NRP1-b1 domain was expressed in Escherichia coli strain Rosetta Gami 2 (DE3) pLysS cells. Gene sequence corresponding to NRP1-b1 residues 273–427 was subcloned into pET15b vector, resulting in a protein product that contains a TEV protease- cleavable His6 tag on the N-terminus. The protein was purified to a high level of homogeneity using a combination of Ni-NTA (GE Healthcare) affinity chromatography with size exclusion chromatography (Superdex S75, GE Healthcare) and ion exchange chromatography using an SP FF Sepharose column (GE Healthcare). Purified protein was dialyzed into 20 mM Tris-HCl pH 7.9 and 50 mM NaCl prior to crystallization.
Crystallization of both the high and low resolution crystals was performed using the vapor diffusion methods using a 1:1 ratio of protein to mother liquor. Crystallization of the low resolution structure was carried out at 20 °C, with NRP1-b1 concentration of 10 mg/mL supplemented with 1 mM of 1 and with the precipitant solution containing 16% w/v PEG3350 and 200 mM ammonium chloride. Crystals of the high resolution structure were grown at 4 °C with protein solution at 10 mg/mL supplemented with 2.3 mM of 1. Crystallization condition contained 12% w/v PEG3350 and 200 mM ammonium chloride. Prior to data collection, both crystals were cryoprotected in mother liquor containing an additional 22% PEG300.
Data Collection and Processing
Low resolution (2.8 Å) data was collected at the Institute for Structural and Molecular Biology X-ray crystallography facilities equipped with Rigaku Micromax 007 generator and a Rigaku Saturn 944+ CCD detector. The 600 images were collected with a 0.5° oscillation which were processed using d*TREK.38
High resolution (0.9 Å) data was obtained at Soleil, Paris. Diffraction data was collected at the PROXIMA 1 beamline with a DECTRIS PILATUS 6 M detector. The 1800 images of 0.1° oscillations were collected and processed using XDS software.39
Molecular replacement was performed using Phaser40 with the NRP1-b1 domain structure (PDB 3I97) as a model. Refinement of the lower resolution structure was performed using Phenix.41 The high resolution structure was initially refined with Phenix before completing the refinement using ShelXL.42 Model building of both structures was performed using COOT.43 Data quality and refinement statistics are shown in Table S1 (Supporting Information).
SPR Experimental
Surface plasmon resonance experiments were performed using a Biacore 4000 instrument at 25 °C. Sensor chips, buffer stock solutions, and immobilization reagents were from GE Healthcare. Recombinant human NRP1-b1 was as above. Other reagents were obtained from Sigma. Immobilization: PBS (containing 0.05% surfactant P20) was used as the running buffer. The four flow cells were treated in the same way to optimize throughput. In summary, using a CM5 chip spots 1 and 2 were activated with the coupling reagents EDC and NHS for 10 min. NRP1-b1 at a concentration of 20 μg/mL in 10 mM sodium acetate pH 5 was injected onto the surface for 10 and 5 min in spots 1 and 2, respectively, to generate surfaces with high and low density. The immobilization levels ranged from 2302 to 1823 RU on spot 1 and from 948 to 1112 RU in spot 2. The unmodified spot 3 was used as a reference. Kinetics and affinity measurements: PBS containing 0.05% surfactant P20 and 3% DMSO was used as the running buffer and sample dilution buffer. Dose–responses were obtained using a 2-fold sample dilution from 16 μM to 31 nM, using an injection time of 60 s. Surface regeneration between injections was not necessary, but a wash step with 1 M NaCl was included after injection of the highest concentration sample for each compound. Data processing: Binding curves were corrected for variations in DMSO concentration and normalized by molecular weight. Binding results to high and low-density surfaces were processed independently and the average ± SD is presented. KDs reported are derived from steady-state binding responses and therefore correspond to the equilibrium binding affinity of the compounds.
Isothermal Titration Calorimetry
Isothermal titration calorimetry (ITC) experiments were carried out in a reaction buffer (20 mM Tris pH 7.9, 50 mM NaCl) using a MicroCal iTC200 system (Malvern) at 20 °C. Prior to the experiments, the Nrp1-b1 sample was dialyzed in the reaction buffer and all solutions, including the buffer that was used for heat dilution measurements, were degassed and filtered just before loading into the calorimeter. Then 20 μM Nrp1-b1 in the reaction cell was titrated with the 200 μM stock solutions of 1. Nineteen consecutive compound injections of 2 μL at 0.4 s/μL were applied at 100 s intervals while stirring the reaction solution at 1000 rpm constant speed. For heat dilution of the protein, 0.2 mL of reaction buffer in the reaction cell was titrated by 40 μL of 200 μM compound, and this value was subtracted from the measured heats of binding. Protein concentrations of the samples used in these experiments were estimated by UV absorbance measurements at 280 nm. Data were evaluated using Origin version 7.0 software (OriginLab) with the ITC plug-in provided by the instrument manufacturer.
Pharmacokinetics
To test compound drug-like properties, selected compounds with low IC50 were further tested for pharmacokinetics (PK) profile. First, 6–8 week-old BABL/c female mice were used, then 2 mg/kg of compounds was formulated in 7.5% DMSO and 92.5% solution and intravenously dosed from the tail vein as a bolus. Blood samples were collected by cardiac puncture at 5, 15, 30, 60, 180, and 240 min post dosing. Plasma samples were prepared by centrifugation at 7000 rpm for 5 min, and supernatants were collected, immediately snap-frozen on dry ice, and stored at −20C. Samples were analyzed by liquid chromatography–tandem mass spectrometry using electrospray ionization and data was analyzed by WinNonlin software.
btVEGF-A Cell-Free Binding Assay
The 96-well plates were precoated with NP1 protein at 3 μg/mL overnight at 4 °C. On the following day, the plates were treated with blocking buffer (PBS containing 1% BSA) and washed three times with wash buffer (PBS containing 0.1% Tween-20). The various concentrations of compounds diluted in PBS containing 1% DMSO were added, followed by addition of 0.25 nM of bt-VEGF-A165. After 2 h of incubation at room temperature, the plates were washed three times with wash buffer. The bound bt-VEGF-A165 to NP-1 was detected by streptavidin–horseradish peroxidase conjugates and the enzyme substrate, and measured using a Tecan Genios plate reader at A450 nm with a reference wavelength at A595 nm. Nonspecific binding was determined in the absence of NP-1 coated wells of the plates.
Immunoblotting
Cells were lysed with RIPA buffer (Sigma) supplemented with protease inhibitor (Roche) and phosphatase inhibitors II and III (Sigma) and analyzed by SDS-PAGE with 4–12% Bis·Tris gels (Nupage, Invitrogen), followed by electrotransfer onto Invitrolon PVDF membranes (Invitrogen). Membranes were blocked with nonfat dry milk (5% w/v) and Tween-20 (0.1% v/v) in tris-buffered saline (TBS-T), for 1 h at room temperature before being probed with the primary antibody by overnight incubation at 4 °C, followed by incubation for 1 h at room temperature with a horseradish-peroxidase-linked secondary antibody (Cell Signaling) and detection with the aid of Clarity Western ECL Substrate (BioRad), by the manufacturer’s protocol. Immunoblots were quantified by scanning the films and then performing densitometry by use of ImageJ (US National Institutes of Health; http://rsb.info.nih.gov/ij/). Differences between three concentrations of 1 were evaluated by the two-way analysis of variance (ANOVA) with Sidak’s multiple comparisons test. Values represent means ± SEM determined from the results of three independent experiments. A value of p < 0.05 was considered statistically significant.
Cell Culture
Human umbilical vein endothelial cells (HUVECs) were obtained from TCS Cell Works (Buckingham, UK) and were cultured on tissue culture-coated flaks in endothelial basal medium (EBM; Cambrex BioScience Ltd., Nottingham, UK) supplemented with gentamycin–ampicillin, epidermal growth factor, and bovine brain extract (Singlequots; Cambrex) and 10% fetal bovine serum (FBS) (complete EBM). For experimental purposes, fully confluent HUVECs at passages 1–3 were preincubated overnight with 1% FBS in EBM prior to addition of factors and other treatments. DU145/cells.Ad.NRP1 cells: DU145 prostate cancer cells were from ATCC and infected with an adenovirus expressing WT NRP1 as previously described27 (cells were grown in 10% FCS in DMEM). A375P melanoma cells were from ATCC. Cells were grown in 10% FCS in DMEM.
Human dermal fibroblasts (HDF) were obtained from TCS cells Works Buckingham, UK) and were cultured in Dulbecco’s Modified Eagle Medium (DMEM, Gibco) supplemented with 10% fetal bovine serum (FBS) and 1% penicillin/streptomycin (Gibco). For experimental purposes, fully confluent HDF at passages 1–3 were preincubated overnight with serum-free DMEM prior to other procedures. GL261 cells were purchased from ATCC and cultured as described.44,45
Transwell Migration
Transwell cell culture inserts made of transparent, low pore density polyethylene terephthalate (PET) with 8 μm pore size (Falcon; BD Biosciences, Oxford, UK) were inserted into a 24-well plate. Serum-free media supplemented with or without 25 ng/mL VEGF-A, 0.1% DMSO, or 1 (30 μM) were placed in the bottom chamber, and HUVECs in suspension (1.5 × 10⁵ cell/well in serum-free EBM) were added to the top chamber of a 24-well plate and incubated at 37 °C for 4 h. HUVECs that had not migrated or had only adhered to the upper side of the membrane were removed before membranes were fixed and stained with a Reastain Quik-Diff kit (IBG Immucor Ltd., West Sussex, UK) using the manufacturer’s protocols. Plates were allowed to dry overnight and HUVECs that had migrated to the lower side of the membrane were counted in three random fields per well.
Coculture
In vitro angiogenesis was determined by using a coculture assay. Briefly, HDF cells were grown to confluence in 24-well plates in 10% DMEM, 1% penicillin/streptomycin. Medium was replaced, and 10000 HUVECs were plated on top of the fibroblast layer cultured in complete endothelial growth medium supplemented with 1% FBS. HUVECs, or medium with 0.1% DMSO, VEGF 25 ng/mL, 1 (30 μM), and 1 (30 μM) + VEGF 25 ng/mL and fibroblasts were propagated in coculture for 4 days at 37 °C and 5% CO2. Cells in coculture were fixed in absolute ethanol for 1 h at room temperature, washed twice in PBS, and blocked using PBS 5% milk. HUVECs were identified by incubating with anti-von Willebrand factor antibody (Dako, 1:1000) in PBS 5% milk overnight at 4 °C. Antibody was removed and cells washed with PBS. The secondary antibody, goat anti-rabbit IgG, Alexa Fluor 488 conjugate (Life Technologies, 1:1000), was added on cells and left for 1 h in the dark. Solution was removed and plate was scanned using IncuCyte.
Photomicrographs of von Willebrand factor-stained cocultures were analyzed using ImageJ software. The Network area, length of all tubular structures, and the number of branching points were measured in four representative microscopic fields per well.
Scratch Assay
The experiment was performed using the ESSEN IncuCyte system. Graduated 96-well plates from ESSEN were used to seed HUVECs. When cells reached 95% confluence, a wound was made on every well using the Wound Maker 96 instrument (ESSEN instruments). Wells were supplemented with 1% EGM containing 0.1% DMSO, 25 ng/mL VEGF-A, and/or 1 (30 μM). Cell migration toward the wounds was monitored every 2 h and analyzed by the IncuCyte software.
Ex Vivo Aortic Ring Sprouting Assay
This protocol was adapted from previous studies.32 All animal and tissue procedures were carried out in accordance with United Kingdom Home Office regulations and guidance. Briefly, female wild-type C57Bl/6 mice were killed in accordance with United Kingdom Home Office regulations. Thoracic aorta was harvested from aortic arch. Aorta was placed into a sterile Petri dish containing Opti-MEM Glutamax (Life technologies) and 1% penicillin/streptomycin. Under the dissection micrioscope, aortas were cleaned by sharp dissection and the vessel sliced into 0.5 mm rings with a scalpel. Rings were serum starved overnight at 37 °C in 5 mL of OptiMEM Glutamax supplemented with 1% penicillin/streptomycin. On ice, 1.37 mL of purified type 1 rat-tail collagen (Millipore, Watford, United Kingdom) was mixed with 0.5 mL of 10× DMEM (Gibco) and 3.13 mL of dH2O before adding 2 μL/ml of 5 M NaOH. A 55 μL amount of this embedding matrix was pipetted per well into a 96-well plate and aortic ring submerged within. Plates were left for 15 min at room temperature before incubation for 60 min at 37 °C. A 150 μL amount of OptiMEM Glutamax containing 2.5% FBS and 1% penicillin/streptomycin was added per well with medium containing 0.1% DMSO, 25 ng/mL VEGF-A, and/or 1 (30 μM). Aortic rings were incubated at 37 °C for 7 days with a medium change on day 3 and 5. Wells were washed with 150 μL of PBS containing 2 mM CaCl2 and 2 mM MgCl2 and fixed in 4% formalin for 30 min. The collagen was permeabilized with three 15 min washes with PBS buffer containing 2 mM MgCl2, 2 mM CaCl2, and 0.25% Triton X-100. Rings were blocked in 30 μL of 1% BSA in PBLEC (PBS containing 100 μM MnCl2, 1% Tween-20, 2 mM CaCl2, 2 mM MgCl2) for 30 min at 37 °C. Then 100 μL of a mix containing IsolectinB4 (1:100, Vector Laboratories) and anti smooth muscle, SMA (1:100, Sigma) was added per well, followed by overnight incubation at 4 °C. Wells were washed three times with 100 μL of PBS containing 0.1% Triton X-100 and then with 100 μL of sterile water. Aortic rings were imaged and the area of sprout growth was quantified using ImageJ software.
Spheroid Assay
Spheroids were generated using the metho-cellulose technique as described previously. Briefly, cells were trypsinized and counted. A mix containing 10 mL of metho-cellulose-containing medium (30% metho-cellulose, 70% culture medium) was prepared and kept on ice. Approximately 5000 cells were added to the mix. Spheroids were produced by pipetting 100 μL of the cell suspension into a well of a 96-well round-bottomed nontissue-culture plate and incubating for 24 h (37 °C, 5% CO2). Spheroids were collected and embedded in a mix containing 700 μL of collagen type I (3.1 mg/mL), 200 μL of 5× DMEM, 100 μL of H2O, and supplemented with 0.1% DMSO, 25 ng/mL VEGF-A, and/or 1 30 μM. Spheroids were allowed to invade for 7 days, followed by fixation in 4% formaldehyde. Spheroid invasion was determined by measuring the circular area of the spheroid core and the rim of invasion using ImageJ. The rim of invasion was determined as the circular distance from the edge of the core to the edge of contiguous invading cells.
Isolation and Treatment of Nrp1+ Regulatory T Cells
Primary murine splenocytes were isolated from 6-week-old C57/Bl6 mice. Briefly, mice were heavily anesthetized with avertin (0.02 mg/g ip) and perfused with 1× PBS. Spleens were dissected, chemically digested in papain for 15 min at 37 °C, minced, and dissociated in PBS supplemented with 1% FBS and 1 mM EDTA. Cell suspensions were filtered through 40 μm filters, washed thoroughly, and a Dynabeads Untouched Mouse CD4 Cells kit (Invitrogen) was used to purify CD4+ cells following the manufacturer’s protocol. The cells were then purified further for Nrp1 expression using positive selection for Nrp1 using anti-Nrp1 antibody (Biolegend) and then using magnetic Dynabeads (Invitrogen) to pull out this fraction. Cells were plated at a density of 200000 cells per well. Plates were precoated with anti-CD3ε (clone 145-2C11, BD Biosciences) overnight at 4 °C. Cells were cultured in 250 μL of RPMI supplemented with 10%FBS, 1× penicillin/streptomycin, and anti-CD28 antibody (clone 37.51, BD Biosciences) for costimulation. Cells were allowed to expand for 72 h, at which point they were treated with either DMSO control (untreated) or 500 nM 1 for 2 h. Media was then supplemented with 50% glioma-conditioned media (GCM) isolated from confluent plates of GL261 cells (ATCC)44,45 that were serum starved for 24 h. Cultures were allowed to sit for 12 h, after which cells were isolated for flow cytometric analysis of CD4 (eBioscience), CD25 (Biolegend), Nrp1 (Biolegend), and FOXP3 (BD Biosciences) expression using a BD LSR Fortessa flow cytometer (BD Biosciences). Medium was isolated and TGFβ release by cells was quantified using a TGFβ Ready Set Go ELISA kit (eBioscience) following the manufacturer’s protocol.
Acknowledgments
We thank BHF (Programme Grant RG/11/11/29050 to I.Z.), Ark Therapeutics, and Magnus Life Ltd. NIH grants are F30CA196110 (J.T.M.) and R01NS42168 (S.E.T.)
Glossary
Abbreviations Used
- NRP1
neuropilin-1
- TGFβ
transforming growth factor beta
- Treg
regulatory T-cell SMAD3/AKT
- VEGF-A
vascular endothelial growth factor A
Supporting Information Available
The Supporting Information is available free of charge on the ACS Publications website at DOI: 10.1021/acs.jmedchem.8b00210.
Accession Codes
PDB codes for NRP1-b1 bound with 1: low resolution 6FMF and high resolution 6FMC. Authors will release the atomic coordinates and experimental data upon article publication.
Author Contributions
Δ J.P., F.M., and D.St. contributed equally. J.P., A.J., N.W., and D.S. synthesized the compounds. G.E. and A.F. carried out the scale-up studies. D.S., J.P., A.J., and T.R. ran the spectra. F.M. and Y.C. carried out the SPR. C.M., H.J., A.O.L., L.C., D.L., and T.R. did the in vitro biology. S.C. and A.W.E.C. did the molecular modeling. T.Y., D.F., and S.D. ran X-ray crystallography and the ITC studies. J.M. and S.T. carried out the Treg experiments. D.S. wrote the paper with contributions from the authors, especially D.St., P.F., S.D., S.T., and I.Z.
The authors declare no competing financial interest.
Supplementary Material
References
- Pellet-Many C.; Frankel P.; Jia H.; Zachary I. Neuropilins: structure, function and role in disease. Biochem. J. 2008, 411, 211–226. 10.1042/BJ20071639. [DOI] [PubMed] [Google Scholar]
- Fantin A.; Herzog B.; Mahmoud M.; Yamaji M.; Plein A.; Denti L.; Ruhrberg C.; Zachary I. Neuropilin 1 (NRP1) hypomorphism combined with defective VEGF-A binding reveals novel roles for NRP1 in developmental and pathological angiogenesis. Development (Cambridge, U. K.) 2014, 141, 556–562. 10.1242/dev.103028. [DOI] [PMC free article] [PubMed] [Google Scholar]
- Gu C.; Limberg B. J.; Whitaker G. B.; Perman B.; Leahy D. J.; Rosenbaum J. S.; Ginty D. D.; Kolodkin A. L. Characterization of neuropilin-1 structural features that confer binding to semaphorin 3A and vascular endothelial growth factor 165. J. Biol. Chem. 2002, 277, 18069–18076. 10.1074/jbc.M201681200. [DOI] [PubMed] [Google Scholar]
- Roy S.; Bag A. K.; Singh R. K.; Talmadge J. E.; Batra S. K.; Datta K. Multifaceted role of neuropilins in the immune system: potential targets for immunotherapy. Front. Immunol. 2017, 8, 1228. 10.3389/fimmu.2017.01228. [DOI] [PMC free article] [PubMed] [Google Scholar]
- Tordjman R.; Lepelletier Y.; Lemarchandel V.; Cambot M.; Gaulard P.; Hermine O.; Romeo P. H. A neuronal receptor, neuropilin-1, is essential for the initiation of the primary immune response. Nat. Immunol. 2002, 3, 477–482. 10.1038/ni789. [DOI] [PubMed] [Google Scholar]
- Delgoffe G. M.; Woo S. R.; Turnis M. E.; Gravano D. M.; Guy C.; Overacre A. E.; Bettini M. L.; Vogel P.; Finkelstein D.; Bonnevier J.; Workman C. J.; Vignali D. A. Stability and function of regulatory T cells is maintained by a neuropilin-1-semaphorin-4a axis. Nature 2013, 501, 252–256. 10.1038/nature12428. [DOI] [PMC free article] [PubMed] [Google Scholar]
- Overacre-Delgoffe A. E.; Chikina M.; Dadey R. E.; Yano H.; Brunazzi E. A.; Shayan G.; Horne W.; Moskovitz J. M.; Kolls J. K.; Sander C.; Shuai Y.; Normolle D. P.; Kirkwood J. M.; Ferris R. L.; Delgoffe G. M.; Bruno T. C.; Workman C. J.; Vignali D. A. A. Interferon-gamma drives Treg fragility to promote anti-tumor immunity. Cell 2017, 169, 1130–1141. 10.1016/j.cell.2017.05.005. [DOI] [PMC free article] [PubMed] [Google Scholar]; e1111
- Bruder D.; Probst-Kepper M.; Westendorf A. M.; Geffers R.; Beissert S.; Loser K.; von Boehmer H.; Buer J.; Hansen W. Neuropilin-1: a surface marker of regulatory T cells. Eur. J. Immunol. 2004, 34, 623–630. 10.1002/eji.200324799. [DOI] [PubMed] [Google Scholar]
- Yadav M.; Louvet C.; Davini D.; Gardner J. M.; Martinez-Llordella M.; Bailey-Bucktrout S.; Anthony B. A.; Sverdrup F. M.; Head R.; Kuster D. J.; Ruminski P.; Weiss D.; Von Schack D.; Bluestone J. A. Neuropilin-1 distinguishes natural and inducible regulatory T cells among regulatory T cell subsets in vivo. J. Exp. Med. 2012, 209, 1713–1722. 10.1084/jem.20120822. [DOI] [PMC free article] [PubMed] [Google Scholar]
- Weiss J. M.; Bilate A. M.; Gobert M.; Ding Y.; Curotto de Lafaille M. A.; Parkhurst C. N.; Xiong H. Z.; Dolpady J.; Frey A. B.; Ruocco M. G.; Yang Y.; Floess S.; Huehn J.; Oh S. Y.; Li M. O.; Niec R. E.; Rudensky A. Y.; Dustin M. L.; Littman D. R.; Lafaille J. J. Neuropilin 1 is expressed on thymus-derived natural regulatory T cells, but not mucosa- generated induced Foxp3(+) T reg cells. J. Exp. Med. 2012, 209, 1723–1742. 10.1084/jem.20120914. [DOI] [PMC free article] [PubMed] [Google Scholar]
- Singh K.; Hjort M.; Thorvaldson L.; Sandler S. Concomitant analysis of Helios and Neuropilin-1 as a marker to detect thymic derived regulatory T cells in naive mice. Sci. Rep. 2015, 5, 7767. 10.1038/srep07767. [DOI] [PMC free article] [PubMed] [Google Scholar]
- Miyauchi J.; Chen D.; Choi M.; Nissen J.; Shroyer K.; Djordevic S.; Zachary I.; Selwood D.; Tsirka S. Ablation of neuropilin 1 from glioma-associated microglia and macrophages slows tumor progression. Oncotarget 2016, 7, 9801–9814. 10.18632/oncotarget.6877. [DOI] [PMC free article] [PubMed] [Google Scholar]
- Glinka Y.; Prud’homme G. J. Neuropilin-1 is a receptor for transforming growth factor β-1, activates its latent form, and promotes regulatory T cell activity. J. Leukocyte Biol. 2008, 84, 302–310. 10.1189/jlb.0208090. [DOI] [PMC free article] [PubMed] [Google Scholar]
- Glinka Y.; Stoilova S.; Mohammed N.; Prud’homme G. J. Neuropilin-1 exerts co-receptor function for TGF-beta-1 on the membrane of cancer cells and enhances responses to both latent and active TGF-beta. Carcinogenesis 2011, 32, 613–621. 10.1093/carcin/bgq281. [DOI] [PubMed] [Google Scholar]
- Nissen J. C.; Selwood D. L.; Tsirka S. E. Tuftsin signals through its receptor neuropilin-1 via the transforming growth factor beta pathway. J. Neurochem. 2013, 127, 394–402. 10.1111/jnc.12404. [DOI] [PMC free article] [PubMed] [Google Scholar]
- Mahoney K. M.; Rennert P. D.; Freeman G. J. Combination cancer immunotherapy and new immunomodulatory targets. Nat. Rev. Drug Discovery 2015, 14, 561–584. 10.1038/nrd4591. [DOI] [PubMed] [Google Scholar]
- Graziani G.; Lacal P. M. Neuropilin-1 as therapeutic target for malignant melanoma. Front. Oncol. 2015, 5, 125. 10.3389/fonc.2015.00125. [DOI] [PMC free article] [PubMed] [Google Scholar]
- Pan Q.; Chanthery Y.; Liang W.-C.; Stawicki S.; Mak J.; Rathore N.; Tong R. K.; Kowalski J.; Yee S. F.; Pacheco G.; Ross S.; Cheng Z.; Le Couter J.; Plowman G.; Peale F.; Koch A. W.; Wu Y.; Bagri A.; Tessier-Lavigne M.; Watts R. J. Blocking neuropilin-1 function has an additive effect with anti-VEGF to inhibit tumor growth. Cancer Cell 2007, 11, 53–67. 10.1016/j.ccr.2006.10.018. [DOI] [PubMed] [Google Scholar]
- Jia H.; Cheng L.; Tickner M.; Bagherzadeh A.; Selwood D.; Zachary I. Neuropilin-1 antagonism in human carcinoma cells inhibits migration and enhances chemosensitivity. Br. J. Cancer 2010, 102, 541–552. 10.1038/sj.bjc.6605539. [DOI] [PMC free article] [PubMed] [Google Scholar]
- Hansen W.; Hutzler M.; Abel S.; Alter C.; Stockmann C.; Kliche S.; Albert J.; Sparwasser T.; Sakaguchi S.; Westendorf A. M.; Schadendorf D.; Buer J.; Helfrich I. Neuropilin 1 deficiency on CD4+Foxp3+ regulatory T cells impairs mouse melanoma growth. J. Exp. Med. 2012, 209, 2001–2016. 10.1084/jem.20111497. [DOI] [PMC free article] [PubMed] [Google Scholar]
- Starzec A.; Ladam P.; Vassy R.; Badache S.; Bouchemal N.; Navaza A.; du Penhoat C. H.; Perret G. Y. Structure–function analysis of the antiangiogenic ATWLPPR peptide inhibiting VEGF165 binding to neuropilin-1 and molecular dynamics simulations of the ATWLPPR/neuropilin-1 complex. Peptides 2007, 28, 2397–2402. 10.1016/j.peptides.2007.09.013. [DOI] [PubMed] [Google Scholar]
- Jia H.; Bagherzadeh A.; Hartzoulakis B.; Jarvis A.; Lohr M.; Shaikh S.; Aqil R.; Cheng L.; Tickner M.; Esposito D.; Harris R.; Driscoll P. C.; Selwood D. L.; Zachary I. C. Characterization of a bicyclic peptide neuropilin-1 (NP-1) antagonist (EG3287) reveals importance of vascular endothelial growth factor exon 8 for NP-1 binding and role of NP-1 in KDR signaling. J. Biol. Chem. 2006, 281, 13493–13502. 10.1074/jbc.M512121200. [DOI] [PubMed] [Google Scholar]
- Jia H.; Aqil R.; Cheng L.; Chapman C.; Shaikh S.; Jarvis A.; Chan A. W. E.; Hartzoulakis B.; Evans I. M.; Frolov A.; Martin J.; Frankel P.; Djordevic S.; Zachary I. C.; Selwood D. L. N-terminal modification of VEGF-A C terminus-derived Peptides delineates structural features involved in neuropilin-1 binding and functional activity. ChemBioChem 2014, 15, 1161–1170. 10.1002/cbic.201300658. [DOI] [PubMed] [Google Scholar]
- Getz J. A.; Cheneval O.; Craik D. J.; Daugherty P. S. Design of a cyclotide antagonist of neuropilin-1 and −2 that potently inhibits endothelial cell migration. ACS Chem. Biol. 2013, 8, 1147–1154. 10.1021/cb4000585. [DOI] [PubMed] [Google Scholar]
- Borriello L.; Montes M.; Lepelletier Y.; Leforban B.; Liu W. Q.; Demange L.; Delhomme B.; Pavoni S.; Jarray R.; Boucher J. L.; Dufour S.; Hermine O.; Garbay C.; Hadj-Slimane R.; Raynaud F. Structure-based discovery of a small non-peptidic neuropilins antagonist exerting in vitro and in vivo anti-tumor activity on breast cancer model. Cancer Lett. 2014, 349, 120–127. 10.1016/j.canlet.2014.04.004. [DOI] [PubMed] [Google Scholar]
- Liu W.-Q.; Megale A. V.; Borriello L.; Leforban B.; Montes M.; Goldwaser E.; Gresh N.; Piquemal J.-P.; Hadj-Slimane R.; Hermine O.; Garbay C.; Raynaud F.; Lepelletier Y.; Demange L. Synthesis and structure-activity relationship of non-peptidic antagonists of neuropilin-1 receptor. Bioorg. Med. Chem. Lett. 2014, 24, 4254–4259. 10.1016/j.bmcl.2014.07.028. [DOI] [PubMed] [Google Scholar]
- Jarvis A.; Allerston C. K.; Jia H.; Herzog B.; Garza-Garcia A.; Winfield N.; Ellard K.; Aqil R.; Lynch R.; Chapman C.; Hartzoulakis B.; Nally J.; Stewart M.; Cheng L.; Menon M.; Tickner M.; Djordjevic S.; Driscoll P. C.; Zachary I.; Selwood D. L. Small molecule inhibitors of the neuropilin-1 vascular endothelial growth factor A (VEGF-A) interaction. J. Med. Chem. 2010, 53, 2215–2226. 10.1021/jm901755g. [DOI] [PMC free article] [PubMed] [Google Scholar]
- Nissen J. C.; Selwood D. L.; Tsirka S. E. Tuftsin signals through its receptor neuropilin-1 via the transforming growth factor beta pathway. J. Neurochem. 2013, 127, 394–402. 10.1111/jnc.12404. [DOI] [PMC free article] [PubMed] [Google Scholar]
- Grun D.; Adhikary G.; Eckert R. L. VEGF-A acts via neuropilin-1 to enhance epidermal cancer stem cell survival and formation of aggressive and highly vascularized tumors. Oncogene 2016, 35, 4379–4387. 10.1038/onc.2015.507. [DOI] [PMC free article] [PubMed] [Google Scholar]
- Shibuya M. VEGF-VEGFR signals in health and disease. Biomol. Ther. 2014, 22, 1. 10.4062/biomolther.2013.113. [DOI] [PMC free article] [PubMed] [Google Scholar]
- Herzog B.; Pellet-Many C.; Britton G.; Hartzoulakis B.; Zachary I. C. VEGF binding to NRP1 is essential for VEGF stimulation of endothelial cell migration, complex formation between NRP1 and VEGFR2, and signaling via FAK Tyr407 phosphorylation. Mol. Biol. Cell 2011, 22, 2766–2776. 10.1091/mbc.E09-12-1061. [DOI] [PMC free article] [PubMed] [Google Scholar]
- Baker M.; Robinson S. D.; Lechertier T.; Barber P. R.; Tavora B.; D’Amico G.; Jones D. T.; Vojnovic B.; Hodivala-Dilke K. Use of the mouse aortic ring assay to study angiogenesis. Nat. Protoc. 2012, 7, 89–104. 10.1038/nprot.2011.435. [DOI] [PubMed] [Google Scholar]
- Soker S.; Takashima S.; Miao H. Q.; Neufeld G.; Klagsbrun M. Neuropilin-1 is expressed by endothelial and tumor cells as an isoform-specific receptor for vascular endothelial growth factor. Cell 1998, 92, 735–745. 10.1016/S0092-8674(00)81402-6. [DOI] [PubMed] [Google Scholar]
- Ruffini F.; D’Atri S.; Lacal P. M. Neuropilin-1 expression promotes invasiveness of melanoma cells through vascular endothelial growth factor receptor-2-dependent and -independent mechanisms. Int. J. Oncol. 2013, 43, 297–306. 10.3892/ijo.2013.1948. [DOI] [PubMed] [Google Scholar]
- Hansen W.; Hutzler M.; Abel S.; Alter C.; Stockmann C.; Kliche S.; Albert J.; Sparwasser T.; Sakaguchi S.; Westendorf A. M.; Schadendorf D.; Buer J.; Helfrich I. Neuropilin 1 deficiency on CD4+Foxp3+ regulatory T cells impairs mouse melanoma growth. J. Exp. Med. 2012, 209, 2001–2016. 10.1084/jem.20111497. [DOI] [PMC free article] [PubMed] [Google Scholar]
- Tritschler I.; Gramatzki D.; Capper D.; Mittelbronn M.; Meyermann R.; Saharinen J.; Wick W.; Keski-Oja J.; Weller M. Modulation of TGF-beta activity by latent TGF-beta-binding protein 1 in human malignant glioma cells. Int. J. Cancer 2009, 125, 530–540. 10.1002/ijc.24443. [DOI] [PubMed] [Google Scholar]
- Kaminska B.; Kocyk M.; Kijewska M. TGF beta signaling and its role in glioma pathogenesis. Adv. Exp. Med. Biol. 2013, 986, 171–187. 10.1007/978-94-007-4719-7_9. [DOI] [PubMed] [Google Scholar]
- Pflugrath J. W. The finer things in X-ray diffraction data collection. Acta Crystallogr., Sect. D: Biol. Crystallogr. 1999, 55, 1718–1725. 10.1107/S090744499900935X. [DOI] [PubMed] [Google Scholar]
- Kabsch W. Xds. Acta Crystallogr., Sect. D: Biol. Crystallogr. 2010, 66, 125–132. 10.1107/S0907444909047337. [DOI] [PMC free article] [PubMed] [Google Scholar]
- Mccoy A. J.; Grosse-Kunstleve R. W.; Adams P. D.; Winn M. D.; Storoni L. C.; Read R. J. Phaser crystallographic software. J. Appl. Crystallogr. 2007, 40, 658–674. 10.1107/S0021889807021206. [DOI] [PMC free article] [PubMed] [Google Scholar]
- Afonine P. V.; Grosse-Kunstleve R. W.; Echols N.; Headd J. J.; Moriarty N. W.; Mustyakimov M.; Terwilliger T. C.; Urzhumtsev A.; Zwart P. H.; Adams P. D. Towards automated crystallographic structure refinement with phenix.refine. Acta Crystallogr., Sect. D: Biol. Crystallogr. 2012, 68, 352–367. 10.1107/S0907444912001308. [DOI] [PMC free article] [PubMed] [Google Scholar]
- Sheldrick G. M. A short history of SHELX. Acta Crystallogr., Sect. A: Found. Crystallogr. 2008, 64, 112–122. 10.1107/S0108767307043930. [DOI] [PubMed] [Google Scholar]
- Emsley P.; Lohkamp B.; Scott W. G.; Cowtan K. Features and development of Coot. Acta Crystallogr., Sect. D: Biol. Crystallogr. 2010, 66, 486–501. 10.1107/S0907444910007493. [DOI] [PMC free article] [PubMed] [Google Scholar]
- Zhai H.; Heppner F. L.; Tsirka S. E. Microglia/macrophages promote glioma progression. Glia 2011, 59, 472–485. 10.1002/glia.21117. [DOI] [PMC free article] [PubMed] [Google Scholar]
- Zhai H.; Acharya S.; Gravanis I.; Mehmood S.; Seidman R. J.; Shroyer K. R.; Hajjar K. A.; Tsirka S. E. Annexin A2 promotes glioma cell invasion and tumor progression. J. Neurosci. 2011, 31, 14346–14360. 10.1523/JNEUROSCI.3299-11.2011. [DOI] [PMC free article] [PubMed] [Google Scholar]
Associated Data
This section collects any data citations, data availability statements, or supplementary materials included in this article.


