Abstract
Much remains to be understood about the kinetics and thermodynamics of DNA helicase binding and activity. Here, we utilize probe-modified DNA monolayers on multiplexed gold electrodes as a sensitive recognition element and morphologically responsive transducer of helicase–DNA interactions. The electrochemical signals from these devices are highly sensitive to structural distortion of the DNA produced by the helicases. We used this DNA electrochemistry to distinguish the details of the DNA interactions of three distinct XPB helicases, which belong to the superfamily-2 of helicases. Clear changes in DNA melting temperature and duplex stability were observed upon helicase binding, shifts that could not be observed with conventional UV–visible absorption measurements. Binding dissociation constants were estimated in the range from 10 to 50 nM and correlated with observations of activity. ATP-stimulated DNA unwinding activity was also followed, revealing exponential time scales and distinct time constants associated with conventional and molecular wrench modes of operation further confirmed by crystal structures. These devices thus provide a sensitive measure of the structural thermodynamics and kinetics of helicase–DNA interactions.
Graphical abstract
Since their discovery in 1970, exploration of helicases has increased remarkably due to their important roles in virtually all aspects of DNA and RNA metabolism. They are motor proteins that use the energy of NTP hydrolysis to separate two annealed strands of DNA.1 This central reaction is the basis for many critical biological processes such as DNA replication, transcription, translation, recombination, and DNA repair.2–5 Much remains to be understood about the 95 nonredundant helicases comprised of 64 RNA helicases and 31 DNA helicases.6
Helicases are classified into six superfamilies (SF) based on amino acid patterns and the presence of helicase motifs. SF1 and SF2 are the largest of all superfamilies and have similar conserved motifs.2,7 Xeroderma pigmentosum group B (XPB) is an adenosine triphosphate (ATP) dependent 3′–5′ DNA helicase belonging to SF2. It is an essential helicase involved in both DNA repair and transcription.8,9 In DNA repair, XPB participates in nucleotide excision repair (NER) by unwinding the DNA duplex around the DNA lesion. In transcription, XPB triggers the initiation of RNA polymerase II transcription by melting gene promoters.10,11 Mutations in XPB can lead to severe clinical disorders such as UV-hypersensitive syndromes xeroderma pigmentosum, Cockayne syndrome, and trichothio-dystrophy.12 The mechanisms of DNA unwinding by XPB helicases have been hypothesized based on biochemical and structural analysis,13–17 yet the significant characteristics of XPB binding and activity remains to be established. In this paper we use an electrochemical approach to investigate the kinetic and thermodynamic properties of three distinct XPB homologues from Sulfolobus tokodaii (StXPB1, StXPB2) and Archaeoglobus fulgidus (AfXPB) interacting with DNA and correlate these findings with helicase crystal structures reported in this work.
Electrophoresis mobility shift assays are used as a conventional method of helicase binding studies.8 While a powerful tool for understanding certain aspects of binding, this technique cannot follow real time changes, nor discern subtle intermediates of the unzipping process. Optical tweezer and magnetic tweezer techniques have been used to uncover a variety of features of single molecule binding,18,19 but remain a challenging approach to implement for broad study. A nanomechanical microcantilever approach has been used to quantitatively detect the presence of helicases.20 Fluorescence based optical detection methods have been used to follow helicase-dependent amplification of DNA (HDA).21 Techniques such as FRET and fluorescence quenching approaches have been used in the study of helicase unwinding.22,23 However, these techniques do not provide specific details on thermodynamics of helicase activity.
DNA electrochemistry is a facile, sensitive approach to follow DNA–protein interactions and DNA structural changes.24–29 DNA electrochemistry has been utilized in identifying single nucleotide polymorphisms,26,30–33 base lesions,34 protein binding, and enzymatic activity.31,35–39 One study has investigated the electrochemistry of DNA bound XPD helicases using DNA modified electrodes.40 It followed the electrochemistry of the [4Fe–4S] cluster of the helicase through the surface-bound DNA, finding that its accessibility increased upon ATP addition. The ATP-dependent redox signal from the [4Fe–4S] cluster was also found to be sensitive to mutations of the helicase.
In this work, to follow the DNA–helicase binding and activity, we utilized DNA electrochemistry on multiplexed chips to recognize these events through changes in charge transport reactions through DNA. Helicase concentration dependence, changes in DNA duplex stability upon helicase binding, and ATP-stimulated helicase unwinding are followed. These studies are facilitated by the extreme sensitivity of DNA electrochemistry to disruption of DNA base pairing.
EXPERIMENTAL SECTION
Protein Expression and Purification
AfXPB was expressed via published protocols.8 Protein purification involved resuspension in buffer A (50 mM TrisCl pH 7.5, 500 mM NaCl, 5% glycerol), lysis by sonication, and heat-denaturation at ∼65 °C for 15 min. Following centrifugation, the supernatant was brought to 30 mM imidazole with buffer B (lysis buffer supplemented with 200 mM imidazole) and loaded onto a 5 mL HisTrap column (GE) equilibrated in buffer A. The column was washed with buffer A supplemented with 50 mM imidazole, then eluted in buffer B. Peak fractions were combined and concentrated, then loaded onto a Sephacryl S200 gel filtration column (GE) equilibrated in buffer C (10 mM TrisCl pH 7.5, 500 mM NaCl, 5% glycerol). Peak fractions were combined, concentrated, frozen in liquid nitrogen, and stored at −80 °C.
StXPB2 expression followed published protocols.41 Protein purification was carried out essentially as for AfXPB. The HisTrap column peak elution fractions were combined and diluted 1:1 with buffer D (10 mM MES pH 6, 200 mM NaCl). The sample was then loaded onto a 5 mL HiTrap SP column (GE) equilibrated in buffer D, washed with buffer D, and eluted in buffer E (10 mM MES pH 6, 1000 mM NaCl). Peak elution fractions were combined, concentrated, and loaded onto a Sephacryl S200 gel filtration column (GE) equilibrated in buffer C. Peak fractions were combined, concentrated, frozen in liquid nitrogen, and stored at −80 °C.
StXPB1 was expressed via published protocols.41 Cell lysis was carried out essentially as for AfXPB. Protein in the heat-denatured supernatant was precipitated with ammonium sulfate salt to 50% saturation. The precipitated protein was resuspended in buffer D, dialyzed for 3 h to remove the ammonium sulfate, and filtered. The filtrate was loaded onto a 5 mL HiTrap SP column equilibrated in buffer D. The column was washed with buffer D, followed by elution in buffer E. Peak fractions were combined, concentrated, frozen in liquid nitrogen, and stored at −80 °C.
Helicase samples for electrochemistry studies were thawed and passed through a PD10 column (GE) for buffer exchange into 10 mM TrisCl pH 8, 200 mM NaCl, 10 mM MgCl2. Protein concentrations were determined by absorbance measurements at 280 nm (AfXPB: 4.4 μM, StXPB1: 32 μM, StXPB2: 29 μM) prior to freezing in liquid nitrogen and shipment on dry ice.
Synthesis of DNA
Double-stranded DNA was prepared using the 17mer sequence 3′-CTCTATATTTCGTGCGTNB-5′ and its fully complementary sequence 5′-(C6 thiol)-GAGA-TATAAAGCACGCA-3′. TNB denotes the position of the thymine modified with a Nile Blue redox probe. The DNA modified with the Nile blue (NB) precursor base, a 5-[3-acrylate NHS ester] deoxyuridine phosphoramidite from Glen Research, was purchased from Trilink BioTechnologies. The dye was covalently coupled under ultramild conditions according to established procedures.37 In addition, the thiolated sequence 5′-(C6 thiol)-GAGATACAAAGCACGCA-3′ was prepared as a mismatch sequence, where C locates the position of a single base pair mismatch when paired with the Nile blue modified strand above. Thiolated DNA sequences were obtained from Integrated DNA Technologies (IDT). The thiol linker was the Glen Research thiol-modifier C6 S–S phosphoramidite.
Purification of DNA
All oligonucleotides were purified via two rounds of high performance liquid chromatography (HPLC) on a Shimadzu LC-20AD instrument outfitted with an SIL-20A autosampler and an SPD-M20A diode array detector. In the first purification round, DNA oligonucleotides with the 4,4′-dimethoxytrityl group on were eluted on a gradient that was evolved from 5% acetonitrile and 95% 50 mM ammonium acetate, pH = 8 buffer to 75% acetonitrile and 25% 50 mM ammonium acetate, pH = 8 buffer over 30 min. In the second purification round, DNA oligonucleotides with the 4,4′-dimethoxytrityl group off were eluted on a gradient that was evolved from 5% acetonitrile and 95% 50 mM ammonium acetate, pH = 8 buffer to 15% acetonitrile and 85% 50 mM ammonium acetate, pH = 8 buffer over the first 35 min; from 15% acetonitrile and 85% 50 mM ammonium acetate, pH = 8 buffer to 50% acetonitrile and 50% 50 mM ammonium acetate, pH = 8 buffer over the next 5 min; and finally, held constant at 50% acetonitrile for another 5 min. The identity of the desired products was confirmed by matrix assisted laser desorption ionization time-of-flight mass spectrometry (MALDI-TOF) on a Shimadzu Axima Confidence mass spectrometer.
Preparation of the Double-Stranded DNA
The oligonucleotides were quantified via UV–visible spectroscopy on a Beckman DU-800 UV–visible spectrophotometer. This instrument was also used for melting temperature analysis. Duplex DNA was prepared by mixing equimolar amounts of complementary strands and annealing the solution to 95 °C, followed by slow cooling to room temperature over a period of 90 min. The formation of duplex DNA was verified by temperature dependent absorbance measurements and melting temperature analysis (see Figures 3c,e). These UV–visible absorbance measurements were performed on a Beckman DU-800 spectrophotometer with kinetics package, high performance temperature controller, six-cell microcell temperature module, and TM software analysis package. Melting temperature analysis was performed with a start temperature of 15.0 °C, a delay of 5.0 min, a ramp rate of 0.5 °C/min, a read interval of 0.5 °C, and a read average time of 0.5 s.
Figure 3.
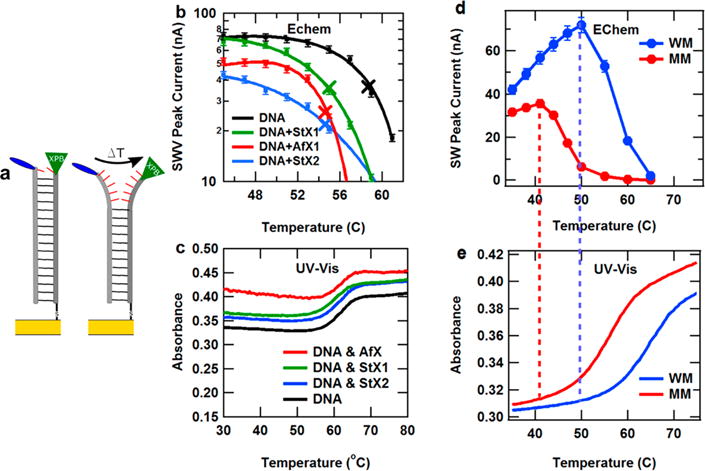
Dehybridization of DNA strands with and without XPB measured by DNA electrochemistry and UV–visible spectrophotometry at different temperatures. Error bars represent uncertainty in the SWV peak current measurements. (a) Illustration of temperature induced DNA dehybridization of helicase-bound DNA strands on a gold electrode surface. (b) SWV peak height vs temperature for DNA monolayers with and without helicase binding. The melting temperatures of each DNA sample changed significantly upon the binding of XPB helicases. Lines are polynomial fits to the data, and × notes the recorded melting transitions. (c) UV–visible absorbance at 260 nm vs temperature showing DNA duplex melting with and without helicases. (d) SWV peak current vs temperature for fully well matched (WM) and a similar monolayer containing a single C–A base pair mismatch (MM). (e) UV–visible absorbance at 260 nm vs temperature for WM and MM duplexes. The drop in electrochemical signal for each monolayer correlates with the onset of UV–vis melting of the duplex.
Fabrication of Devices
The chips/substrates featuring multiplexed gold electrodes for DNA self-assembly and electrochemical experiments were prepared as previously described.26,29 In brief, 1 mm thick Si wafers featuring a 10000 Å thick oxide layer (Silicon Quest, Inc.) were patterned via a two-layer process. For the first layer, the gold electrodes were deposited by a lift-off technique. Initially, the wafers were cleaned thoroughly in 1165 Remover (Microchem, Inc.) to remove organic impurities. SPR 220 3.0 photoresist (Microchem, Inc.) was then spin-cast at 3000 rpm onto the wafers and baked. The photoresist was in turn patterned with a Karl Suss MA6 contact aligner and a chrome photomask. Following postexposure baking, the wafers were developed in AZ 300 MIF developer for 1 min and rinsed thoroughly with deionized water. A 100 Å Ti adhesion layer and a 1000 Å Au layer were deposited onto the wafers via electron beam physical vapor deposition. The wafers were then immersed in Remover PG (Microchem, Inc.) overnight and sonicated to complete metal lift-off. Subsequently, the wafers were baked again and cleaned by UV ozone treatment. For the second layer, SU-8 2002 photoresist was spin-cast onto the wafers at 3000 rpm, baked, and photopatterned as an insulator, thereby isolating the exposed gold working electrode areas from the contact pads. The wafers were then developed in SU-8 Developer (Microchem, Inc.) for 1 min and baked to permanently set the photoresist. Finally, the completed wafers were diced into 1 in. by 1 in. chips by hand with a diamond scribe and stored under vacuum. The resulting multiplexed electrodes allowed for the self-assembly of four distinct DNA monolayers, each with 4-fold redundancy, on a single chip/substrate, facilitating direct, unambiguous comparisons between different DNA monolayers.
Self-Assembly of DNA Monolayers
The DNA monolayers were self-assembled onto gold electrode pads from a solution with 25 μM of the duplex DNA, 5 mM phosphate, 50 mM sodium chloride, pH = 7 buffer solution over a period of 12 to 18 h. The substrates were backfilled with mercaptohexanol for 1 h to remove nonspecifically bound DNA and then thoroughly rinsed with buffer to remove residual mercaptohexanol.
Electrochemical Measurements on DNA Monolayers
The multiplexed substrates were placed in a custom mount and connected to electrochemical testing hardware (a CH Instruments CHI750D Electrochemical Analyzer and a CHI 684 Multiplexer). Square wave voltammetry was generally performed at 40 Hz with a 0.025 mV amplitude and 4 mV increment. The electrochemical measurements were performed in pH 7.9 buffer containing 50 mM NaCl, 10 mM Tris-HCl, 10 mM MgCl2, and 4 mM spermidine. For experiments requiring temperature variation, the entire mount was placed in a custom copper enclosure and measured in a recirculating water bath, as previously described and shown in the Supporting Information.27–29 Electrochemical melting temperature analysis was performed with a start temperature of ∼20 °C. Temperature was raised at a rate of 0.5 °C/min, and a 5 min equilibration interval was observed before signal recording to maintain consistency with UV–visible absorbance measurements.
Crystallization, Data Collection, and Structure Determination
6xHis-StoXPB2 (15 mg/mL) was crystallized by vapor diffusion at room temperature in a 1:1 ratio of protein with reservoir solution containing 10 mM sodium citrate, Ph 5.6, and 1770 mM ammonium sulfate. Crystals were serially washed in a reservoir solution sequentially with 5%, 10%, and 15% glycerol prior to flash freezing in a 100 K nitrogen stream.
Diffraction data sets were collected at the Advanced Light Source (beamline 12.3.1). Data collection was carried out at 100 K with 1.0 Å wavelength radiation. Data sets were indexed and integrated with Mosfilm,42 and scaled and merged with Aimless.43 The structure was solved by molecular replacement with PHASER44 using the A. fulgidus XPB N-terminal and C-terminal halves (PDB: 2FZ4 and 2FZL, respectively). The model was refined with REFMAC545 and PHENIX REFINE.46 Numerical results are presented in Supporting Information, Table 1.
Access Number
The structural factors and coordinates of StXPB2 have been deposited in the Protein Data Bank with access code 5TNU.
RESULTS
DNA Electrochemistry for Helicase Activity
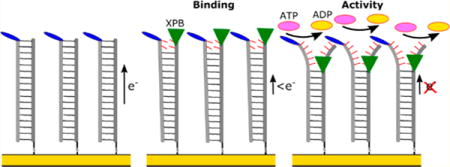
To follow helicase DNA binding and unwinding activity, DNA-based electrochemical devices were used to recognize these events through changes in charge transport reactions (Figure 1). In these devices, DNA is bound to the electrodes on chips, and the charge transport through the bases of the DNA monolayers is recorded by a redox active probe attached to the top of DNA.24–26 The DNA bases provide a π-stacked network of molecular orbitals, effectively bridging the transport reaction between the redox probe and the surface. Disruption of the ordering of the bases lowers the charge transport signal recorded by voltammetry. Helicase binding induces a disruption of the bases that lowers the voltammetric peaks observed, while ATP-stimulated unzipping breaks the hydrogen bonding between strands, further reducing the signal. Under this arrangement, XPB DNA binding and unwinding activity can be observed through a change in square wave voltammetry (SWV). Kinetic and thermodynamic properties of DNA–helicase interactions were derived from temperature dependent and helicase concentration dependent signal changes in square wave peak height.
Figure 1.
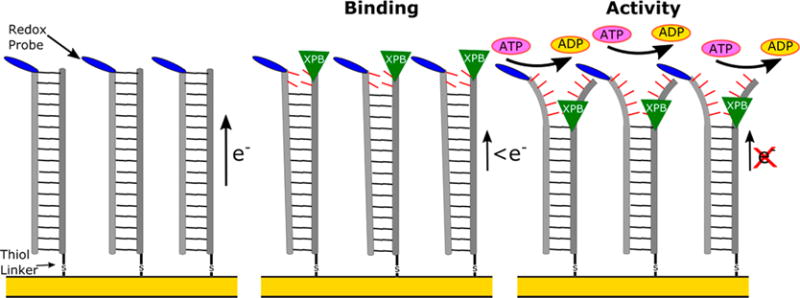
Illustration of the concept of utilizing DNA electrochemistry to follow the binding and ATP-catalyzed unzipping activity of helicases such as XPB.
Investigation of Thermodynamic Properties of XPB Bound DNA
Subsequently, we utilized DNA electrochemistry to understand the changes in DNA thermodynamics upon binding of helicases. Helicases are introduced to probe-modified DNA on chips at room temperature, and DNA–helicase binding disrupts the π-stacked bases of DNA. This disruption of bases also changes the free energy of the DNA duplex, which can be discerned through a shift of the melting temperature of the duplex, the temperature at which the DNA favorably splits into two single strands. Figure 2a shows the room temperature behavior of the SWV signal (60 Hz) before and after 10 nM StXPB2 helicase is introduced to the DNA device. Subsequently, the temperature is raised, and the voltammetry peak height increases up to a threshold temperature (Figure 2b). We have previously demonstrated this to follow Arrhenius-type thermally activated charge transport consistent with charge hopping.27,28 Beyond this threshold, the Nile Blue redox signal shows a dramatic decrease in peak height with temperature increase due to the onset of melting of the duplex (Figure 2c). Upon melting, the Nile Blue modified strand is no longer fully hybridized to the complementary strand anchored to the electrode surface, and the signal is lost. Figure 2d shows that the SWV peak current is easily distinguishable between StXPB2-bound DNA and free DNA at 60 °C, a difference due to helicase-induced changes in duplex stability.
Figure 2.

SWV of DNA monolayers under various temperature conditions with and without StXPB2. (a) Room temperature SWV before and after addition of StXPB2. (b) SWV upon heating from 31 to 43 °C. (c) SWV upon heating from 49 to 65 °C. The loss of signal in this regime corresponds to dehybridization of the DNA. (d) 60 °C SWV of DNA monolayers with and without addition of StXPB2.
We subsequently measured this melting behavior across three helicases, as well as unbound DNA, and recorded the results in Figure 3. Figure 3a illustrates the concept of the measurement that overall duplex stability is lowered upon helicase binding and that raising the temperature eventually melts the duplex. Figure 3b shows a plot of SWV peak height versus temperature for three different helicases bound to DNA modified electrodes, as well as a DNA-modified electrode maintained free of helicase. This graph is focused on the temperature region near the onset of DNA melting. Figure 3c shows the UV–vis absorption versus temperature for each of these four monolayers, the conventional measure of DNA melting temperature. The absorption signal increases upon DNA melting due to hyperchromicity, the higher absorption of UV light by two dissociated strands over two strands bound in a duplex. Upon close inspection, the conventional UV–vis measurement did not show any clear trend of change in the melting temperature (TM) with helicase binding. Repeated measurements of the UV–vis melting curves showed TM = 61.0 ± 1.0, 61.2 ± 1.2, 60.7 ± 0.2, and 61.0 ± 1.0 °C for DNA only and DNA with StXPB1, StXPB2, or AfXPB, respectively. However, Figure 3b clearly illustrates how the melting temperature changes upon binding of each XPB helicase, which is observed through our DNA devices by the shift in the temperature for the lowering of the voltammetry peak. Defining the electrochemically measured melting transition as the interpolated point at which the SWV signal drops to half of its maximum, the changes in DNA melting temperatures upon helicase binding were found to be −3.7 °C for StXPB1 and −4.1 °C for StXPB2 and AfXPB.
Along these lines, we believe these electrochemical devices offer a superior view into the specifics of DNA structural changes. To understand the differences between electrochemical and photophysical measurements, we present two additional experiments in Figure 3. In Figure 3d, we show the SWV peak current versus temperature for two DNA sequences, one fully matched 17mer duplex and a similar 17mer duplex having one base changed to introduce a C–A mismatch. In Figure 3e, we show the UV–vis absorption at 260 nm versus temperature from these two strands. The midpoint of this transition, the conventional DNA melting temperature, is the point at which the duplex and the single strand forms of the DNA are in equal concentration. In the SWV measurement, a dramatic loss of peak current is also seen near the UV–vis melting temperature. Upon close inspection, the onset of this exponential signal loss begins just as the UV–vis measurement begins to increase. This indicates that the SWV electrochemical signal is highly sensitive to the splitting of base pairing. That is, the initiation of the loss of base pairing causes a rapid drop in the SWV peak signal. Thus, the SWV signal serves as a highly sensitive beacon for changes in DNA structure, particularly loss of base pairing. We have leveraged this sensitivity here to study the destabilization of DNA by XPB helicase binding and unwinding.
The comparison of electrochemical and spectroscopic melting transitions in Figure 3 indicates that the electrochemistry measurement is sensitive to the onset of the dissociation of a few base pairs, whereas the spectroscopy measurement follows the fully dissociative dehybridization of the strands. So care must be taken in the interpretation of each. Nonetheless, if we assume that the change in the electrochemically measured melting temperature upon helicase binding is similar to a change in the complete melting temperature ΔTM, we can calculate a change in the Gibbs energy ΔG of the melting transition upon helicase binding as
| (1) |
where R is the gas constant and [C] is the concentration of the duplex. The shift in Gibbs energy was calculated for each helicase bound DNA sample and found to be −0.45 kJ/mol for StXPB1 and −0.50 kJ/mol for StXPB2 and AfXPB. This is directly within the range anticipated for the breaking of a single AT base pair,47 which is precisely the base pair at the end of the duplex distal to the electrode and bearing the dye-modified thymine. So it appears that binding of these helicases causes an initial disruption consistent with the breaking of a single base pair, as illustrated in Figure 3a.
Investigation of XPB Binding and Concentration Dependence
The room temperature concentration dependence of AfXPB, StXPB1, and StXPB2 binding was followed by DNA electrochemistry consistent with Figure 1. Increasing concentrations of individual helicases were added to the DNA device system while carefully investigating the change in the SWV peak height from the Nile Blue redox probe. The SWV peak height decreased as increasing amounts of helicase were added to the chips, corresponding to disruption of the DNA structure causing loss of charge transport to the Nile Blue redox probe. The results are shown in Figure 4, which clearly show behavior associated with a helicase concentration-limited regime. That is, the sigmoidal curves are indicative of a system where binding is limited by the helicase concentration rather than a limit in surface-bound DNA concentration. These curves were clearly fit with simplified Langmuir binding isotherms48,49 of the form:
| (2) |
where S([H]) is the square wave peak height signal at a concentration [H] of helicase, S0 is the initial square wave peak height, SB is the square wave background signal, and KD is the binding dissociation constant associated with the system. The dissociation constant of each helicase was calculated in this manner, and these values were found to be 22 ± 8 nM for AfXPB, 8 ± 2 nM for StXPB1, and 50 ± 10 nM for StXPB2. The KD values presented here vary significantly from those determined via electrophoretic mobility shift analysis (EMSA) of the S. tokodaii helicases with double stranded DNA, previously suggested to be 0.2–0.3 and 6 μM for StXPB1 and StXPB2, respectively.41,50 Our approach allows for greater accuracy via nonlinear regression analysis of quantitative data sets instead of semiquantitative “ocular” analysis of individual EMSA band shifts.
Figure 4.
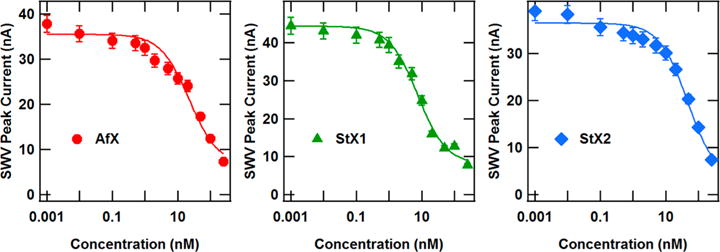
SWV peak current versus concentration for AfXPB, StXPB1, and StXPB2 proteins. Lines are fitted to the data according to a simplified Langmuir binding isotherm. Error bars represent uncertainty in the SWV peak current measurement. Measurements were taken at room temperature.
ATP Stimulated Activity of Helicases
Finally, we sought to understand the kinetics of DNA unwinding activity of helicases catalyzed by ATP hydrolysis with DNA electrochemistry. As illustrated in Figure 1, ATP hydrolysis drives the sequential breaking of hydrogen bonds between DNA, leading to dehybridization of the duplex. Concerning DNA electrochemistry, this will lower voltammetry signals by disrupting the bridge of π-stacked bases between the electrode surface and the redox probe. This electrochemical approach enables the measure of real time changes to the DNA induced by the helicases. Probe-modified DNA monolayers were prepared, and 10 nM of helicase were added and allowed to equilibrate in the absence of ATP. Figure 5 shows the SWV peak height versus time after 2 mM ATP addition to helicase-exposed DNA monolayers. In all cases, a monotonic loss of SWV peak height is observed in each case that can be fit with a simple exponential decay function, consistent with fluorescence studies of DNA/helicase ensembles.22,23 However, the StXPB1 and StXPB2 showed decay constants on the order of tens of minutes, consistent with ensemble fluorescence studies,22,23 while the AfXPB helicase showed a decay constant on the order of seconds. The different slow and fast decay functions of DNA destabilization displayed by StXPBs and AfXPB likely reveal the two modes of DNA unwinding by XPB helicases: the slow decay function of StXPBs reflects the conventional DNA unzipping with XPB translocating along the DNA while the fast decay function of AfXPB reflects the unique DNA unwinding fashion by XPB acting as the molecular wrench.14
Figure 5.
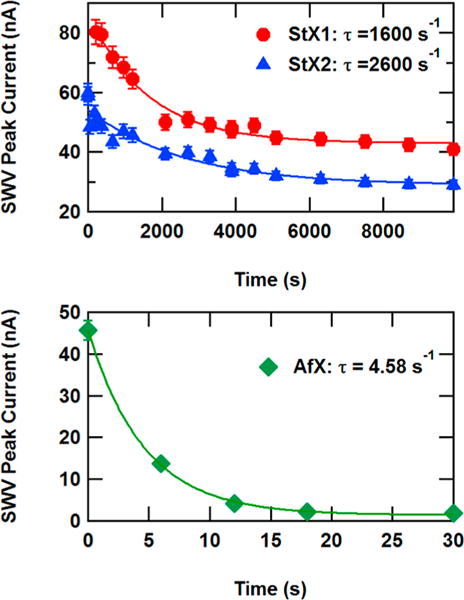
Square wave voltammetry (SWV) peak height vs time after ATP addition for DNA monolayers with 10 nM helicase binding and 2 mM adenosine triphosphate (ATP). Error bars represent uncertainty in the SWV peak current measurement.
To understand the nature of the two time scales revealed by electrochemical study, we present the crystal structures of StXPB2 and AfXPB in Figure 6. The crystal structure of AfXPB reveals a stable open conformation that requires a 170° rotation between the two helicase domains in order to form the active conformation with the ATP-binding groove closed (Figure 6b).14 However, we observed two StXPB2 structures in the crystal (Figure 6a), reflecting a much more flexible interdomain linker. Although both StXPB2 structures show an open conformation, they need only 80° and 50° domain rotation to form the closed conformation (Figure 6b), respectively. Because StXPB2 is not stable in the open conformation, we speculate that StXPB2 could form a closed conformation upon binding to DNA and act as a conventional helicase with ATP hydrolysis. Alternatively, the stable open structure of AfXPB suggests that it still stays in the open conformation after DNA binding. ATP binding to AfXPB induces domain rotation to form the closed conformation, leading to the molecular wrench action on the DNA that causes rapid opening and, hence, rapid loss of electrochemical signal in seconds. Both modes of duplex DNA opening by XPB are required for DNA repair: the molecular wrench mode is essential to initiate the opening of duplex DNA at the damage site, while the conventional DNA unzipping by XPB will facilitate the extension of the DNA bubble mainly mediated by XPD, another DNA helicase within the TFIIH complex. Our results demonstrate for the first time that XPB is a more powerful helicase in the molecular wrench mode than as a conventional helicase, in agreement with its biological role as the primary (likely the only) helicase to initiate duplex DNA opening at the damage site but a secondary helicase (in addition to XPD) to extend the DNA bubble for damage incision.
Figure 6.
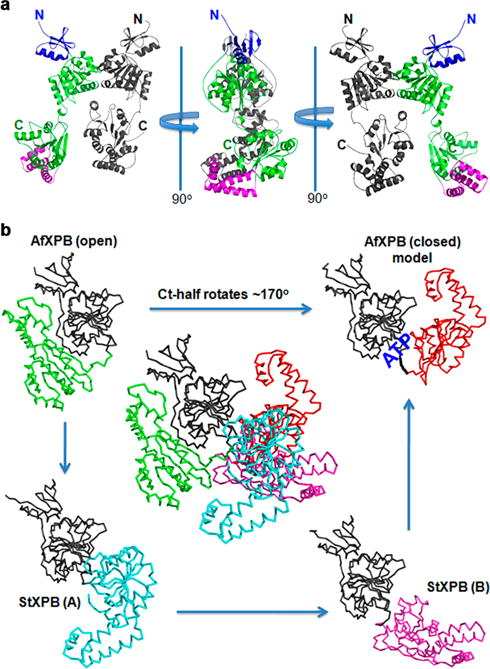
Crystal structures of StXPB2 reveal a much more flexible interdomain linker between the two helicase domains. (a) Two StXPB2 molecules are observed in the crystal: One is in gray and the other is colored as helicase domains in green, the damage recognition domain (DRD) is in blue and the thumb-like motif (ThM) domain colored purple. (b) Structural comparison of AfXPB and StXPB2. Center: AfXPB structure is superimposed with the two StXPB2 structures over the DRD and helicase domain1 (gray). The C-terminal halves are shown as indicated colors. The closed conformation is a computational model and ATP-binding groove is highlighted.
CONCLUSION
Here, we utilized DNA electrochemistry to characterize the dynamic DNA interactions with three XPB helicases. Our apparatus offers the high sensitivity of detecting DNA distortion caused by breaking the bond between a single base pair and reveals kinetic information to distinguish the two mechanisms regarding ATP-driven DNA duplex opening by XPB helicases. The slow and fast decay patterns obtained for dsDNA destabilization by XPB helicases in the presence of ATP provide mechanistic information correlated to XPB activities in the cells and XPB crystal structures. The capacity to follow electrochemical measurements of DNA–helicase interactions demonstrates the functionality of these devices to follow DNA–protein interactions to understand biological systems in general.
Supplementary Material
Acknowledgments
We thank the staff at the ALS beamline 12.3.1 for their assistance with X-ray diffraction data collection. This work was partially supported by NIH Grant R01GM108893 to L.F. and by a gift from Qorvo Inc. to J.D.S. The StXPB2 expression plasmid was a gift from Dr. Yulong Shen at Shangdong University, China.
Footnotes
Supporting Information
The Supporting Information is available free of charge on the ACS Publications website at DOI: 10.1021/acs.anal-chem.7b04515.
Crystallization data for 6xHis-StoXPB2, image of custom chip, images of custom temperature controlled electro-chemistry setup, and chemical drawings of DNA modifiers (PDF).
ORCID
Jason D. Slinker: 0000-0001-7338-586X
Notes
The authors declare no competing financial interest.
References
- 1.Raney KD. In: DNA Helicases and DNA Motor Proteins. Spies M, editor. Springer-Verlag; New York: 2013. pp. 17–49. [Google Scholar]
- 2.Gorbalenya AE, Koonin EV. Curr Opin Struct Biol. 1993;3:419–429. [Google Scholar]
- 3.Patel SS, Picha KM. Annu Rev Biochem. 2000;69:651–697. doi: 10.1146/annurev.biochem.69.1.651. [DOI] [PubMed] [Google Scholar]
- 4.Pyle AM. Annual Review of Biophysics. Vol. 37. Annual Reviews; Palo Alto: 2008. pp. 317–336. [DOI] [PubMed] [Google Scholar]
- 5.Singleton MR, Dillingham MS, Wigley DB. Annu Rev Biochem. 2007;76:23–50. doi: 10.1146/annurev.biochem.76.052305.115300. [DOI] [PubMed] [Google Scholar]
- 6.Lohman TM, Tomko EJ, Wu CG. Nat Rev Mol Cell Biol. 2008;9:391–401. doi: 10.1038/nrm2394. [DOI] [PubMed] [Google Scholar]
- 7.Fairman-Williams ME, Guenther UP, Jankowsky E. Curr Opin Struct Biol. 2010;20:313–324. doi: 10.1016/j.sbi.2010.03.011. [DOI] [PMC free article] [PubMed] [Google Scholar]
- 8.Fan L, Arvai AS, Cooper PK, Iwai S, Hanaoka F, Tainer JA. Mol Cell. 2006;22:27–37. doi: 10.1016/j.molcel.2006.02.017. [DOI] [PubMed] [Google Scholar]
- 9.Schultz P, Fribourg S, Poterszman A, Mallouh V, Moras D, Egly JM. Cell. 2000;102:599–607. doi: 10.1016/s0092-8674(00)00082-9. [DOI] [PubMed] [Google Scholar]
- 10.Schaeffer L, Roy R, Humbert S, Moncollin V, Vermeulen W, Hoeijmakers JHJ, Chambon P, Egly JM. Science. 1993;260:58–63. doi: 10.1126/science.8465201. [DOI] [PubMed] [Google Scholar]
- 11.Gillet LCJ, Scharer OD. Chem Rev. 2006;106:253–276. doi: 10.1021/cr040483f. [DOI] [PubMed] [Google Scholar]
- 12.DiGiovanna JJ, Kraemer KH. J Invest Dermatol. 2012;132:785–796. doi: 10.1038/jid.2011.426. [DOI] [PMC free article] [PubMed] [Google Scholar]
- 13.Fishburn J, Tomko E, Galburt E, Hahn S. Proc Natl Acad Sci U S A. 2015;112:3961–3966. doi: 10.1073/pnas.1417709112. [DOI] [PMC free article] [PubMed] [Google Scholar]
- 14.Fan L, DuPrez KT. Prog Biophys Mol Biol. 2015;117:174–181. doi: 10.1016/j.pbiomolbio.2014.12.005. [DOI] [PubMed] [Google Scholar]
- 15.He Y, Yan CL, Fang J, Inouye C, Tjian R, Ivanov I, Nogales E. Nature. 2016;533:359–365. doi: 10.1038/nature17970. [DOI] [PMC free article] [PubMed] [Google Scholar]
- 16.Rand MD, Grimm LM, Artavanis-Tsakonas S, Patriub V, Blacklow SC, Sklar J, Aster JC. Mol Cell Biol. 2000;20:1825–1835. doi: 10.1128/mcb.20.5.1825-1835.2000. [DOI] [PMC free article] [PubMed] [Google Scholar]
- 17.Kim TK, Ebright RH, Reinberg D. Science. 2000;288:1418–1421. doi: 10.1126/science.288.5470.1418. [DOI] [PubMed] [Google Scholar]
- 18.Sun B, Wang MD. Crit Rev Biochem Mol Biol. 2016;51:15–25. doi: 10.3109/10409238.2015.1102195. [DOI] [PubMed] [Google Scholar]
- 19.Johnson DS, Bai L, Smith BY, Patel SS, Wang MD. Cell. 2007;129:1299–1309. doi: 10.1016/j.cell.2007.04.038. [DOI] [PMC free article] [PubMed] [Google Scholar]
- 20.Hwang KS, Lee SM, Eom K, Lee JH, Lee YS, Park JH, Yoon DS, Kim TS. Biosens Bioelectron. 2007;23:459–465. doi: 10.1016/j.bios.2007.05.006. [DOI] [PubMed] [Google Scholar]
- 21.Vincent M, Xu Y, Kong HM. EMBO Rep. 2004;5:795–800. doi: 10.1038/sj.embor.7400200. [DOI] [PMC free article] [PubMed] [Google Scholar]
- 22.Tani H, Fujita O, Furuta A, Matsuda Y, Miyata R, Akimitsu N, Tanaka J, Tsuneda S, Sekiguchi Y, Noda N. Biochem Biophys Res Commun. 2010;393:131–136. doi: 10.1016/j.bbrc.2010.01.100. [DOI] [PubMed] [Google Scholar]
- 23.Jang H, Kim YK, Kwon HM, Yeo WS, Kim DE, Min DH. Angew Chem, Int Ed. 2010;49:5703–5707. doi: 10.1002/anie.201001332. [DOI] [PMC free article] [PubMed] [Google Scholar]
- 24.Drummond TG, Hill MG, Barton JK. J Am Chem Soc. 2004;126:15010–15011. doi: 10.1021/ja044910i. [DOI] [PubMed] [Google Scholar]
- 25.Gorodetsky AA, Buzzeo MC, Barton JK. Bioconjugate Chem. 2008;19:2285–2296. doi: 10.1021/bc8003149. [DOI] [PMC free article] [PubMed] [Google Scholar]
- 26.Slinker JD, Muren NB, Gorodetsky AA, Barton JK. J Am Chem Soc. 2010;132:2769–2774. doi: 10.1021/ja909915m. [DOI] [PMC free article] [PubMed] [Google Scholar]
- 27.Wohlgamuth CH, McWilliams MA, Slinker JD. Anal Chem. 2013;85:8634–8640. doi: 10.1021/ac401229q. [DOI] [PubMed] [Google Scholar]
- 28.Wohlgamuth CH, McWilliams MA, Slinker JD. Anal Chem. 2013;85:1462–1467. doi: 10.1021/ac302508f. [DOI] [PubMed] [Google Scholar]
- 29.McWilliams MA, Bhui R, Taylor DW, Slinker JD. J Am Chem Soc. 2015;137:11150–11155. doi: 10.1021/jacs.5b06604. [DOI] [PubMed] [Google Scholar]
- 30.Boon EM, Ceres DM, Drummond TG, Hill MG, Barton JK. Nat Biotechnol. 2000;18:1096–1100. doi: 10.1038/80301. [DOI] [PubMed] [Google Scholar]
- 31.Boal AK, Yavin E, Lukianova OA, O’Shea VL, David SS, Barton JK. Biochemistry. 2005;44:8397–8407. doi: 10.1021/bi047494n. [DOI] [PubMed] [Google Scholar]
- 32.Slinker JD, Muren NB, Renfrew SE, Barton JK. Nat Chem. 2011;3:228–233. doi: 10.1038/nchem.982. [DOI] [PMC free article] [PubMed] [Google Scholar]
- 33.Kelley SO, Boon EM, Barton JK, Jackson NM, Hill MG. Nucleic Acids Res. 1999;27:4830–4837. doi: 10.1093/nar/27.24.4830. [DOI] [PMC free article] [PubMed] [Google Scholar]
- 34.Boal AK, Barton JK. Bioconjugate Chem. 2005;16:312–321. doi: 10.1021/bc0497362. [DOI] [PubMed] [Google Scholar]
- 35.Boon EM, Salas JE, Barton JK. Nat Biotechnol. 2002;20:282–286. doi: 10.1038/nbt0302-282. [DOI] [PubMed] [Google Scholar]
- 36.Gorodetsky AA, Boal AK, Barton JK. J Am Chem Soc. 2006;128:12082–12083. doi: 10.1021/ja064784d. [DOI] [PubMed] [Google Scholar]
- 37.Gorodetsky AA, Ebrahim A, Barton JK. J Am Chem Soc. 2008;130:2924–2925. doi: 10.1021/ja7106756. [DOI] [PMC free article] [PubMed] [Google Scholar]
- 38.O’Brien E, Holt ME, Thompson MK, Salay LE, Ehlinger AC, Chazin WJ, Barton JK. Science. 2017;355:813. doi: 10.1126/science.aag1789. [DOI] [PMC free article] [PubMed] [Google Scholar]
- 39.Kahanda D, Chakrabarti G, Mcwilliams MA, Boothman DA, Slinker JD. Biosens Bioelectron. 2016;80:647–653. doi: 10.1016/j.bios.2016.02.026. [DOI] [PMC free article] [PubMed] [Google Scholar]
- 40.Mui TP, Fuss JO, Ishida JP, Tainer JA, Barton JK. J Am Chem Soc. 2011;133:16378–16381. doi: 10.1021/ja207222t. [DOI] [PMC free article] [PubMed] [Google Scholar]
- 41.Ma XQ, Hong Y, Han WY, Sheng DH, Ni JF, Hou GH, Shen YL. Extremophiles. 2011;15:67–76. doi: 10.1007/s00792-010-0338-z. [DOI] [PubMed] [Google Scholar]
- 42.Battye TGG, Kontogiannis L, Johnson O, Powell HR, Leslie AGW. Acta Crystallogr, Sect D: Biol Crystallogr. 2011;67:271–281. doi: 10.1107/S0907444910048675. [DOI] [PMC free article] [PubMed] [Google Scholar]
- 43.Evans P. Acta Crystallogr, Sect D: Biol Crystallogr. 2006;62:72–82. doi: 10.1107/S0907444905036693. [DOI] [PubMed] [Google Scholar]
- 44.McCoy AJ, Grosse-Kunstleve RW, Adams PD, Winn MD, Storoni LC, Read RJ. J Appl Crystallogr. 2007;40:658–674. doi: 10.1107/S0021889807021206. [DOI] [PMC free article] [PubMed] [Google Scholar]
- 45.Murshudov GN, Skubak P, Lebedev AA, Pannu NS, Steiner RA, Nicholls RA, Winn MD, Long F, Vagin AA. Acta Crystallogr, Sect D: Biol Crystallogr. 2011;67:355–367. doi: 10.1107/S0907444911001314. [DOI] [PMC free article] [PubMed] [Google Scholar]
- 46.Afonine PV, Grosse-Kunstleve RW, Echols N, Headd JJ, Moriarty NW, Mustyakimov M, Terwilliger TC, Urzhumtsev A, Zwart PH, Adams PD. Acta Crystallogr, Sect D: Biol Crystallogr. 2012;68:352–367. doi: 10.1107/S0907444912001308. [DOI] [PMC free article] [PubMed] [Google Scholar]
- 47.Protozanova E, Yakovchuk P, Frank-Kamenetskii MD. J Mol Biol. 2004;342:775–785. doi: 10.1016/j.jmb.2004.07.075. [DOI] [PubMed] [Google Scholar]
- 48.Esteban Fernandez de Avila B, Watkins HM, Pingarron JM, Plaxco KW, Palleschi G, Ricci F. Anal Chem. 2013;85:6593–6597. doi: 10.1021/ac4012123. [DOI] [PubMed] [Google Scholar]
- 49.van de Weert M, Stella L. J Mol Struct. 2011;998:144–150. [Google Scholar]
- 50.Richards JD, Cubeddu L, Roberts J, Luau HT, White MF. J Mol Biol. 2008;376:634–644. doi: 10.1016/j.jmb.2007.12.019. [DOI] [PubMed] [Google Scholar]
Associated Data
This section collects any data citations, data availability statements, or supplementary materials included in this article.


