

Abstract
The effects of five different microalgae-fungi on nutrient removal and CO2 removal were investigated under three different CO2 contents (35%, 45% and 55%). The results showed that the highest nutrient and CO2 removal efficiency were found at 55% CO2 by cocultivation of different microalgae and fungi. The effect of different initial CO2 concentration on the removal of CO2 from microalgae was significant, and the order of CO2 removal efficiency was 55% (v/v) >45% (v/v) >35% (v/v). The best nutrient removal and biogas purification could be achieved by co-cultivation of C. vulgaris and G. lucidum with 55% initial CO2 content. The maximum mean COD, TN, TP and CO2 removal efficiency can reach 68.29%, 61.75%, 64.21% and 64.68%, respectively under this condition. All highest COD, TN, TP and CO2 removal efficiency were more than 85%. The analysis of energy consumption economic efficiency revealed that this strategy resulted in the highest economic efficiency. The results of this work can promote simultaneously biological purification of wastewater and biogas using microalgal-fungal symbiosis.
Introduction
Recently, microalgae have been widely studied because of their metabolic versatility, capacity for carbon dioxide mitigation and potential applications in some areas such as wastewater treatment, and phytoremediation1–3. Especially, microalgae can serve as an economically and environmentally sustainable way to produce bioenergy through combining digestate decontamination and biogas purification with algal biomass production4,5. However, such new technical processes must be developed to capitalize on the economically feasible potential of accumulating bioproducts and biofuel inside microalgal biomass. For instance, the microalgal cell harvest from industrial cultivation for biofuel production, wastewater treatment or value-added chemicals cultivation has always been one of the major obstacles for the algae-to-fuel approach as requiring the addition of chemicals or excessive energy demand6,7. Up to now, all the available harvest approaches, including flocculation, flotation, centrifugal sedimentation, and filtration, have their own flaws and advantages, and usually accounts for 20–30% of the total costs of production8.
To resolve the major challenges facing microalgal biotechnology for harvesting, bio-flocculation has been previous performed by employing suitable microbial partner through algal-fungal interactions9–11. Apart from efficient harvesting of algae, co-flocculants can demonstrate their synergistic activity on total biomass, total oil production and wastewater treatment by recovering their primary nutrients, N and P, and microelements12. For fungal-microalgal interaction, the natural symbiosis between filamentous fungi and microalgae in the form of lichens has existed since plants evolved from green algae more than 400 million years ago and currently lichens cover 6% of the Earth’s land surface13. Co-cultivation of pellet forming filamentous fungi with microalgal biomass has been recently reported as efficient algal harvesting technique. Furthermore, pelletization is widely seen in the fungal fermentation process where the microorganisms are filamentous14–16. Even though, the detailed mechanisms of fungal-microalgal interactions remain unclear and not all filamentous fungal strains can form pellets during co-cultivations with microalgae.
CO2 accounts for nearly 25%–60% of the raw biogas and plays important role to simultaneously purify biogas and biogas slurry because it is used as a carbon source for the cultivation of microalgae/fungi/bacteria and converted to microalgae biomass in the presence of light by photosynthesis17. Meanwhile, other components of the raw biogas from anaerobic digestion is typically composed of CH4 (40%–75%), H2S (0.005%–2%), and H2, O2, or N2 at trace levels2,18 studied the biomass growth, nutrient removal, and biogas upgrading of green algae Chlorella sp. in a PBRb (photobioreactor bag) using LEDs (light emitting diodes) and revealed that the removal efficiency (RE) of the main nutrients were affected by the CO2 concentration and microalgal species, and concluded that the successful mitigation of CO2 and production of renewable energy (bioethanol, biogas, biodiesel, and biohydrogen) using microalgae require sorting of microalgae according to their growth rate, lipid content, and tolerance to high levels of CO2. Besides, most previous studies related to the cultivation of microalgae for the production of bioproducts or biodiesel and the upgrade of biogas have focused only on their growth and hydrocarbon/lipid/protein contents under low CO2 concentrations or ambient air19. Hence, it seems a significant hypothesis that appropriate selection of microalgal strains, algal-fungal and control of the influent CO2 concentration can achieve the optimal effect of nutrients removal and biogas upgrading.
Thus, this work focused on three objectives including: (1) appropriate selection of best fungal-microalgal interaction (i.e. P. geesteranus/C. vulgaris, G. lucidum/C. vulgaris, P. ostreatus/C. vulgaris, G. lucidum/S. obliquus and G. lucidum/S. capricornutum) for biogas slurry treatment with chemical oxygen demand (COD), nitrogen (N), phosphorus (P) and CO2 removal simultaneously. (2) the influence of three CO2 concentrations (35%, 45%, and 55%, v/v) in synthetic biogas on the nutrient removal from biogas slurry and CO2 removal from biogas were investigated. (3) the economic efficiency of biogas upgrading or biogas slurry nutrient removal was also evaluated according to removal efficiency, electric power charge, illumination time and LED electrical power consumption. These findings are essential for the effective design of crude biogas treatment systems, in order to address the demands of technology efficiency and environmental sustainability.
Results and Discussion
The five selected strains growth at different CO2 concentration
These five fungal-microalgal mixture strains survived all treatments. Table 1 shows the results of cell growth and average daily productivity of the selected five different fungal-microalgal mixture (i.e., P. geesteranus/C. vulgaris, G. lucidum/C. vulgaris, P. ostreatus/C. vulgaris, G. lucidum/S. obliquus and G. lucidum/S. capricornutum) under different CO2 concentration treatments (35%, 45% and 55%, v/v). From Table 1, it was concluded that the growth rates under 55% CO2 concentration treatment were higher than 45% and 35% CO2 concentration treatment. Probably reason is that biomass production of the fungal-microalgal mixture depends on CO2 consumption as the carbon source under phototropic condition20. This statement can also be supported by the results of the mean daily productivity data shown in Table 1. Notably, the growth rate and mean daily productivity under 55% CO2 concentration were recorded highest by G. lucidum/C. vulgaris mixture (0.352 d−1, 0.174 gL−1d−1), follow by G. lucidum/S. obliquus, P. geesteranus/C. vulgaris, P. ostreatus/C. vulgaris and G. lucidum/S. capricornutum. Hence, high CO2 concentration (55%, v/v) was chosen as the most effective treatment and G. lucidum/C. vulgaris strain can be ranked as the optimal fungal-microalgal mixture according to its high biomass production.
Table 1.
Growth rates and mean daily productivity of the five selected strains under different CO2 concentration treatments.
| The selected strains/CO2 concentration | CO2 35% (v/v) | CO2 45% (v/v) | CO2 55% (v/v) |
|---|---|---|---|
| Growth rate d−1 | |||
| P. geesteranus/C. vulgaris | 0.268 ± 0.05 | 0.292 ± 0.06 | 0.308 ± 0.06 |
| G. lucidum/C. vulgaris | 0.309 ± 0.06 | 0.336 ± 0.07 | 0.352 ± 0.06 |
| P. ostreatus/C. vulgaris | 0.241 ± 0.05 | 0.271 ± 0.07 | 0.287 ± 0.05 |
| G. lucidum/S. obliquus | 0.296 ± 0.05 | 0.314 ± 0.06 | 0.321 ± 0.07 |
| G. lucidum/S. capricornutum | 0.229 ± 0.04 | 0.255 ± 0.05 | 0.273 ± 0.05 |
| Mean daily productivity(gL−1 d−1) | |||
| P. geesteranus/C. vulgaris | 0.106 ± 0.006 | 0.115 ± 0.012 | 0.131 ± 0.006 |
| G. lucidum/C. vulgaris | 0.132 ± 0.007 | 0.153 ± 0.014 | 0.174 ± 0.008 |
| P. ostreatus/C. vulgaris | 0.094 ± 0.005 | 0.105 ± 0.009 | 0.112 ± 0.006 |
| G. lucidum/S. obliquus | 0.118 ± 0.007 | 0.132 ± 0.011 | 0.153 ± 0.007 |
| G. lucidum/S. capricornutum | 0.081 ± 0.006 | 0.098 ± 0.008 | 0.107 ± 0.006 |
However, what were the possible reasons that G. lucidum/C. vulgaris co-cultivation mixture was superior to the other four similar mixtures? Firstly, biomass production ability of microalgae strain C. vulgaris was relatively high than some other microalgae based on previous studies21–25. For example, Zhao et al.21,23 reported that the growth rate and mean daily productivity of high-yield strain C. vulgaris can reach 0.363 d−1 and 0.112 g L−1 d−1 with optimal wavelength mixing ratios treatments, and reach 0.372 d−1 and 0.183 g L−1 d−1 with treatment of synthetic high-strength wastewater21,23. Secondly, based on the molecular mechanism of filamentous fungal-based bio-flocculation, fungal cell capacity for self-pelletization may be significantly different as it is strain-specific and not all filamentous fungal strains can form pellets during growth26. In this study, after co-cultivation, green-colored pellets were found by interaction between fungal strain G. lucidum and microalgal strain C. vulgaris, instead of milky white-colored pellets like other four fungal-microalgal mixture, which indicate that pelletization capacity of G. lucidum/C. vulgaris mixture was relatively strong. It is unavoidable to form biofilm on the wall of reactor, the final treatment efficiencies will be affected by some parameters such as the decreased illumination intensity or shortage of nutrient27. However, according to our experiences28,29, algal-fungal symbionts achieved relatively high biomass for 10 days and the removal efficiencies of pollutants decreased after 10 days, which will lead to poor economic efficiency if last for a longer period of cultivation time.
For P. geesteranus/C. vulgaris, and P. ostreatus/C. vulgaris mixtures, simple adherence or entrapment mode was found for the interaction between microalgal cells and the fungal pellets30. Likewise, Linder31 reported that fungal cell capacity for self-pelletization was correlated to the accumulation of a family of low molecular weight amphipathic, hydrophobic proteins accumulated on the hyphal surface31. These hydrophobic proteins are potentially involved in hyphae adherence to solid substrates32. Thirdly, pH was the key factor affecting formation of fungal-algal pellet15,20. For G. lucidum/C.vulgaris mixture under 55% CO2 concentration treatment in the experiment, final pH value was 7.16 after 10 days co-cultivation period, which is slightly high than the other four fungal-microalgal mixtures. Therefore, enhanced solubility of CO2 in the alkalescent biogas slurry was found, which act as the carbon source in the nutrient solution. It is similar to the previous conclusion that pH serviced as the key factor to induce the pelletization of M. circillenous alone33. Likewise, Liu et al.34 used pH adjustment to induce the formation of fungal cell pelletization, providing a simplified method by which to facilitate the cell harvest of oleaginous cells34.
Nutrient removal efficiencies at different CO2 concentration
Based on Table 1, a considerably high average COD remove efficiency (55.72%–68.29%) was achieved with 55% CO2 concentration treatment, followed by 54.26%–66.29% and 46.62%–60.52% with 45% and 35% CO2 concentration treatments. This variation trend can further confirmed the conclusion that organic carbon is the basic ingredient of microalgae, which accounts for about half of microalgal biomass and can be utilize for heterotrophic or mixotrophic growth35–37. In this study, under 55% CO2 concentration treatment, the five fungal-microalgal strains grown at autotrophic and heterotrophic conditions using CO2 as the only carbon source. Besides, the corresponding average COD remove efficiency ranked: G. lucidum/C. vulgaris (68.29%) > P. geesteranus/C. vulgaris (63.92%) > P. ostreatus/C. vulgaris (62.45%) > G. lucidum/S. obliquus (59.17%) > G. lucidum/S. capricornutum (55.72%). Furthermore, Fig. 1 depicts the changes in COD removal during 10 days of the experimental period and maximum COD removal efficiency even reached 87.37% by G. lucidum/C. vulgaris, which is slightly high than most previous report conclusions. For instance, Zhao et al.38 demonstrated that the highest COD removal efficiency can reach 85.35%38. Similarly, Yan and Zheng18,39 carried out series researches and reported that 86% of COD could be removed by Chlorella sp. within 24 h with optimal photoperiods, while 78.9% with optimal mixed wavelength ratio (red:blue = 5:5)18,39. These different results are closely related to different influent CO2 concentrations, photoperiod of the experiment. Besides, all the results imply that the screening of microalgal, fungal and fungal-microalgal strains is effective to reduce the COD in biogas slurry.
Figure 1.

COD removal efficiency with time under different CO2 concentrations for the five selected microalgal-fungal strains: (A) 35% (v/v) CO2, (B) 45% (v/v) CO2, and (C) 55% (v/v) CO2.
According to Table 2, TN in the biogas slurry was removed by the five fungal-microalgal strains significantly under the three CO2 concentration treatments. But the TN removal efficiencies were a little different during 10 days experimental schedule as displayed in Fig. 2. The highest average TN remove efficiency was obtained under 55% CO2 concentration treatment for the five fungal-microalgal mixtures containing P. geesteranus/C. vulgaris, G. lucidum/C. vulgaris, P.ostreatus/C. vulgaris, G. lucidum/S. obliquus and G. lucidum/S. capricornutum, reaching 54.07%, 61.75%, 51.32%, 63.93% and 59.83%, respectively. Especially, the mixed culture containing G. lucidum/S. obliquus demonstrated highest N removal efficiency, while P.ostreatus/C. vulgaris showed relatively low TN removal efficiency. Coincidentally, it showed very consistent with previous reported conclusion that the highest TN remove efficiency was obtained for the bacterial-microalgal mixture containing C. vulgaris, S. obliquus, and N.oleoabundans, reaching 61.49%, 63.13%, and 55.26%, respectively2. In addition, Zhao et al.21 also recommended that S.obliquus can contribute to a high nitrogen RE than C. vulgaris or N. oleoabundans and nitrogen RE even reached 76% given appropriate mixed ratio of wavelength (red:blue = 7:3)21. Xu et al.40 investigated an integrated approach that combined freshwater microalgae Scenedesmus obliquus cultivation with piggery anaerobic digestate liquid treatment and revealed that average nitrogen RE was 58.39–74.63%40. Assimilation within microalgal biomass may be the key mechanism of nitrogen removal because reproduction of fungal/microalgal need sufficient nitrogen source to produce nucleic acids41.
Table 2.
Average removal and the economic efficiency of biogas CO2 and biogas slurry nutrient reduction under the three CO2 concentrations.
| Five strains/CO2 concentration treatments | Removal efficiency (%) | Economic efficiency (USD−1) | ||||||
|---|---|---|---|---|---|---|---|---|
| COD | TN | TP | CO2 | COD | TN | TP | CO2 | |
| CO2 35% (v/v) | ||||||||
| P. geesteranus/C. vulgaris | 57.37 ± 4.02a | 48.53 ± 4.24b | 51.29 ± 3.62b | 54.15 ± 4.12a | 29.56 ± 1.92ab | 20.25 ± 1.75b | 27.35 ± 2.16b | 26. 35 ± 2.34a |
| G. lucidum/C. vulgaris | 60.52 ± 4.71a | 58.15 ± 4.79a | 59.37 ± 4.16a | 57.18 ± 4.33a | 31.24 ± 2.21a | 29.98 ± 2.04a | 30.34 ± 2.35a | 28.19 ± 2.57a |
| P. ostreatus/C. vulgaris | 51.72 ± 3.65b | 46.84 ± 3.22bc | 49.35 ± 3.25b | 49.22 ± 3.68b | 27.96 ± 2.06b | 19.41 ± 1.62b | 21.32 ± 1.73c | 22.68 ± 1.91b |
| G. lucidum/S. obliquus | 50.53 ± 3.24b | 59.71 ± 4.83a | 57.64 ± 4.37a | 47.43 ± 3.95b | 26.35 ± 1.88b | 30.67 ± 2.13a | 28.51 ± 2.24ab | 20.54 ± 1.79b |
| G. lucidum/S. capricornutum | 46.62 ± 3.59c | 44.45 ± 3.06c | 58.08 ± 4.69a | 43.36 ± 3.56c | 19.25 ± 1.27c | 18.02 ± 1.45b | 28.98 ± 2.62ab | 17.44 ± 1.35c |
| CO2 45% (v/v) | ||||||||
| P. geesteranus/C. vulgaris | 61.92 ± 4.13b | 52.01 ± 4.39c | 54.07 ± 4.37b | 59.26 ± 4.64b | 32.45 ± 2.73b | 28.12 ± 2.63ab | 29.26 ± 2.19b | 30. 91 ± 2.68a |
| G. lucidum/C. vulgaris | 66.29 ± 4.27a | 59.78 ± 4.68b | 61.75 ± 4.23a | 63.07 ± 5.12a | 35.87 ± 2.98a | 30.86 ± 2.79ab | 32.81 ± 2.31a | 32.76 ± 2.84a |
| P. ostreatus/C. vulgaris | 60.51 ± 3.84b | 49.56 ± 4.13cd | 51.32 ± 4.15bc | 58.04 ± 4.39b | 31.13 ± 2.34b | 21.37 ± 1.75d | 27.26 ± 2.12bc | 29.91 ± 2.12ab |
| G. lucidum/S. obliquus | 55.76 ± 3.92c | 62.26 ± 5.02a | 63.91 ± 5.07a | 52.47 ± 4.61c | 28.37 ± 2.43bc | 32.61 ± 2.33a | 33.19 ± 2.37a | 28.39 ± 2.04b |
| G. lucidum/S. capricornutum | 54.26 ± 3.78c | 48.18 ± 3.96d | 49.83 ± 3.91c | 51.61 ± 4.48c | 27.18 ± 2.06c | 24.83 ± 2.02c | 25.35 ± 2.18c | 27.25 ± 2.27b |
| CO2 55% (v/v) | ||||||||
| P. geesteranus/C. vulgaris | 63.92 ± 5.02b | 54.07 ± 4.37b | 56.29 ± 4.32b | 60.83 ± 5.34b | 33.04 ± 2.35b | 26.79 ± 2.15b | 28.14 ± 2.01b | 31.84 ± 2.63ab |
| G. lucidum/C. vulgaris | 68.29 ± 4.73a | 61.75 ± 4.68a | 64.21 ± 5.36a | 64.68 ± 5.61a | 37.17 ± 2.93a | 32.21 ± 2.54a | 34.05 ± 2.62a | 34.19 ± 2.71a |
| P. ostreatus/C. vulgaris | 62.45 ± 4.57bc | 51.32 ± 4.05b | 53.74 ± 4.41bc | 58.53 ± 4.87bc | 32.86 ± 2.56b | 26.83 ± 2.19b | 28.71 ± 2.13b | 29.34 ± 2.26bc |
| G. lucidum/S. obliquus | 59.17 ± 4.16c | 63.93 ± 5.13a | 61.98 ± 5.34a | 55.62 ± 4.63cd | 30.73 ± 2.88b | 33.34 ± 2.78a | 32.87 ± 2.66a | 27.63 ± 2.11c |
| G. lucidum/S. capricornutum | 55.72 ± 4.02bc | 59.83 ± 5.04a | 52.29 ± 4.79c | 54.84 ± 3.99d | 27.85 ± 2.29c | 31.18 ± 2.71a | 28.67 ± 2.35b | 27.59 ± 2.38c |
Note: Values with different superscript letters demonstrate a significant difference at level of p < 0.05 for the same CO2 concentration according to the Duncan’s multiple range tests.
Figure 2.
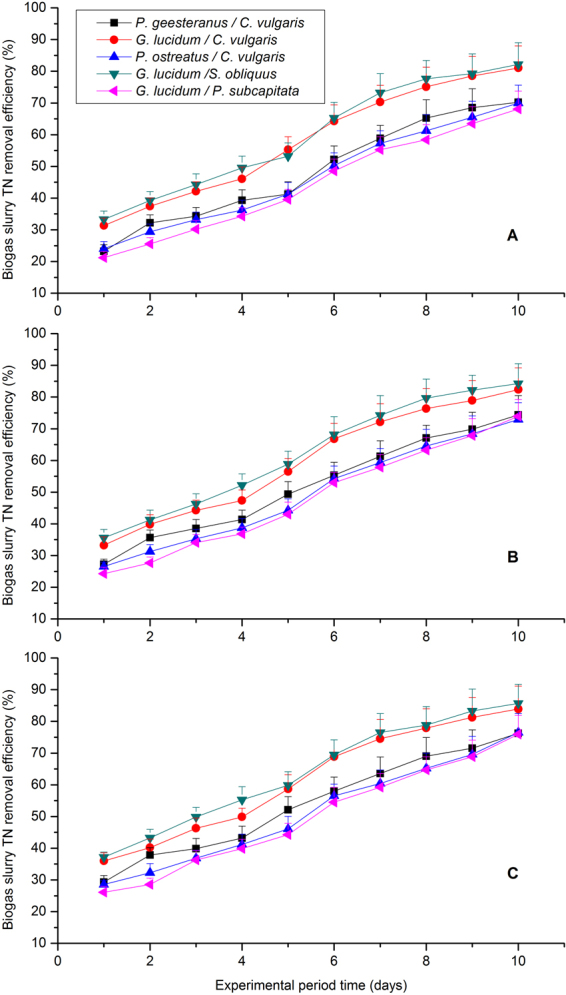
TN removal efficiency with time under different CO2 concentrations for the five selected microalgal-fungal strains: (A) 35% (v/v) CO2, (B) 45% (v/v) CO2, and (C) 55% (v/v) CO2.
As far as phosphorus was concerned, five fungal-microalgal mixtures survived in the co-cultivation and phosphorus REs were recorded as 56.29%, 64.21%, 53.74%, 61.98% and 52.29%, respectively, with 55% CO2 concentration treatment, which is higher than under 45% and 35% CO2 concentration treatment. Obviously, the trend of TP removal efficiency (Fig. 3) is consistent with those of fungal-microalgal growth rate, but not the same to COD and nitrogen RE (Table 1 and Table 2). Phosphorus is a key element in microalgae culture and is an important component of cell membrane phospholipids and adenosine triphosphate22. Furthermore, the presence of Ca2+ and Mg2+ in the biogas slurry and the alkaline conditions caused by fungal-microalgal growth promoted phosphorus precipitation and the formed deposits were helpful for phosphorus removal from biogas slurry42,43. Zhao et al.23 reported that the TP RE by the three microalgae (i.e., C. vulgaris, S. capricornutum, and S. obliquus) was 97.01%, 95.40%, and 95.87% for high C loading waste water with initial P concentration of 0.4 mg L−1 23. Similarly, Powell44 reported that more than 95% of the soluble P in the primary effluent was removed by Chlorella when the initial P concentrations were 4 mg L−1 for the primary effluent44. It is worth noting that the phosphorus RE observed in this work with fungal-algal mixture seems slightly lower than above-mentioned previous works. Most significant influence factor for such strange phenomenon was the initial phosphate concentration in the biogas slurry, which had a strong influence on the accumulation of polyphosphate in the microalgae. Thus, the high initial phosphate concentration (20 mg L−1) was probably responsible for the uncompleted consumption of TP in this study23,44.
Figure 3.
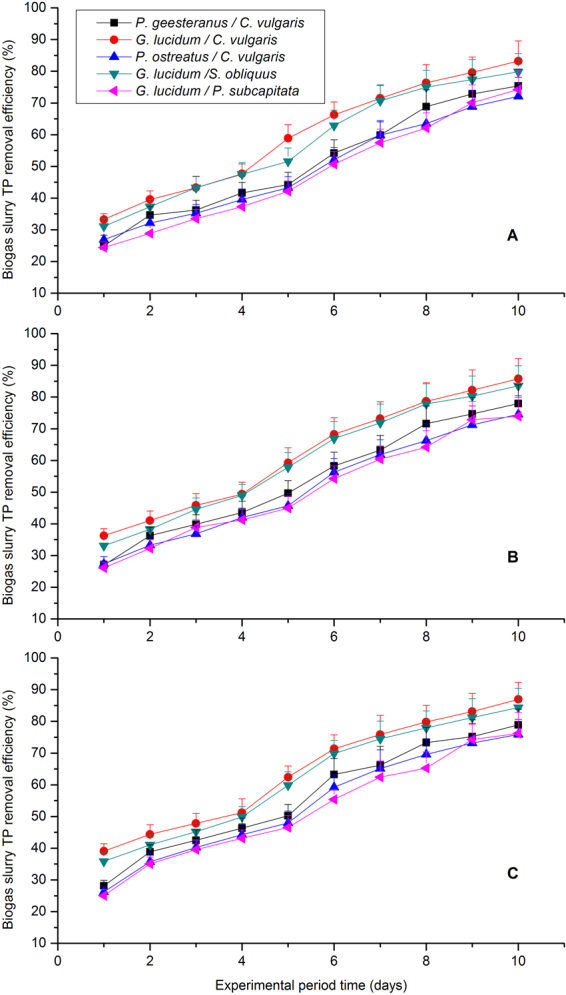
TP removal efficiency with time under different CO2 concentrations for the five selected microalgal-fungal strains: (A) 35% (v/v) CO2, (B) 45% (v/v) CO2, and (C) 55% (v/v) CO2.
Above all, the biogas slurry nutrient (i.e., COD, TN, and TP) were reduced efficiently and similarly by the five fungal-microalgal mixtures under the different CO2 concentration treatments (35%, 45% and 55%, v/v) for 10 days batch culture, and the nutrient remove efficiency (REs) were presented in Table 2 and Figs 1–3 The nutrient removal efficiencies with 55% CO2 treatments were higher than those of the other treatments and achieved the highest COD, TN, and TP removal efficiencies of 68.29 ± 4.73%, 63.93 ± 5.13%, and 64.21 ± 5.36%, respectively. However, no consistent relationship was found between COD remove efficiency, TN remove efficiency, TP remove efficiency and fungal/microalgal growth rates in this study. In other words, the fungal-microalgal growth rate is not proportional to the nutrients (COD, TN and TP) removal from biogas slurry, which is consistent with the conclusion previous reported before by Yan et al.39 and Wang et al.22. These nutrient removals were mainly achieved via an assimilation process of microalgal/fungal reproduction as they require abundant carbon, nitrogen, and phosphorous sources for heterotrophic or mixotrophic growth22,36. But, it was not consistent for COD, TN and TP remove efficiency as detailed mechanism was concerned. Therefore, selection and optimization of fungal-microalgal strains is very important for biogas upgrading, biogas slurry nutrients removal, microalgal metabolism and greenhouse gas reduction. In this study, the optimal fungal-microalgal mixture for biogas slurry nutrients removal was G. lucidum/C. vulgaris under 55% CO2 concentration treatments.
Biogas upgrading
Average CO2 removal rates (%) were investigated as a function of operating time to evaluate differences in biogas upgrading with different CO2 influent concentrations for the five fungal-microalgal strains (Table 2, Fig. 4). Specifically, G. lucidum/C. vulgaris strain recorded high average CO2 removal rate of 64.21 ± 5.36%, followed by P. geesteranus/C. vulgaris for 64.21 ± 5.34%, P. ostreatus/C.vulgaris for 58.53 ± 4.87%, G. lucidum/S. obliquus for 55.62 ± 4.63% and G. lucidum/S. capricornutum for 54.84 ± 3.99%. This result agrees with the findings of previous studies by Sun et al.2, who reported that CO2 can be reduced up to 49.95%–62.31% by bacterial-microalgal co-cultivation containing S. obliquus, C. vulgaris, N. oleoabundans and activated sludge2. At the end of experimental duration, the highest CO2-remove efficiency was recorded as 86.97 ± 5.38% by G. lucidum/C. vulgaris strain (Fig. 4), which was higher than most conclusions that reported before18,21,23,39. It can further confirmed that selection and optimization of fungal-microalgal strain can significantly address such issues as CO2 sequestration, biomass production, nutrient removal of biogas slurry, and simultaneously biogas purification for engineering progress in the future. Moreover, the effect of biogas upgrading in this study agreed with the variation trends of the growth rates and mean daily productivity for the fungal-microalgal strains (Table 1). Half of such biomass reproduction was derived from CO2 sequestration45. If took algal-fungal biomass production based on 1 Kg CO2 removal as a measurable indicator, G. lucidum/C. vulgaris had the highest the biomass production, which were 644.33 g/L, 529.76 g/L and 484.24 g/L, respectively. G. lucidum/S. capricornutum had the lowest biomass production, which was consistent with the analysis of the growth characteristics of the algae. In addition, all the algal-fungal biomass production decreased as initial CO2 concentration increased from 35% to 55%. This finding implied that high CO2 could inhibit growth of the algal-fungal biomass. This is consist with Sun’s research2.
Figure 4.
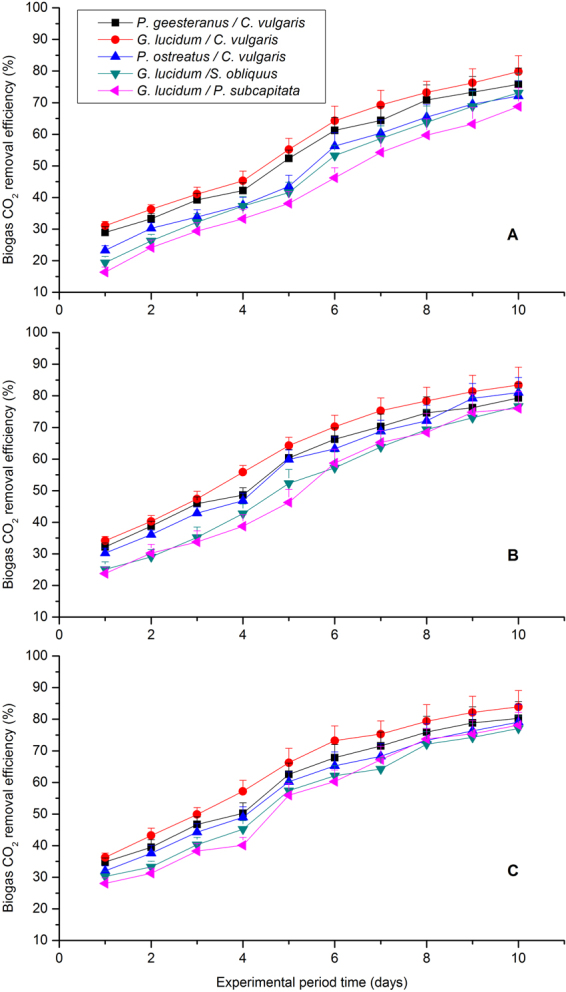
CO2 removal efficiency with time under different CO2 concentrations for the five selected microalgal-fungal strains: (A) 35% (v/v) CO2, (B) 45% (v/v) CO2, and (C) 55% (v/v) CO2.
Though numerous influence factors, such as mix wavelength ratio, photosynthetic photon flux density, different photoperiod treatments, initial CO2 influent concentrations, algal strains and different C/N ratios, were expatiated deeply for reduction of CO2 in the biogas, investigation about effect of pH for biogas upgrading was still incomplete in the previous research2,18,21–23,38,39. In this study, pH was detected and recorded every day during 10 days experimental duration for every fungal-microalgal strain under all initial CO2 influent concentration (Table 3). Similar variation trend of pH was found and was proportion to biomass reproduction and biogas slurry nutrients removal. It was induced that elevated pH or slight alkalescent biogas slurry contributed to enhance sequestration of CO2 by solution of assimilation. In addition, O2 and H2O (v/v) concentrations in the biogas almost unvaried during the experimental period (data not shown). O2 concentration (v/v) was increased from 0.12% ± 0.02% to 0.52% ± 0.04% (data not shown), whereas H2O concentrations (v/v) were in the range of 1.12% ± 0.16% and 3.03% ± 0.22% (data not shown). Since raw biogas always contains saturated steam, the presence of H2O in the upgraded biogas does not negatively affect the growth of microalgae. In addition, H2O and O2 can also be applied for microalgal photosynthesis and respiration46.
Table 3.
Variations in pH under various CO2 concentration treatments for the five selected strains.
| Co-cultivation types/CO2 concentration treatments | Time(h) | ||||||||||
|---|---|---|---|---|---|---|---|---|---|---|---|
| 0 | 24 | 48 | 72 | 96 | 120 | 144 | 168 | 192 | 216 | 240 | |
| CO2 35% (v/v) | |||||||||||
| P. geesteranus/C. vulgaris | 6.84 ± 0.07 | 6.86 ± 0.11 | 6.89 ± 0.15 | 6.92 ± 0.18 | 6.95 ± 0.19 | 6.98 ± 0.21 | 7.01 ± 0.23 | 7.04 ± 0.18 | 7.06 ± 0.26 | 7.11 ± 0.21 | 7.13 ± 0.27 |
| G. lucidum/C. vulgaris | 6.86 ± 0.13 | 6.89 ± 0.15 | 6.92 ± 0.18 | 6.95 ± 0.16 | 6.98 ± 0.21 | 7.02 ± 0.23 | 7.05 ± 0.25 | 7.08 ± 0.22 | 7.11 ± 0.24 | 7.13 ± 0.21 | 7.14 ± 0.23 |
| P. ostreatus/C. vulgaris | 6.85 ± 0.11 | 6.88 ± 0.13 | 6.94 ± 0.16 | 6.98 ± 0.17 | 7.01 ± 0.19 | 7.04 ± 0.21 | 7.07 ± 0.24 | 7.09 ± 0.22 | 7.13 ± 0.26 | 7.12 ± 0.19 | 7.15 ± 0.29 |
| G. lucidum/S. obliquus | 6.87 ± 0.12 | 6.92 ± 0.15 | 6.94 ± 0.22 | 6.96 ± 0.24 | 6.99 ± 0.23 | 7.03 ± 0.24 | 7.06 ± 0.26 | 7.11 ± 0.27 | 7.12 ± 0.28 | 7.15 ± 0.25 | 7.17 ± 0.32 |
| G. lucidum/S. capricornutum | 6.89 ± 0.15 | 6.93 ± 0.21 | 6.97 ± 0.23 | 7.01 ± 0.26 | 7.04 ± 0.22 | 7.06 ± 0.19 | 7.09 ± 0.27 | 7.12 ± 0.21 | 7.15 ± 0.24 | 7.18 ± 0.29 | 7.13 ± 0.25 |
| CO2 45% (v/v) | |||||||||||
| P. geesteranus/C. vulgaris | 6.88 ± 0.11 | 6.89 ± 0.14 | 6.92 ± 0.17 | 6.94 ± 0.19 | 6.97 ± 0.21 | 6.98 ± 0.25 | 7.02 ± 0.24 | 7.04 ± 0.27 | 7.07 ± 0.23 | 7.12 ± 0.24 | 7.14 ± 0.28 |
| G. lucidum/C. vulgaris | 6.83 ± 0.15 | 6.87 ± 0.17 | 6.91 ± 0.19 | 6.93 ± 0.22 | 6.95 ± 0.21 | 7.01 ± 0.24 | 7.04 ± 0.25 | 7.06 ± 0.22 | 7.08 ± 0.25 | 7.11 ± 0.27 | 7.13 ± 0.31 |
| P. ostreatus/C. vulgaris | 6.84 ± 0.12 | 6.86 ± 0.21 | 6.89 ± 0.24 | 6.93 ± 0.25 | 6.98 ± 0.25 | 7.02 ± 0.26 | 7.05 ± 0.24 | 7.07 ± 0.26 | 7.09 ± 0.28 | 7.13 ± 0.23 | 7.15 ± 0.25 |
| G. lucidum/S. obliquus | 6.89 ± 0.13 | 6.93 ± 0.18 | 6.96 ± 0.21 | 7.01 ± 0.24 | 7.04 ± 0.23 | 7.01 ± 0.25 | 7.07 ± 0.27 | 7.11 ± 0.24 | 7.13 ± 0.29 | 7.15 ± 0.26 | 7.17 ± 0.31 |
| G. lucidum/S. capricornutum | 6.82 ± 0.16 | 6.87 ± 0.19 | 6.92 ± 0.22 | 6.95 ± 0.23 | 7.01 ± 0.22 | 7.05 ± 0.27 | 7.09 ± 0.23 | 7.12 ± 0.29 | 7.15 ± 0.26 | 7.11 ± 0.23 | 7.16 ± 0.29 |
| CO2 55% (v/v) | |||||||||||
| P. geesteranus/C. vulgaris | 6.79 ± 0.16 | 6.86 ± 0.17 | 6.89 ± 0.19 | 6.95 ± 0.21 | 6.97 ± 0.24 | 6.99 ± 0.23 | 7.02 ± 0.21 | 7.05 ± 0.27 | 7.08 ± 0.26 | 7.12 ± 0.28 | 7.15 ± 0.27 |
| G. lucidum/C. vulgaris | 6.89 ± 0.19 | 6.92 ± 0.22 | 6.94 ± 0.23 | 6.97 ± 0.25 | 6.99 ± 0.23 | 7.03 ± 0.24 | 7.06 ± 0.26 | 7.09 ± 0.27 | 7.12 ± 0.25 | 7.14 ± 0.27 | 7.16 ± 0.32 |
| P. ostreatus/C. vulgaris | 6.86 ± 0.18 | 6.88 ± 0.21 | 6.95 ± 0.24 | 6.98 ± 0.27 | 7.04 ± 0.25 | 7.08 ± 0.28 | 7.12 ± 0.21 | 7.05 ± 0.26 | 7.14 ± 0.23 | 7.17 ± 0.29 | 7.11 ± 0.24 |
| G. lucidum/S. obliquus | 6.81 ± 0.17 | 6.84 ± 0.22 | 6.87 ± 0.21 | 6.93 ± 0.26 | 6.99 ± 0.28 | 7.05 ± 0.22 | 7.08 ± 0.32 | 7.12 ± 0.24 | 7.16 ± 0.27 | 7.13 ± 0.25 | 7.15 ± 0.32 |
| G. lucidum/S. capricornutum | 6.84 ± 0.15 | 6.88 ± 0.26 | 6.92 ± 0.22 | 6.97 ± 0.23 | 7.03 ± 0.25 | 7.07 ± 0.25 | 7.09 ± 0.29 | 7.13 ± 0.23 | 7.15 ± 0.26 | 7.17 ± 0.29 | 7.13 ± 0.28 |
The COD of the biogas slurry can be efficiently removed during the biogas purification, which was in line with that of biogas CO2 removal and microalgae growth. These results were affirmed in the work of Tongprawhan et al.47, who suggested that CO2 fixation with microalgae was environmentally sustainable in wastewater purification. The COD reduction is attributed to the assimilation process of microalgae, which involves cell growth of microalgae and microalgal-fungal pellets, the CO2 uptaking of the microalgal and microalgal-fungal pellets was positively related to the microalgal cell growth and COD removal48. The microalgae cells assimilation requires abundant carbon from biogas slurry and biogas for producing nucleic acid49. Furthermore, Chisti45 reported that approximately half of the microalgae cell was carbon derived from CO2 uptaking. Especially, the synthetic materials in the pollutant removal process could be used during the microalgal autotrophic metabolism. They are acted as an enzyme activator or energy (ATP), and as the components of microalgae50.Therefore, the COD in biogas slurry can promote the CO2 removal efficiency of biogas using microalgae.
Energy consumption economic efficiency
Table 2 also showed the energy consumption economic efficiency for biogas CO2 removal efficiency and the biogas slurry nutrient removal efficiency using different microalgae with different CO2 content. The results show that, for 35% CO2, G. lucidum/C. vulgaris has the highest energy efficiency in these five cultures. Although the TN removal of G. lucidum/S. obliquus was 2.3% higher than G. lucidum/C. vulgaris, the difference in TN removal rate was not significant (p > 0.05). Similarly, G. lucidum/C. vulgaris can achieve relatively high energy efficiency with 45% and 55% CO2. For the same reason, there was no significant difference between G. lucidum/C. vulgaris and G. lucidum/S. obliquus for energy efficiency of TN and TP removal with 45% CO2 (p > 0.05), as well as energy efficiency of TN removal between G. lucidum/S. obliquus and G. lucidum/C. vulgaris with 55% CO2 (p > 0.05). These results are consistent with the analysis of the microalgal growth and nutrient removal mentioned above. As a result, G. lucidum/C. vulgaris can achieve high energy efficiency with 55% CO2. The reason can be conclude that, CO2 can provide an important and sufficient carbon source for photosynthesis of microalgae and promote its growth with 55% CO2. The Ganoderma lucidum can provide a carrier for microalgal growth that promotes their growths. The symbiont resulted in removing nutrient in the sewage and CO2 in biogas efficiently2,28,51. According to the Eq.(3), the energy efficiency depend on the removal rate of nutrients or CO2. According to the results of Table 2, the removal rate of G. lucidum/C. vulgaris is superior to other cultures and lead to high energy efficiency.
Conclusions
Five different microalgae-fungi had significant effects on nutrient and CO2 removal. The removal of pollutants and biogas purification increased as the increasing of CO2 content in biogas. G.lucidum/C. vulgaris was selected as the better biological treatment with the initial 55% CO2 content because of its high pollutant purification efficiency. The mean COD, TN, TP and CO2 removal efficiency were 68.29%, 61.75%, 64.21% and 64.68%, respectively. The analysis of the energy consumption economic efficiency demonstrated that cocultivation of microalgae and fungi experienced the highest economic efficiency.
Methods
Cultivation of microalgal, fungal and fungal-microalgal strains and culture conditions
Three microalgae named C. vulgaris, S. obliquus and S. capricornutum were used for nutrient removal and biogas upgrading because of their high biogas tolerance and fast growth rate in high nutrient concentration wastewater2,18. They were cultured on BG-11 medium, which was autoclaved before and contained NaNO3 (1500 mg L−1), K2HPO4·3H2O (40 mg L−1), MgSO4·7H2O (75 mg L−1), CaCl2·2H2O (36 mg L−1), ferric ammonium citrate citric acid·1H2O (6 mg L−1), EDTA-Na2 (1 mg L−1), Na2CO3 (20 mg L−1), and A5 (1 ml L−1). The trace elements (A5) consisted of H3BO3 (2860 mg L−1), MnCl2·H2O (1860 mg L−1), ZnSO4·7H2O (222 mg L−1), CuSO4·5H2O (79 mg L−1), NaMoO4·2H2O (390 mg L−1), and CoCl2·6H2O (49 mg L−1). In order to be in the exponential phase to increase their mass before the experiments, these microalgal strains were cultivated in 500 mL Erlenmeyer flasks for 7 days. All the cultivation were conducted in a controlled conditions under LED light with about 200 μmol m−2 s−1 photosynthetic photon flux density, a light-dark cycle (12 h:12 h) at 25 ± 0.5 °C in illuminating incubators (GZP-350S) obtained from Shanghai Jing Hong Laboratory Instrument Co., Ltd. (Shanghai, China). LED lamps were evenly distributed on three sides (left, right and front) of the incubators. The dry weight (DW) of these selected microalgal strains in the stock culture was nearly 66.38 ± 3.17 mg L−1.
Similarly, three fungal strains obtained from China General Microbiological Culture Collection Center were selected in this study for the further research as they have high growth rate and high pelletization ability (namely, P. geesteranus, G. lucidum and P. ostreatus). To form pellets, spore solutions were cultivated at 25 ± 0.1 °C for 7 d on 500 mL synthetic growth medium (glucose, 10 g L−1; NH4NO3, 2.0 g L−1; K2HPO4, 1.0 g L−1; NaH2PO4·H2O, 0.4 g L−1; MgSO4·7H2O, 0.5 g L−1; and yeast extract, 2.0 g L−1; pH 6.5). The obtained biomass was washed and homogenized with 100 mL of sterile distilled water in a laboratory blender. Subsequently, these obtained strains were used for the co-cultivation with microalgae.
As far as fungal-microalgal co-cultivation was concerned, microalgal suspensions (100 mL) of C. vulgaris, S. obliquus, and S. capricornutum were obtained after preparation and then each suspension was mixed with 5 mL of P. geesteranus, G. lucidum or P. ostreatus pellet suspension. The co-culture conditions for fungal–microalgal mixtures were as follows: constant light 200 μmol m−2 s−1, 25 ± 0.5 °C, artificial intermittent shaking at 160 rpm approximately for 168 h. All of the biogas upgrading and wastewater purification experiments were biologically conducted in triplicated and the daily biomass concentrations were measured during operational periods in 10 days.
Photobioreactor
The photobioreactor was formed of two individual, interconnected with a glass cylinder blocks (volume = 16.8 L, height = 0.6 m; diameter = 0.2 m), filled with 14 L crude biogas and 2.8 L biogas slurry28 (Fig. 5). Rubber stoppers were used to seal reactors. Biogas slurry was once added to the photobioreactor from the right-cylinder block to the left, with the left-cylinder block illuminated under 200 μmol m−2 s−1. Crude biogas was fed to the system via a photobioreactor headspace.
Figure 5.

The photobioreactor experimental setup.
Biogas slurry and biogas
The CO2 content in synthetic biogas were 35.26 ± 2.19% (vol.%), 45.28 ± 1.92% (vol.%), 55.13 ± 3.11% (vol.%). The biogas slurry was obtained from an anaerobic digester in Hongmao Hacienda, Kunshan City, Jiangsu Province, PR China. The raw biogas slurry was pretreated by passing through a glass microfiber filter (GF/C; Whatman, USA) and ultraviolet sterilizer (SKW-UVU01; SKYUV Water Treatment Co. Ltd, China) for 2 minutes to prevent potential interference from sediment and some microorganisms18. The characteristics of the raw biogas slurry before and after pretreatment were listed in Table 4, which revealed that the characteristics of biogas slurry almost unchanged before and after pretreatments.
Table 4.
The basic characteristics of biogas slurry.
| Parameter | Before pretreatment | After pretreatment |
|---|---|---|
| pH | 6.84 ± 0.16 | 6.91 ± 0.18 |
| DO | 5.76 ± 0.41 | 5.59 ± 0.27 |
| DIC(mgL−1) | 831.55 ± 19.38 | 809.21 ± 22.04 |
| COD(mgL−1) | 1024.36 ± 30.43 | 997.57 ± 27.39 |
| TN(mgL−1) | 209.35 ± 17.19 | 202.07 ± 15.66 |
| TP(mgL−1) | 22.48 ± 3.71 | 20.92 ± 2.37 |
Experimental procedure
According to our previous studies, mono-microalgal strain C. vulgaris and mono-fungal stain G. lucidum already showed great ability on biogas upgrading and simultaneously biogas slurry nutrients removal by itself in the bioreactor21,23,28. Hence, three above-mentioned fungal strains were co-cultivated with C. vulgaris, and three selected microalgal strains were co-cultivated with G. lucidum in this study for the further study. In view of one mixture was double counted, there are five fungal-microalgal mixtures were co-cultivated for next step in this experiment, such as P. geesteranus/C. vulgaris, G. lucidum/C. vulgaris, P. ostreatus/C. vulgaris, G. lucidum/S. obliquus and G. lucidum/S. capricornutum.
Detailed procedures were as follows based on research design above: 100 mL of microalgal suspensions of C. vulgaris, S. obliquus and S. capricornutum (about 118 mg L−1 of all the dry weight) were cultured, then each suspension was mixed with 5 mL of P. geesteranus, G. lucidum and P. ostreatus pellet suspension (about 83 mg L−1 of dry weight). The initial density of the microalgae co-cultivated with fungal cells was maintained at about 123.52 ± 3.46 mg·L−1 for the five fungal–microalgal pellets. The following conditions were used: the light intensity was 200 μmol m−2 s−1, the experimental period was 10 d, the temperature was 25 ± 0.5 °C and the 1ight:dark cycles was 12 h:12 h. The growth rates, mean daily productivity, nutrient removal and CO2 content with different fungal-microalgal co-cultivation types were evaluated daily and the optimal CO2 concentration was selected by analyzing the economic efficiencies of the biogas CO2 and the biogas slurry nutrient removal.
Sampling and analyses
The biogas slurry in photobioreactors was sampled daily for determination of COD, total nitrogen (TN) and total phosphate (TP). The biogas was sampled for component analysis (CH4, CO2, O2 and H2O, v/v) using a circulating gas analyzer (GA94; ONUEE Co. Ltd, China). Dry weights of microalgae were measured through exsiccation after being filtered with a glass microfiber filter (GF/C, Whatman, USA). The filtrates were used for nutrient determination according to the standard methods52.
Biogas CO2 and total biogas slurry nutrient removal efficiency (RE, %) was calculated based on the following equation:
| 1 |
where Ci is the biogas CO2 content or total nutrient concentration (g L−1) in cultures at time ti and C0 is the initial biogas CO2 content or total nutrient concentration (g L−1) at time t0 (day).
Specific growth rates (μ) were derived from the growth phase using the following equations:
| 2 |
where Di stand for the biomass concentration (g L−1) at time ti (d) and D0 is the biomass concentration (g L−1) at time t0 (d).
The CO2 or biogas slurry nutrient removal economic efficiency was evaluated based on the following equation:
| 3 |
where E is the biogas CO2 or biogas slurry nutrient removal economic efficiency (USD−1), R is the removal efficiency of pollutant (%) in Eq. (1), k is the electric power charge per unit of power consumption (USD kW−1 h−1), which is around 0.645 RMB kW−1 h−1 in local, i.e. around 0.097 USD kW−1 h−1; T is the light application time (h), and P is the LED electric quantity (W).
Statistical analyses
Statistic analysis was carried out using Statistic Package for Social Science (SPSS, V19.0). One-way analysis of variance (ANOVA) was used to determine whether the impact of various factors on the test indicators is significant. Duncan’s multiple range tests was used to analyze the significant difference between groups. The value p = 0.05 was regarded as the threshold for statistical significance.
Acknowledgements
This study was funded by the National Natural Science Foundation of China (Project no. 31670511 and 31370520), the Zhejiang Provincial Natural Science Foundation (Project no. LY16C030003 and LQ17E080013), and Planned Science and Technology Project of Jiaxing (2017BY18065 and 2016AY13004).
Author Contributions
Kai zhou and Xiaobo Jia conducted the experiments. Yuejin Zhang prepared the figures and wrote the main manuscript text. All authors reviewed the manuscript.
Competing Interests
The authors declare no competing interests.
Footnotes
Publisher's note: Springer Nature remains neutral with regard to jurisdictional claims in published maps and institutional affiliations.
Contributor Information
Yuejin Zhang, Email: lnzhangyuejin@163.com.
Xiaobo Jia, Email: Jiaxb@craes.org.cn.
References
- 1.Sydney EB, et al. Screening of microalgae with potential for biodiesel production and nutrient removal from treated domestic sewage. Appl Energ. 2011;88:3291–3294. doi: 10.1016/j.apenergy.2010.11.024. [DOI] [Google Scholar]
- 2.Sun S, et al. Performance of CO2 concentrations on nutrient removal and biogas upgrading by integrating microalgal strains cultivation with activated sludge. Energy. 2016;97:229–237. doi: 10.1016/j.energy.2015.12.126. [DOI] [Google Scholar]
- 3.Su Y, Mennerich A, Urban B. Municipal wastewater treatment and biomass accumulation with a wastewater-born and settleable algal-bacterial culture. Water Res. 2011;45:3351–3358. doi: 10.1016/j.watres.2011.03.046. [DOI] [PubMed] [Google Scholar]
- 4.Su Y, Mennerich A, Urban B. Synergistic cooperation between wastewater-born algae and activated sludge for wastewater treatment: Influence of algae and sludge inoculation ratios. Bioresour. Technol. 2012;105:67–73. doi: 10.1016/j.biortech.2011.11.113. [DOI] [PubMed] [Google Scholar]
- 5.Pittman JK, Dean AP, Osundeko O. The potential of sustainable algal biofuel production using wastewater resources. Bioresour. Technol. 2011;102:17–25. doi: 10.1016/j.biortech.2010.06.035. [DOI] [PubMed] [Google Scholar]
- 6.Leite GB, Abdelaziz AE, Hallenbeck PC. Algal biofuels: challenges and opportunities. Bioresour. Technol. 2013;145:134–141. doi: 10.1016/j.biortech.2013.02.007. [DOI] [PubMed] [Google Scholar]
- 7.Pragya N, Pandey KK, Sahoo PK. A review on harvesting, oil extraction and biofuels production technologies from microalgae. Renew Sust Energ Rev. 2013;24:159–171. doi: 10.1016/j.rser.2013.03.034. [DOI] [Google Scholar]
- 8.Uduman N, Qi Y, Danquah MK, Forde GM, Hoadley A. Dewatering of microalgal cultures: A major bottleneck to algae-based fuels. J Renew Sustain Ener. 2010;2:23–571. doi: 10.1063/1.3294480. [DOI] [Google Scholar]
- 9.Prajapati SK, Kumar P, Malik A, Choudhary P. Exploring Pellet Forming Filamentous Fungi as Tool for Harvesting Non-flocculating Unicellular Microalgae. Bioenerg Res. 2014;7:1430–1440. doi: 10.1007/s12155-014-9481-1. [DOI] [Google Scholar]
- 10.Salim S, Vermuë MH, Wijffels RH. Ratio between autoflocculating and target microalgae affects the energy-efficient harvesting by bio-flocculation. Bioresour. Technol. 2012;118:49–55. doi: 10.1016/j.biortech.2012.05.007. [DOI] [PubMed] [Google Scholar]
- 11.Manheim D, Nelson Y. Settling and bioflocculation of two species of algae used in wastewater treatment and algae biomass production. Environmental Progress & Sustainable Energy. 2013;32:946–954. doi: 10.1002/ep.11861. [DOI] [Google Scholar]
- 12.Vandamme D, Foubert I, Muylaert K. Flocculation as a low-cost method for harvesting microalgae for bulk biomass production. Trends Biotechnol. 2013;31:233–239. doi: 10.1016/j.tibtech.2012.12.005. [DOI] [PubMed] [Google Scholar]
- 13.Taylor TN, Hass H, Remy W, Kerp H. The oldest fossil lichen. Nature. 1995;379:244. doi: 10.1038/378244a0. [DOI] [Google Scholar]
- 14.Zhang J, Hu B. A novel method to harvest microalgae via co-culture of filamentous fungi to form cell pellets. Bioresour. Technol. 2012;114:529–535. doi: 10.1016/j.biortech.2012.03.054. [DOI] [PubMed] [Google Scholar]
- 15.Zhou W, et al. Novel fungal pelletization-assisted technology for algae harvesting and wastewater treatment. Appl. Biochem. Biotechnol. 2012;167:214–228. doi: 10.1007/s12010-012-9667-y. [DOI] [PubMed] [Google Scholar]
- 16.Xie S, Sun S, Dai SY, Yuan JS. Efficient coagulation of microalgae in cultures with filamentous fungi. Algal Res. 2013;2:28–33. doi: 10.1016/j.algal.2012.11.004. [DOI] [Google Scholar]
- 17.Bahr M, Díaz I, Dominguez A, Sánchez AG, Muñoz R. Microalgal-biotechnology as a platform for an integral biogas upgrading and nutrient removal from anaerobic effluents. Environ Sci Technol. 2014;48:573–581. doi: 10.1021/es403596m. [DOI] [PubMed] [Google Scholar]
- 18.Yan C, Zheng Z. Performance of photoperiod and light intensity on biogas upgrade and biogas effluent nutrient reduction by the microalgae Chlorella sp. Bioresour. Technol. 2013;139:292. doi: 10.1016/j.biortech.2013.04.054. [DOI] [PubMed] [Google Scholar]
- 19.Pulz O, Gross W. Valuable products from biotechnology of microalgae. Appl. Microbiol. Biotechnol. 2004;65:635. doi: 10.1007/s00253-004-1647-x. [DOI] [PubMed] [Google Scholar]
- 20.Gultom SO, Hu B. Review of microalgae harvesting via co-Pelletization with filamentous fungus. Energies. 2013;6:5921–5939. doi: 10.3390/en6115921. [DOI] [Google Scholar]
- 21.Zhao Y, et al. Performance of three microalgal strains in biogas slurry purification and biogas upgrade in response to various mixed light-emitting diode light wavelengths. Bioresour. Technol. 2015;187:338–345. doi: 10.1016/j.biortech.2015.03.130. [DOI] [PubMed] [Google Scholar]
- 22.Wang Z, Zhao Y, Ge Z, Zhang H, Sun S. Selection of microalgae for simultaneous biogas upgrading and biogas slurry nutrient reduction under various photoperiods. J. Chem. Technol. Biotechnol. 2016;91:1982–1989. doi: 10.1002/jctb.4788. [DOI] [Google Scholar]
- 23.Zhao Y, Ge Z, Lui H, Sun S. Ability of different microalgae species in synthetic high‐strength wastewater treatment and potential lipid production. J. Chem. Technol. Biotechnol. 2016;91:2888–2895. doi: 10.1002/jctb.4905. [DOI] [Google Scholar]
- 24.Gultom SO, Zamalloa C, Hu B. Microalgae Harvest through Fungal Pelletization—Co-Culture of Chlorella vulgaris and Aspergillus niger. Energies. 2014;7:4417–4429. doi: 10.3390/en7074417. [DOI] [Google Scholar]
- 25.Oh HM, et al. Harvesting of Chlorella vulgaris using a bioflocculant from. Paenibacillus sp. AM49. Biotechnol. Lett. 2001;23:1229–1234. doi: 10.1023/A:1010577319771. [DOI] [Google Scholar]
- 26.Krull R, et al. Characterization and control of fungal morphology for improved production performance in biotechnology. J. Biotechnol. 2013;163:112. doi: 10.1016/j.jbiotec.2012.06.024. [DOI] [PubMed] [Google Scholar]
- 27.Su Y, Mennerich A, Urban B. The long-term effects of wall attached microalgal biofilm on algae-based wastewater treatment. Bioresour. Technol. 2016;218:1249–1252. doi: 10.1016/j.biortech.2016.06.099. [DOI] [PubMed] [Google Scholar]
- 28.Zhang Y, Bao K, Wang J, Zhao Y, Hu C. Performance of mixed LED light wavelengths on nutrient removal and biogas upgrading by different microalgal–based treatment technologies. Energy. 2017;130:392–401. doi: 10.1016/j.energy.2017.04.157. [DOI] [Google Scholar]
- 29.Cao W, Wang X, Sun S, Hu C, Zhao Y. Simultaneously upgrading biogas and purifying biogas slurry using cocultivation of Chlorella vulgaris and three different fungi under various mixed light wavelength and photoperiods. Bioresour. Technol. 2017;241:701–709. doi: 10.1016/j.biortech.2017.05.194. [DOI] [PubMed] [Google Scholar]
- 30.Muradov N, et al. Fungal-assisted algal flocculation: application in wastewater treatment and biofuel production. Biotechnol Biofuels. 2015;8:24. doi: 10.1186/s13068-015-0210-6. [DOI] [PMC free article] [PubMed] [Google Scholar]
- 31.Linder MB. Hydrophobins: Proteins that self assemble at interfaces. Curr Opin Colloid In. 2009;14:356–363. doi: 10.1016/j.cocis.2009.04.001. [DOI] [Google Scholar]
- 32.Feofilova EP. The fungal cell wall: Modern concepts of its composition and biological function. Microbiology. 2010;79:723. doi: 10.1134/S0026261710060019. [DOI] [PubMed] [Google Scholar]
- 33.Xia C, Zhang J, Zhang W, Bo H. A new cultivation method for microbial oil production: cell pelletization and lipid accumulation by Mucor circinelloides. Biotechnol Biofuels. 2011;4:15. doi: 10.1186/1754-6834-4-15. [DOI] [PMC free article] [PubMed] [Google Scholar]
- 34.Liu Y, Liao W, Chen S. Co-production of lactic acid and chitin using a pelletized filamentous fungus Rhizopus oryzae cultured on cull potatoes and glucose. J. Appl. Microbiol. 2008;105:1521. doi: 10.1111/j.1365-2672.2008.03913.x. [DOI] [PubMed] [Google Scholar]
- 35.Singh, M. & Das, K. C. Low Cost Nutrients for Algae Cultivation. (Springer Netherlands, 2014).
- 36.Yang C, Ding Z, Zhang K. Growth of Chlorella pyrenoidosa in wastewater from cassava ethanol fermentation. World J. Microbiol. Biotechnol. 2008;24:2919–2925. doi: 10.1007/s11274-008-9833-0. [DOI] [Google Scholar]
- 37.Serejo ML, et al. Influence of biogas flow rate on biomass composition during the optimization of biogas upgrading in microalgal-bacterial processes. Environ. Sci. Technol. 2015;49:3228–3236. doi: 10.1021/es5056116. [DOI] [PubMed] [Google Scholar]
- 38.Zhao Y, Wang J, Zhang H, Yan C, Zhang Y. Effects of various LED light wavelengths and intensities on microalgae-based simultaneous biogas upgrading and digestate nutrient reduction process. Bioresour. Technol. 2013;136C:461–468. doi: 10.1016/j.biortech.2013.03.051. [DOI] [PubMed] [Google Scholar]
- 39.Yan C, Zheng Z. Performance of mixed LED light wavelengths on biogas upgrade and biogas fluid removal by microalga Chlorella sp. Appl Energ. 2014;113:1008–1014. doi: 10.1016/j.apenergy.2013.07.012. [DOI] [Google Scholar]
- 40.Xu J, Zhao Y, Zhao G, Zhang H. Nutrient removal and biogas upgrading by integrating freshwater algae cultivation with piggery anaerobic digestate liquid treatment. Appl. Microbiol. Biotechnol. 2015;99:6493–6501. doi: 10.1007/s00253-015-6537-x. [DOI] [PubMed] [Google Scholar]
- 41.Kumar A, et al. Enhanced CO(2) fixation and biofuel production via microalgae: recent developments and future directions. Trends Biotechnol. 2010;28:371–380. doi: 10.1016/j.tibtech.2010.04.004. [DOI] [PubMed] [Google Scholar]
- 42.Posadas E, et al. Enclosed tubular and open algal–bacterial biofilm photobioreactors for carbon and nutrient removal from domestic wastewater. Ecol. Eng. 2014;67:156–164. doi: 10.1016/j.ecoleng.2014.03.007. [DOI] [Google Scholar]
- 43.Ruiz-Marin A, Mendoza-Espinosa LG, Stephenson T. Growth and nutrient removal in free and immobilized green algae in batch and semi-continuous cultures treating real wastewater. Bioresour. Technol. 2010;101:58. doi: 10.1016/j.biortech.2009.02.076. [DOI] [PubMed] [Google Scholar]
- 44.Powell N, Shilton A, Chisti Y, Pratt S. Towards a luxury uptake process via microalgae - defining the polyphosphate dynamics. Water Res. 2009;43:4207–4213. doi: 10.1016/j.watres.2009.06.011. [DOI] [PubMed] [Google Scholar]
- 45.Chisti Y. Biodiesel from microalgae beats bioethanol. Trends Biotechnol. 2008;26:126–131. doi: 10.1016/j.tibtech.2007.12.002. [DOI] [PubMed] [Google Scholar]
- 46.Kübler JE, Johnston AM, Raven JA. The effects of reduced and elevated CO2 and O2 on the seaweed Lomentaria articulata. Plant Cell & Environment. 1999;22:1303–1310. doi: 10.1046/j.1365-3040.1999.00492.x. [DOI] [Google Scholar]
- 47.Budzianowski WM, Budzianowska DA. Economic analysis of biomethane and bioelectricity generation from biogas using different support schemes and plant configurations. Energy. 2015;88:658–666. doi: 10.1016/j.energy.2015.05.104. [DOI] [Google Scholar]
- 48.Anjos M, Fernandes BD, Vicente AA, Teixeira JA, Dragone G. Optimization of CO2 bio-mitigation by Chlorella vulgaris. Bioresour. Technol. 2013;139:149–154. doi: 10.1016/j.biortech.2013.04.032. [DOI] [PubMed] [Google Scholar]
- 49.Kumar MS, Miao ZH, Wyatt SK. Influence of nutrient loads, feeding frequency and inoculum source on growth of Chlorella vulgaris in digested piggery effluent culture medium. Bioresour. Technol. 2010;101:6012–6018. doi: 10.1016/j.biortech.2010.02.080. [DOI] [PubMed] [Google Scholar]
- 50.Moore EC, Cohen SS. Effects of arabinonucleotides on ribonucleotide reduction by an enzyme system from rat tumor. J Biol Chem. 1967;242:2116–2118. [PubMed] [Google Scholar]
- 51.Kim TH, Lee Y, Han SH, Hwang SJ. The effects of wavelength and wavelength mixing ratios on microalgae growth and nitrogen, phosphorus removal using Scenedesmus sp. for wastewater treatment. Bioresour. Technol. 2013;130:75–80. doi: 10.1016/j.biortech.2012.11.134. [DOI] [PubMed] [Google Scholar]
- 52.Author. Standard Methods for the Examination of water and Wastewater. Edition edn, American Public Health Association, (1995).