Abstract
Purpose
To examine spatial changes in rod-mediated function in relationship to local structural changes across the central retina in eyes with a spectrum of age-related macular degeneration (AMD) disease severity.
Methods
Participants were categorized into five AMD severity groups based on fundus features. Scotopic thresholds were measured at 14 loci spanning ±18° along the vertical meridian from one eye of each of 42 participants (mean = 71.7 ± 9.9 years). Following a 30% bleach, dark adaptation was measured at eight loci (±12°). Rod intercept time (RIT) was defined from the time to detect a −3.1 log cd/m2 stimulus. RITslope was defined from the linear fit of RIT with decreasing retinal eccentricity. The presence of subretinal drusenoid deposits (SDD), ellipsoid (EZ) band disruption, and drusen at the test loci was evaluated using optical coherence tomography.
Results
Scotopic thresholds indicated greater rod function loss in the macula, which correlated with increasing AMD group severity. RITslope, which captures the spatial change in the rate of dark adaptation, increased with AMD severity (P < 0.0001). Three rod function phenotypes emerged: RF1, normal rod function; RF2, normal scotopic thresholds but slowed dark adaptation; and RF3, elevated scotopic thresholds with slowed dark adaptation. Dark adaptation was slowed at all loci with SDD or EZ band disruption, and at 32% of loci with no local structural changes.
Conclusions
Three rod function phenotypes were defined from combined measurement of scotopic threshold and dark adaptation. Spatial changes in dark adaptation across the macula were captured with RITslope, which may be a useful outcome measure for functional studies of AMD.
Keywords: dark adaptation, scotopic thresholds, age-related macular degeneration, subretinal drusenoid deposits, AMD, SDD, rod intercept time, RIT
Nonexudative age-related macular degeneration (AMD) is a leading cause of vision loss among the elderly for which no treatments exist. Promising treatments for early and intermediate stages of AMD exist,1 but the feasibility of future clinical trials requires sensitive outcome measures beyond visual acuity. Early visual changes that affect the AMD population include difficulty with driving at night and adjusting to changes in lighting.2–4 These symptoms are consistent with histologic findings from donor AMD eyes showing preferential loss of rods over cones throughout the course of the disease.5–7
Psychophysical measures of rod function include dark adaptation, which measures the rate of recovery of retinal sensitivity following exposure to an intense light, and scotopic thresholds, which measure the minimum light that can be detected once the retina is fully adapted in the dark. Normal scotopic thresholds with slowed dark adaptation implicate reduction in the supply of retinoids whereas an elevation of scotopic thresholds implicates rod function itself.
Within the perifoveal macula of AMD patients, scotopic thresholds are altered along a steep gradient, with the largest deficits closest to the fovea.8,9 Because dark adaptation is more affected than scotopic thresholds in AMD and with aging,8–13 recent studies of AMD have focused on measuring dark adaptation as a functional outcome measure.14–18 Most of these studies have measured dark adaptation from a single retinal locus. Fraser et al.18 recorded dark adaptation from seven retinal loci across the central 12° and reported that slowest adaptation occurred within the central 6°. As measurement of scotopic thresholds and dark adaptation provide different but complementary information regarding rod function, much might be gained by studying spatial variation in both parameters across the parafovea in eyes with AMD.
To what extent reductions in rod-mediated function can be explained by structural changes in AMD-affected retinas remains unclear. Two studies report strong correlation between the presence of drusen and/or other AMD-associated retinal abnormalities across the macula and at the location of testing.19,20 In contrast, other studies find no clear association between the presence of drusen and changes in dark adaptation.9,16,21 Recent studies have also shown that subretinal drusenoid deposits (SDD) are associated with notably delayed dark adaptation.16,18
Understanding the relationship between scotopic thresholds and dark adaptation across the central retina in AMD in relation to structural changes in the retina/RPE complex would further our knowledge on biological mechanisms involved in AMD progression, may provide a more sensitive means to track progression of disease, and may help identify those patients most likely to benefit from therapeutic intervention. The goals of the current study were to (1) investigate the relationship between dark adaptation and scotopic thresholds in patients with AMD and SDD; (2) determine the effect of retinal eccentricity on psychophysical measures of rod function in AMD and SDD; and (3) determine the effect of local structural changes within the retinal/RPE complex on rod function across the central retina.
Methods
Study Population
Participants included adults older than 50 years both with and without AMD who were recruited from the eye clinic at the National Eye Institute, National Institutes of Health (Bethesda, MD, USA) between September and December 2016. Although not a clinical trial, the study is registered on clinicaltrials.gov (identifier NCT02617966). This study was approved by the Institutional Review Board of the National Institutes of Health, is Health Insurance Portability and Accountability Act compliant, and adhered to the tenets of the Declaration of Helsinki. All participants provided informed consent.
Study eyes had a best-corrected visual acuity of 20/50 or better. Based on clinical examination and medical records, patients were excluded for (1) inability to dilate pupil to 6.3 mm (see Appendix); (2) advanced AMD in both eyes at baseline visit; (3) any other active ocular or macular disease (e.g., glaucoma, diabetic retinopathy, Stargardt disease); (4) a condition preventing compliance with the study assessment; (5) cataract surgery within 3 months before enrollment; (6) history of vitamin A deficiency; (7) high oral intake of vitamin A palmitate supplement (10,000 international units per day); and (8) active liver disease or history of liver disease.
Ophthalmic Examination and Imaging
Participants underwent complete ophthalmic examination and retinal imaging including color fundus photographs, fundus autofluorescence images, and spectral-domain optical coherence tomography (SD-OCT) as described in detail previously.16 Retinal imaging was completed on a separate visit within 6 months (average = 3 months; range, 0–5.9 months) of the dark adaptation testing described herein.
Participants were placed into one of five AMD severity groups based on fundus features as previously described.16 Briefly, eligible eyes were screened for the presence of SDD based on grading of color photographs and both fundus autofluorescence and infrared reflectance images,16 and these eyes were placed in a separate group. The remaining participants were grouped by AMD severity as follows: Group 0 had no large drusen (≥125 μm), late AMD, or SDD in either eye; group 1 and 2 participants had large drusen in one or both eyes, respectively, and no late AMD in either eye; group 3 had large drusen in the study eye and late-stage AMD in the other eye.
Measurement and Analysis of Scotopic Thresholds
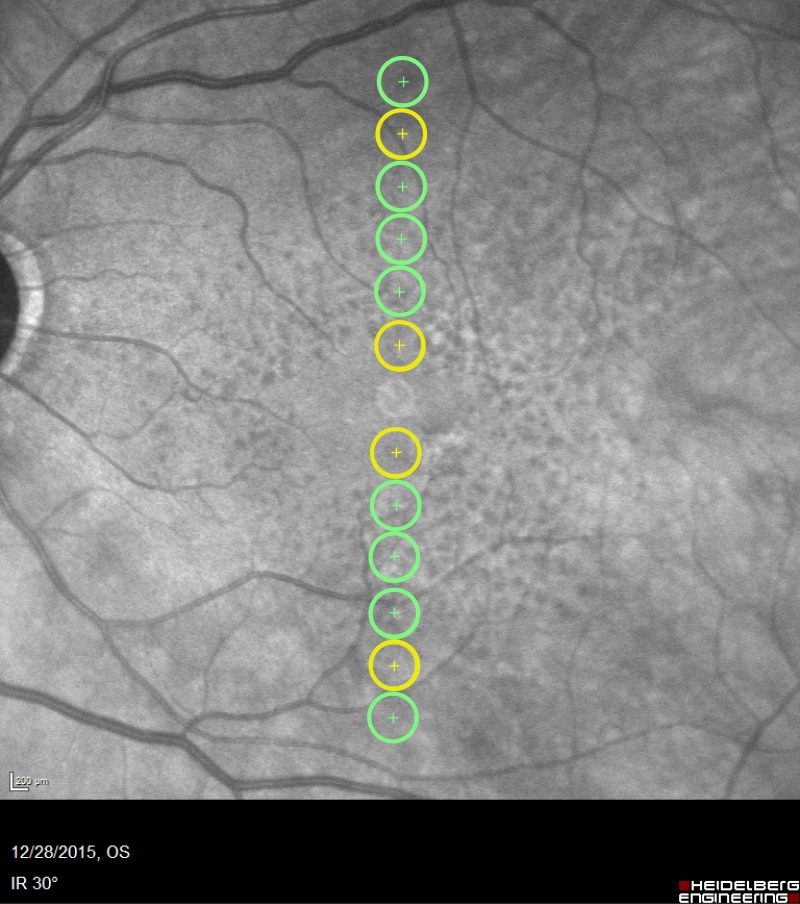
Scotopic thresholds were measured using a Medmont Dark Adapted Chromatic (DAC) perimeter (Medmont, Nunawading, VIC, Australia). Following pupil dilation, the participant was immediately placed in the dark and the DAC “Stopwatch” started. After 20 minutes in the dark, scotopic thresholds were measured monocularly from the study eye at 14 retinal locations, 2°, 4°, 6°, 8°, 10°, 12°, and 18° eccentricity along the vertical meridian (Fig. 1). Corrective lenses were inserted into a lens holder to account for the participants' refraction and 30-cm viewing distance. Fixation was monitored throughout testing via an infrared camera. Participants were asked to focus on the central red fixation light and to respond by pushing a response button when they saw a stimulus flash.
Figure 1.
Test loci. Scotopic thresholds were measured from all 12 loci shown (2°, 4°, 6°, 8°, 10°, and 12° eccentricity superior and inferior to the fovea) plus two additional locations at 18° eccentricity (not shown). Dark adaptation was measured from the eight loci shown in green (4°, 6°, 8°, and 12° eccentricity).
To implement two-color, dark-adapted perimetry,22–24 scotopic thresholds were measured first in response to a red (dominant wavelength = 625 nm) stimulus, and then, after a short break, to a green (dominant wavelength = 505 nm) stimulus. Stimuli were 1.73° in diameter (Goldmann V spot size) and presented for 200 msec. Testing included measurement and recording of false positives. DAC starting intensities were 30 and 50 decibel (dB) for the red and green stimuli, respectively. Stimuli were presented in a pseudorandom order across the 14 loci, with each light's intensity determined by an independent 4-2 staircase. The time at which each threshold was calculated was recorded independently for each locus. Measurement of scotopic thresholds from the 14 loci typically took approximately 3 minutes for each color.
Scotopic thresholds were analyzed in terms of absolute measurements of light (log sc cd/m2). The reference ranges of scotopic thresholds to the red and green stimuli were calculated at each retinal locus from the 95% confidence intervals of the control group (AMD group 0).
Measurement and Analysis of Dark Adaptation
Pupil size was measured in the dark under infrared illumination with a pupilometer built into a ColorDome ganzfeld (Diagnosys LLC, Lowell, MA, USA). Using the same ganzfeld, participants viewed a full-field background of 347 scotopic candelas per meter squared (sc cd/m2) for 5 minutes that was calculated to produce a 30% rhodopsin bleach (see Appendix). After cessation of the background light, the DAC stopwatch was restarted, the fellow eye patched, and the participant returned to the chin rest on the Medmont DAC perimeter.
Dark adaptation was measured from eight retinal locations, 4°, 6°, 8°, and 12° eccentricity, along the vertical meridian (Fig. 1). Two minutes after the bleach, thresholds were measured in response to the red stimulus. Subsequently, at 4-, 6-, 9-, 12-, 15-, 18-, 21-, 24-, 27-, and 30-minute time points, thresholds were measured in response to the green stimulus. Testing at each time point took 75 to 90 seconds. At each time point, stimuli were presented in a pseudorandom order; each light's intensity was determined by an independent staircase, and the time at which each threshold was calculated was recorded independently for each locus.
Figure 2 shows an example of the fit of a dark adaptation curve to the recovery of threshold at two loci (4° and 12°). Details of the equation and curve-fitting procedure used for analyzing dark adaptation are described in the Appendix. Rod intercept time (RIT), defined as the time to detect a criterion stimulus of 0.005 scotopic cd/m2, has been widely used to assess dark adaptation in AMD.14–17,25–27 Using the scotopic to photopic conversion of 0.16 for the dominant wavelength of the green stimulus (505 nm),28 the equivalent photopic criterion threshold for the DAC is 0.0008 photopic cd/m2 or −3.1 log photopic cd/m2 (dotted line in Fig. 2). At the 12° locus, recovery to the criterion threshold occurred at 17.1 minutes (RIT12). In this case, although dark adaptation does occur at the 4° locus, the threshold at this retinal location never reaches criterion, and no RIT could be derived.
Figure 2.
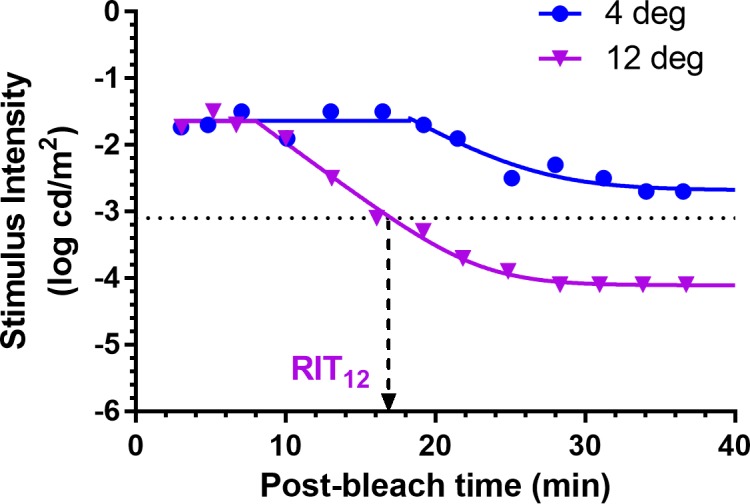
Examples of dark adaptation at two loci from an 89-year-old SDD participant with BCVA = 20/32. Curves are the fit of Equation A1 (Appendix) to the dark adaptation data. Rod intercept time (RIT) was defined as the time to detect a criterion stimulus of −3.1 log photopic cd/m2 (dotted line); at the 12° locus = 17.1 minutes. Dark adaptation occurred at the 4° locus but the threshold at this retinal location never reached criterion, and no RIT could be derived.
Structural Measurements of the Retina/RPE Complex and Choroid
An SD-OCT vertical B-scan centered on the fovea was analyzed at eight retinal eccentricities (4, 6°, 8°, and 12° superior and inferior) for the presence of the following:
Subretinal drusenoid deposits.
Interruption of the ellipsoid (EZ) band: EZ1, small/questionable discontinuity; EZ2, interruption < 125 μm; and EZ3, interruption with RPE atrophy.
Drusen: drusen 1, small (<63 μm); drusen 2, intermediate (63–124 μm); drusen 3, large (≥125 μm); drusen 4, drusen pigment epithelial detachment.
Results
Participant Demographics
Forty-four participants (aged 53–88 years) were enrolled in the study and 42 were included in the analysis. Two participants were excluded from analysis as on the day of dark adaptation testing they were found to have developed central geographic atrophy with visual acuities reduced to 20/160 and 20/250 in the study eyes. The study population was mostly white (n = 41, 93%), and 23 (52%) were women. Four subjects were pseudophakic in the study eye, one participant from each of AMD groups 0, 1, 2, and SDD. There was no significant difference in mean age (P = 0.26) of participants between AMD groups (Table 1). Similarly, there were no significant differences in mean best-corrected visual acuity (BCVA) (P = 0.61) or mean pupil size (P = 0.91) of study eyes between AMD groups (Table 1).
Table 1.
AMD Group Characteristics
Scotopic Thresholds
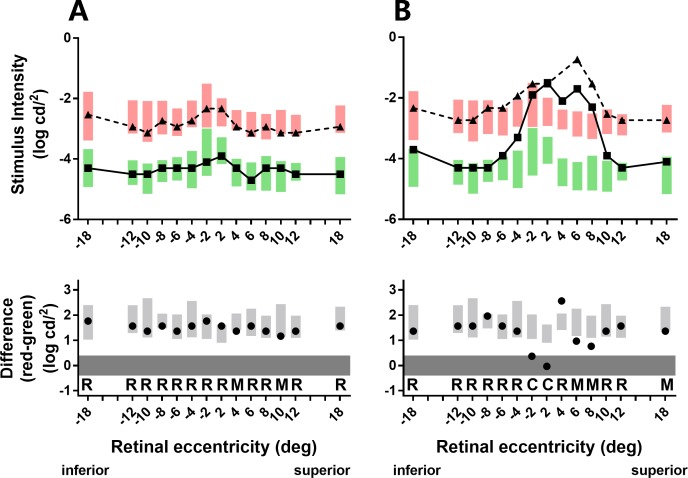
The upper parts of Figure 3 show scotopic thresholds from representative group 1 (Fig. 3A) and SDD (Fig. 3B) participants. For the group 1 participant, scotopic thresholds to both red (triangles) and green (squares) stimuli were within the reference ranges (shaded rectangles) across all loci. For the SDD participant, scotopic thresholds to both red and green stimuli were markedly elevated across the central macula (−4° to 8°). To investigate the relative function of rods and cones at a given locus, we used the principle of two-color, dark-adapted (2CDA) perimetry 22–24 to determine the difference in red and green thresholds, which reveals whether the responses are mediated by rods, cones, or a mix of rods and cones. The lower parts of Figure 3 show the threshold differences at each locus (black circles). For the group 1 participant (Fig. 3A), threshold differences predominantly lie within the reference range (light gray shaded rectangles), indicating that scotopic thresholds to both red and green stimuli were mediated solely by rods (loci indicated by “R”). For the SDD participant (Fig. 3B), the difference thresholds over the central 2° were near zero (dark gray band), indicating thresholds were mediated solely by cones (indicated by “C”). Both participants had difference thresholds that lay between the reference range and dark gray band, indicating mixed rod/cone thresholds (indicated by “M”) where scotopic thresholds to the green stimuli were mediated by rods and thresholds to the red stimuli were mediated by cones.22–24 From the participant's perspective, thresholds mediated by rods are perceived as white, and thresholds mediated by cones are perceived as the color of the stimulus.
Figure 3.
Scotopic thresholds to red (triangles and dashed lines) and green (squares and solid lines) stimuli and the difference between these two thresholds (circles) from participants representative of each rod function phenotype. Participants: (A) group 1, 68 years old, BCVA = 20/25; (B) group SDD, 78 years old, BCVA = 20/32. Green and red bars indicate the reference ranges (group 0; mean ± 2 SD) for the green and red stimuli, respectively; gray bars similarly indicate the reference range for the threshold differences (red minus green). The letters “R,” “C,” and “M” in the different parts of the figure indicate, respectively, whether scotopic thresholds at each eccentricity were mediated by rods only, cones only, or a mixed response of both rods and cones. Negative eccentricities correspond to the inferior retina, positive eccentricities to the superior retina.
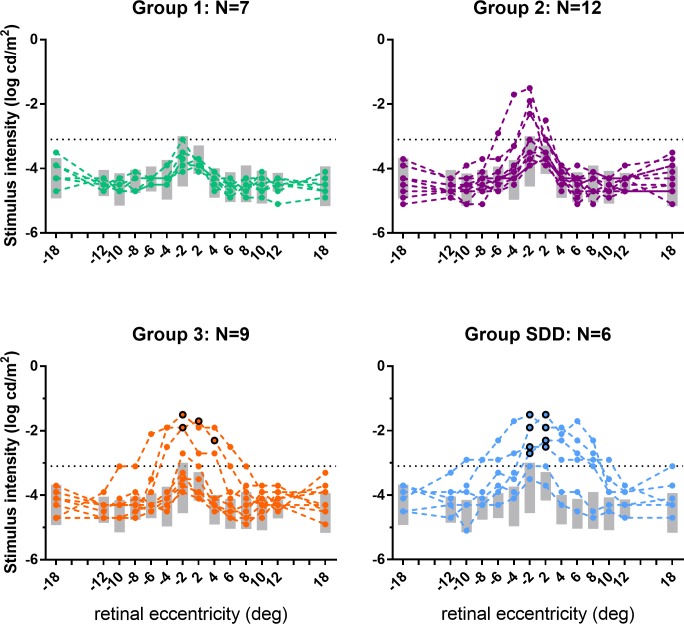
Figure 4 shows scotopic thresholds to the green stimulus from each participant in AMD severity groups 1, 2, 3, and SDD. Gray boxes show the reference range defined as mean threshold ± 2 SD from group 0. Relative to group 0 thresholds, group 1 did not have any eyes with elevated thresholds at two or more loci. However, scotopic thresholds were elevated at two or more loci in 4 of 12 (33%) group 2 participants, and the majority (>75%) of group 3 and SDD participants. Intragroup variability increased with AMD severity. Within the SDD group, four study eyes displayed elevated thresholds as far out as 12° to 18°, while thresholds from the two remaining study eyes were largely within the reference range. Two group 3 eyes and four SDD eyes had cone-only mediated thresholds mostly at the 2° loci (Fig. 4; circled symbols).
Figure 4.
Individual participant scotopic thresholds to the green stimulus (solid circles) plotted as a function of eccentricity for AMD severity groups 1, 2, 3, and SDD. Gray bars indicate the reference ranges (group 0 mean ± 2 SD) for the green stimuli. The black circles shown for group 3 and SDD indicate that scotopic thresholds to both red (not shown) and green stimuli were mediated solely by cones at these eccentricities (difference red–green thresholds ≤ 0.4 log cd/m2: see Supplementary Fig. S1). Negative eccentricities correspond to the inferior retina, positive eccentricities to the superior retina.
As in group 0 eyes, normal functioning should reveal rod-mediated thresholds at all test loci to both colored stimuli. We examined the number of loci that demonstrated a greater loss of rod function relative to cone function (i.e., demonstrate mixed or cone threshold responses) for each study eye across AMD groups (Supplementary Fig. S1). For all AMD groups, a greater percentage of mixed/cone thresholds were present in the macular loci (2°–6°) compared with the paramacular retina (loci at 8°–18°) (Supplementary Fig. S2). Within the central macula, the percentage of loci with mixed/cone thresholds averaged 13% for AMD groups 1 and 2, which doubled to 26% of loci for AMD group 3 and increased further to 50% of loci for SDD (Supplementary Fig. S2).
Dark Adaptation
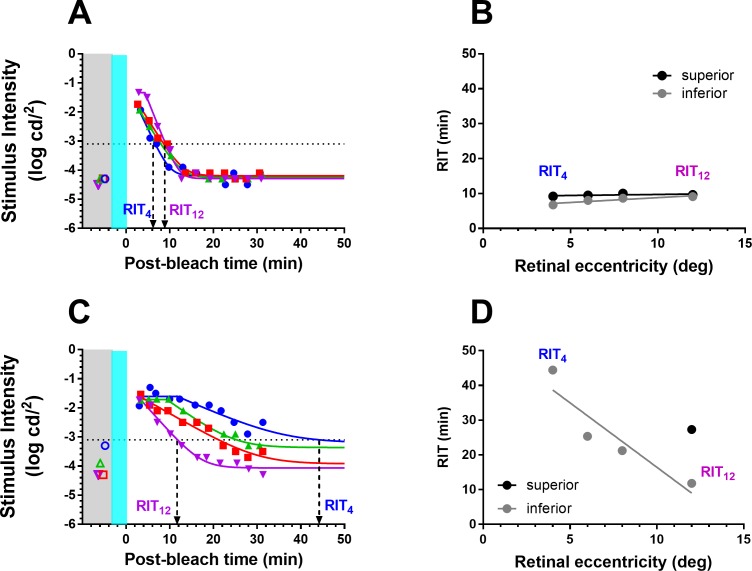
Figure 5 shows dark adaptation curves measured across four retinal eccentricities (4°, 6°, 8°, 12°) from representative group 1 (Fig. 5A) and SDD (Fig. 5B) participants. For the group 1 participant, dark adaptation was similar across all four eccentricities (Fig. 5A). For the SDD participant, dark adaptation occurred quickest at 12° eccentricity and became progressively slower with decreasing eccentricity (Fig. 5C). RIT was used to compare dark adaptation between AMD severity groups. The derived RITs at 12° (RIT12) and 4° (RIT4) are indicated for the two participants with dashed arrows.
Figure 5.
Measurement of dark adaptation across four retinal eccentricities for the same group 1 (A) and SDD (C) participants from Figure 3. Solid lines are the fits of Equation A1 (Appendix). Colored open symbols in the gray region show the scotopic thresholds recorded at the same retinal eccentricity as dark adaptation. The gray and teal regions illustrate time of the measurement of scotopic threshold and delivery of the bleach, respectively. They are for graphic illustration only and are not drawn to scale. The black dotted line indicates the criterion stimulus intensity (−3.1 log cd/m2) used for calculation of RIT (Equation A2, Appendix). Derivation of RIT at 4° (RIT4) and 12° (RIT12) is indicated by the downward arrows. (A) RIT4 = 6.7 minutes; RIT12 = 9.1 minutes; (C) RIT4 = 44.5 minutes; RIT12 = 11.8 minutes. (B, D) RIT plotted as a function of retinal eccentricity for the two participants. RITslope was derived from the linear fit (lines) of RIT versus retinal eccentricity. Black and gray symbols/lines indicate data from the superior and inferior retina, respectively. RIT could be derived only at 12° in the superior retina for the participant shown in (D).
For some loci in certain study eyes, RIT could not be determined as the thresholds did not recover to the criterion level (Fig. 2). Across AMD groups, we found that there were more points that did not reach criterion in group 3 and SDD (25%) than in groups 0 to 2 (<1%). In looking at the distribution of these loci among group 3 and SDD eyes, we found that the superior SDD had a considerably higher number (1.5- to 3-fold) of loci where RIT could not be derived compared with the inferior retina (Supplementary Fig. S3). As a result, we focused our analyses of dark adaptation on measurements from the inferior retina.
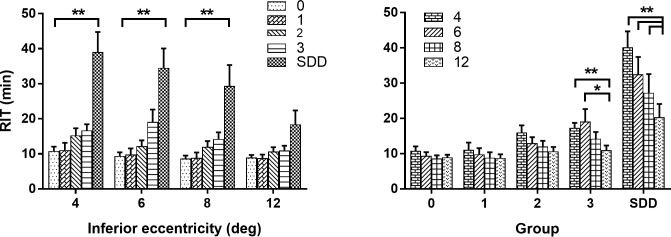
Figure 6 plots mean RIT as a function of retinal eccentricity (Fig. 6A) and AMD group (Fig. 6B). For each test locus, mean RIT increased as a function of AMD group severity (Fig. 6A). An analysis correlating RIT with AMD and eccentricity reveals a significant effect of both AMD and eccentricity on RIT (2-way ANOVA of RIT with AMD group and eccentricity P < 0.0001 for all). Post hoc analysis indicated significantly longer mean RIT for the SDD group relative to the control group at 4°, 6°, and 8° eccentricity (P < 0.0001 for all). For all AMD groups, mean RIT increased as a function of decreasing retinal eccentricity (Fig. 6B). The effect of eccentricity on mean RIT became more pronounced with increasing AMD severity. Relative to mean RIT at 12° eccentricity, post hoc analysis indicated significantly lower mean RITs at 4° and 6° for group 3, and 4°, 6°, and 8° for SDD (Fig. 6B). A qualitatively similar pattern of results was observed for mean RIT values from the superior retina (Supplementary Fig. S4). In addition to the AMD severity groupings described in Table 1, we also examined RIT with regard to an alternative AMD severity scale.29 Increasing simplified severity score was also associated with increasing mean RIT (Supplementary Fig. S5).
Figure 6.
RIT shown as a function of inferior retinal eccentricity and AMD group. (A) Mean RIT plotted as a function of eccentricity from the inferior retina and stratified by AMD severity group (see legend). Post hoc comparisons to group 0 by eccentricity: **P < 0.0001. Number of subjects with data at all eccentricities for 2-way ANOVA were group 0, n = 8, group 1, n = 7, group 2, n = 11, group 3, n = 6, SDD, n = 4. (B) Mean RIT plotted as a function of AMD severity group and stratified by inferior retinal eccentricity (see legend). Post hoc comparisons of RIT at 4°, 6°, and 8° relative to 12° by group; *P = 0.0015, **P = 0.0001; errors bars in both graphs indicate standard error of the mean (SEM).
We define a parameter RITslope to characterize the change in RIT with decreasing retinal eccentricity evident in Figure 6B. RITslope is the linear fit of the plot of RIT as a function of decreasing retinal eccentricity (Figs. 5B, 5D). For the group 1 participant, RITslope was close to zero, as RIT varied minimally with eccentricity (Fig. 5B). The SDD participant had an RITslope of −3.7 min/deg reflecting the 4-fold increase in RIT from the test locus at 12° to the test locus at 4° (Fig. 5D). Hereafter, we analyze and report RITslope as an absolute value so that larger values of RITslope indicate a greater increase in RIT with decreasing eccentricity.
Figure 7 shows that mean RITslope increases as a function of AMD severity (ANOVA: P < 0.0001). Post hoc analysis indicates significantly higher mean RITslope for the SDD group relative to groups 0, 1, and 2 (P = 0.0001 for all); group 3 RITslope was also significantly greater than for group 0 (P = 0.008). Mean RITslopes (±SD) for the study groups were as follows: group 0, 0.21 ± 0.24 min/deg; group 1, 0.27 ± 0.49 min/deg; group 2, 0.59 ± 0.49 min/deg; group 3, 1.54 ± 1.33 min/deg; group SDD, 2.81 ± 0.74 min/deg. A qualitatively similar pattern of results was observed for RITslope values from the superior retina (Supplementary Fig. S6). Mean RITslope also increases with AMD severity when the study eyes are graded using the simplified severity score as an alternative grading system (Supplementary Fig. S7).
Figure 7.
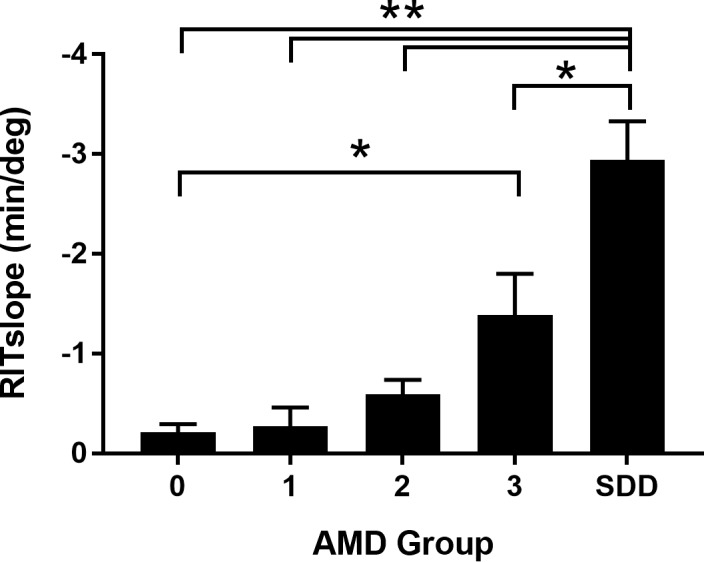
Bar graph showing mean RITslopeInf for each AMD severity group. Comparisons to group SDD: **P = 0.0001; *P = 0.002; comparison of group 3 to group 0: *P = 0.008. Number of subjects in whom RITslopeInf could be calculated: group 0, n = 8, group 1, n = 7, group 2, n = 11, group 3, n = 8, SDD, n = 5. Error bars indicate SEM.
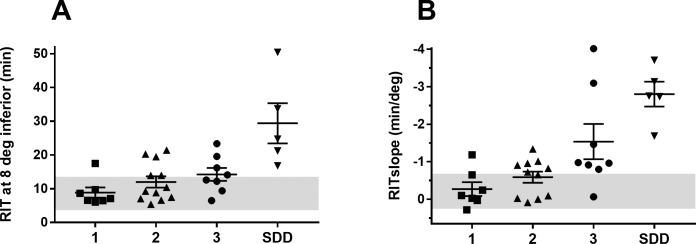
We sought to determine whether RIT or RITslope could better distinguish the differences in dark adaptation between our AMD groups. We compared RITslope from the inferior retina (RITslopeInf) with RIT at inferior 8° eccentricity (RIT8Inf). This inferior eccentricity was chosen to provide a balance between obtaining a high number of participants with a measurable RIT and separation in mean RIT between AMD groups. Figure 8 shows the scatter plot of RIT8Inf (Fig. 8A) and RITslopeInf (Fig. 8B) plotted over the 95% confidence intervals of the mean from the control group (gray zones). Seven participants from both groups 2 and 3 had an RITslopeInf value outside the reference range (Fig. 8B). By comparison, a smaller number of group 2 (n = 3) and group 3 (n = 4) participants had RIT8Inf values outside their reference range (Fig. 8A). All SDD participants were outside the reference range for both RIT8Inf and RITslopeInf.
Figure 8.
Scatter plots showing RIT measured at 8° eccentricity from the inferior retina (RIT8Inf) (A) and RITslopeInf (B) for AMD groups 1, 2, 3, and SDD. Whiskers show mean ± SEM. The gray regions indicate the reference ranges defined by group 0 mean ± 2 SD for RIT8Inf and RITslopeInf.
Rod Function Phenotypes
Three rod function phenotypes emerged from the combined analysis of the scotopic thresholds and dark adaptation from all eight loci (4°, 6°, 8°, 12°) where both measures were recorded. Figure 9 shows example scotopic thresholds and dark adaptation from each phenotype; for clarity, data are shown at a single locus (4° inferior). For rod function phenotype 1 (RF1), scotopic thresholds and dark adaptation (i.e., RIT) were within their reference ranges (orange symbols/line). Rod function phenotype 2 (RF2) participants had normal scotopic thresholds but dark adaptation was delayed (blue symbols/line). For rod function phenotype 3 (RF3), both scotopic thresholds and dark adaptation were outside their reference ranges (green symbols/line). A given eye was categorized as RF2 if scotopic thresholds were normal but RIT was outside the reference range at two or more loci. An eye was categorized as RF3 phenotype if scotopic thresholds and dark adaptation were outside the reference range at two or more loci.
Figure 9.
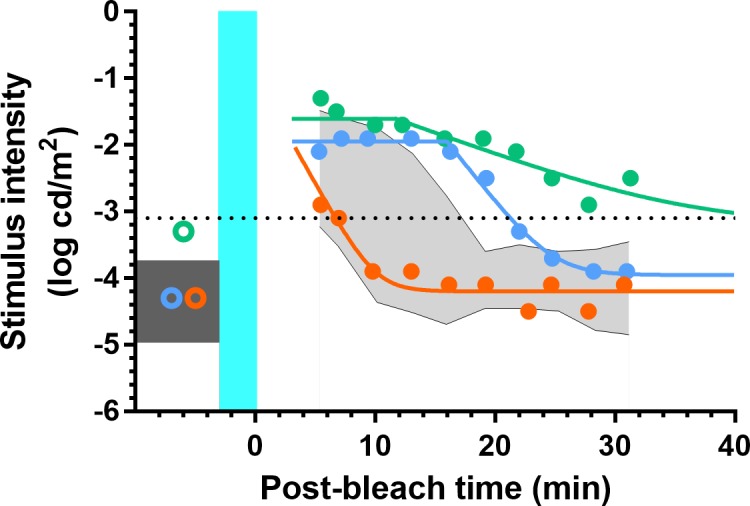
Scotopic thresholds and dark adaptation measured from the inferior retina at 4°. For the RF1 participant (orange), scotopic threshold was within the reference range (dark gray box) as was the rate of dark adaptation (reference range: shaded gray area). For the RF2 participant (blue), scotopic threshold was also within the reference range, but dark adaptation was delayed. For the RF3 participant (green), scotopic threshold was elevated outside the reference range and dark adaptation was clearly slowed. The teal region indicates the background bleaching light and is not drawn to scale. The black dotted line indicates the criterion stimulus intensity (−3.1 log cd/m2) used for calculation of RIT (Equation A2).
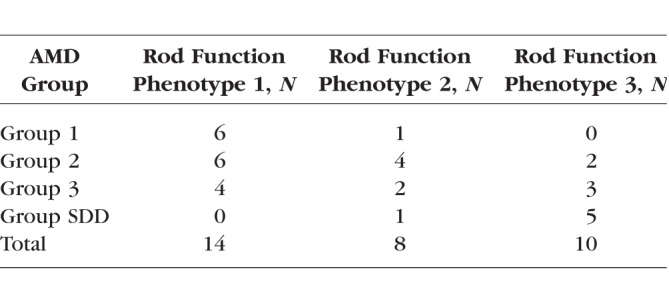
Table 2 shows the number of participants from each AMD group with each rod function phenotype. There is a clear trend for more severe AMD eyes to have a less normal rod function phenotype. Only one eye in group 1 has a rod function phenotype that is not RF1. Strikingly, all eyes in the SDD group have a rod function phenotype outside of RF1. However, Table 2 also highlights that different rod function phenotypes can be observed within a given AMD severity group.
Table 2.
Rod Function Phenotype by AMD Group
Association of Rod Function With Structural Measurements of the Retina/RPE Complex and Choroid
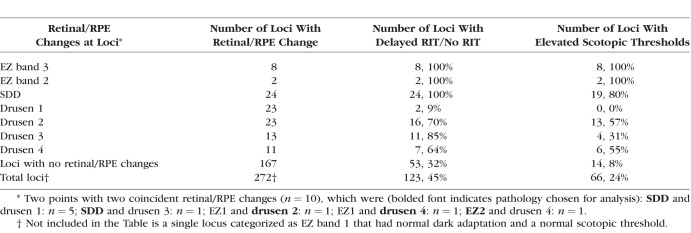
We sought to determine whether changes in scotopic thresholds and/or dark adaptation at individual loci could be explained by local structural changes in the retina/RPE complex. A total of 272 loci (34 participants × 8 loci) were examined from study eyes of groups 1, 2, 3, and SDD. Table 3 details the relationship between changes in retina/RPE structure and associated measurements of rod function at each locus. Disruption of the EZ band/RPE complex (EZ2 and EZ3) was associated with abnormal rod function at all loci with these changes. SDD were similarly associated with delayed dark adaptation (100% loci) and elevated thresholds (80% loci). Loci with intermediate or large drusen (drusen 2 and 3, respectively) or drusen with PED (drusen 4) were also strongly associated with delayed dark adaptation (64%–85%), but somewhat fewer of these loci were associated with elevated scotopic thresholds (31%–57%). Small drusen (drusen 1) were not associated with changes in rod function except at two loci (9%) that showed delayed dark adaptation. Notably, of the 167 loci without any of the retina/RPE structural changes listed above, dark adaptation was delayed at 53 (32%) loci and scotopic thresholds were elevated at 14 (8%) loci.
Table 3.
Rod Function and Retinal/RPE Changes by Retinal Locus
We also examined whether choroid thickness was associated with changes in scotopic thresholds and/or dark adaptation. Choroidal thickness measurements were made at 8° (superior and inferior) from a vertical SD-OCT B-scan recorded with enhanced depth imaging. Neither RIT nor RITslope was correlated with choroidal thickness (Supplementary Fig. S8).
Discussion
Participants with SDD or intermediate AMD display elevated scotopic thresholds and delayed dark adaptation within the macula. In the current study, dark adaptation was more affected than scotopic thresholds, results consistent with previous reports that examined both parameters in AMD.8,9,12,13 The high percentage of loci with mixed- and cone-mediated thresholds indicates greater loss of rod-mediated function relative to cone function across the central macula (2°–6°). Increasing AMD severity was associated with a greater proportion of loci with rod-mediated losses within this central macula. These results are consistent with histologic studies of AMD eyes that demonstrate preferential loss of rods over cones throughout the course of the disease.5–7 Our scotopic threshold results confirm and extend previous studies that have reported elevated scotopic thresholds across the perifoveal macula in AMD with the largest deficits closest to the fovea.8,9,18,21 RITslope analysis indicated dark adaptation was altered along a steep gradient across the macula with slower dark adaptation occurring nearest the fovea; RITslope increased with AMD severity. Our results are consistent with a previous report showing slower dark adaptation for central loci (4°, 6°) compared with more peripheral loci (12°) in patients with AMD or SDD.18
Steinmetz et al.8 reported changes in scotopic threshold and dark adaptation equivalent to our phenotypes RF2 and RF3 in 12 patients with age-related changes in Bruch's membrane who were symptomatic for poor vision in the dark. The current study and that of Steinmetz et al. indicate that rod function phenotype may provide an additional means to stratify AMD patients beyond imaging assessments. Whether rod function phenotype is a better predictor of disease progression than current AMD classification systems awaits further study.
We defined a new parameter, RITslope, that describes the spatial change in dark adaptation across the macula. RITslope may prove advantageous as an outcome measure in AMD as this parameter is still calculable in participants who fail to adapt to RIT criterion at a single retinal locus. In our small sample, RITslope was outside the reference range for a greater proportion of participants in AMD groups 2 and 3 than for RIT measured at 8° inferior. A larger study will be required to determine if RITslope is the more sensitive measure of dark adaptation in AMD.
In the present study, eyes with SDD had marked elevation of scotopic thresholds and dark adaptation was greatly slowed or absent, consistent with previous reports.16,18,20 All 24 loci with underlying SDD were associated with delayed dark adaptation, and most of these loci (80%) were associated with elevated scotopic thresholds. In vivo examination of SDD with adaptive optics imaging and postmortem histologic examination indicate morphologic changes in photoreceptors overlying SDD.30,31 The combined results establish SDD as a specific fundus phenotype, and strongly suggest a link between SDD and marked rod dysfunction.
SDD is a major risk factor for AMD progression distinct from drusen.32,33 Therefore, an imperative exists to develop a dark adaptation protocol that would enable longitudinal follow-up for SDD. Previous studies of SDD report that between 80% to 100% of study eyes did not reach criterion threshold to derive RIT within the allotted 20-minute18 to 40-minute16 test times. In the current study, the number of loci where RIT could not be derived in the allotted 30 minutes was highest for central loci (4°–8°), and this was particularly so for the superior retina of group 3 and SDD. Because so many SDD and group 3 participants fail to reach criterion threshold, future studies will need to consider testing more eccentric loci, longer test durations, elevated criterion thresholds, and lower rhodopsin bleaching for the most affected groups.
Our AMD severity groups 1, 2, and 3 were defined by the presence of large drusen and/or evidence of large drusen or advanced AMD in the fellow eye. Delays in dark adaptation correlate with drusen severity as defined by their size and number across the macula.34 While we found dark adaptation was delayed in over 60% of loci with our drusen grades 2 to 4, the presence of drusen alone did not predict changes in dark adaptation in AMD, a result consistent with previous studies.22,27,16 We also found delayed dark adaptation and elevated scotopic thresholds at 8% and 32% of loci, respectively, that had no evident changes in retina/RPE structure. Whether other structural changes may be observed at these loci with further advances in imaging remains an open question.
The classification of rod function phenotypes provides insight into the retinal mechanisms altered in AMD. The increase in scotopic thresholds that in part define phenotype RF3 could result from changes in rod outer segment structure (e.g., length, volume), a reduction in rhodopsin density, or a reduction in the number of rods.35,36 The delay in dark adaptation observed in phenotypes RF2 and RF3 may be attributable to either an abnormal supply of 11-cis-retinal to the RPE and/or transport of 11-cis-retinal from the RPE across the subretinal space to the rods.35,36 Owsley et al.9,17 outlined biological evidence for accumulation of lipids and the retaining of RPE-secreted lipoprotein particles by Bruch's membrane as structural changes that might slow the delivery of retinoid to the RPE and account for the delayed dark adaptation in AMD. The subretinal deposits characteristic of SDD could conceivably slow retinoid transport from the RPE to the rods.
An issue in testing both scotopic thresholds and dark adaptation on the same day is the length of testing. In preparation for the current study we estimated that 20 minutes of dark adaptation was sufficient to obtain maximum scotopic thresholds, if the participant's light exposure was carefully managed. For example, dilation drops were given just prior to the participant's being placed in the dark. Given the average ambient light in our waiting room (100 cd/m2), we calculated that a participant with natural pupils (2-mm pupil) would reach a steady-state level of bleaching of 2.5% of retinal rhodopsin,37 a small amount compared to the 30% bleach we used for measuring dark adaptation. Because 14 loci were examined, scotopic thresholds were calculated after an average 24.4 minutes (range, 21.1–30.5 minutes) of dark adaptation for the red stimuli and an average of 28.1 minutes (range, 24.7–35.5 minutes) of dark adaptation for the blue stimuli. Bland-Altman plots (Supplementary Fig. S9) were used to compare scotopic thresholds with the final thresholds (Tf) obtained from the fits of the dark adaptation curves (Appendix) at all loci. Bland-Altman plots demonstrated that scotopic thresholds and Tf were not different, and this was true across all loci for the range of AMD severities we tested. Mean (±SD) difference (Tf-scotopic threshold) was 0.113 ± 0.385 log cd/m2, which equates to a mean difference of just 1.1 dB. We conclude that maximal scotopic thresholds were achieved for the participants in this study.
A limitation of our study is the relatively small sample sizes for our groups. Also, our control group was defined by the absence of large drusen, and based on the AREDS report 17 grading scale38 would include AREDS step scale 3 or below, whereas others14,15,25,26,39 have defined healthy controls as AREDS group 1 or below. Whether differences in the dark adaptation parameters as a function of eccentricity could be differentiated between early AMD participants remains to be determined.
Supplementary Material
Acknowledgments
Presented at the annual meeting of the Association for Research in Vision and Ophthalmology, Baltimore, Maryland, United States, May 7–11, 2017.
The authors thank Katherine Hall, RN, for her help coordinating this study.
Supported by the National Eye Institute Intramural Research Program, National Institutes of Health, Bethesda, Maryland, United States.
Disclosure: O.J. Flynn, None; C.A. Cukras, None; B.G. Jeffrey, None
Appendix
Calculation of Rhodopsin Bleaching
Thomas and Lamb37 derived an equation that yields the fraction of rhodopsin bleached following exposure to a steady background light of a given duration and retinal illuminance. Using their Equation 4 and assuming an 8-mm pupil, a 30% partial bleach of rhodopsin was achieved following exposure to a full-field background for 5 minutes with a retinal illuminance of 1.242 log scotopic trolands (background light = 347 scotopic candelas per meter squared [sc cd/m2]). For calculation of fractional bleach, we assumed a time constant of 7 minutes for rhodopsin regeneration (τrh) and a bleach rate constant (log10LRh) of 7.0 log troland sec (Td-s) based on measurements from the parafovea (∼10°).40,41 Since delayed dark adaptation is a feature of AMD, we sought to determine the effect of a longer time constant of rhodopsin regeneration on rhodopsin bleaching levels. For the 5-minute background light exposure, even a 50% increase in time constant of rhodopsin regeneration would increase fractional bleach only slightly to 33% of rhodopsin. The activation of phototransduction, as measured from the bright flash a-wave, is not altered in AMD,42 suggesting that the bleach rate constant does not vary within the AMD population. Thus, we concluded that variation of these constants within the AMD population would not significantly alter the proportion of rhodopsin bleached.
The retinal illuminance (1.242 log sc Td) used to achieve a 30% rhodopsin bleach accounts for background light intensity and assumes a pupil size of 8 mm.28 Pupil size is an important determinant of retinal illuminance, and a 1-mm change in pupil diameter will increase/decrease absolute bleach level by approximately 6%; for example, with a 7-mm pupil, the partial rhodopsin bleach will be 24%. The time taken for rods to recover to a criterion level of retinal sensitivity during dark adaptation increases linearly with the size of the bleach for partial bleaches greater than 20%.34,35 Therefore, only participants who could be dilated to ≥6.3 mm (20% fractional bleach) were included in the study.
Derivation of Rod Intercept Time From Dark Adaptation Curve
We used the following modified version of the equation derived by Dimitrov et al.34 to describe the recovery of threshold following a bleach (Fig. 10):
 |
where T (log candela per square meter [log cd/m2]) is the threshold at time t (min) after cessation of the bleaching background. Derived parameters were  (log cd/m2), the asymptotic threshold; Ti (log cd/m2), the elevation in threshold above the asymptote prior to the rod–cone break;
  (min), the time to the rod–cone break; and R (decades/min), the rate of rod decay. The variable R represents the second component of dark adaptation described by Lamb.43 Equation A1 was fit to each participant's data for each eccentricity, producing eight curves.
Figure 10.
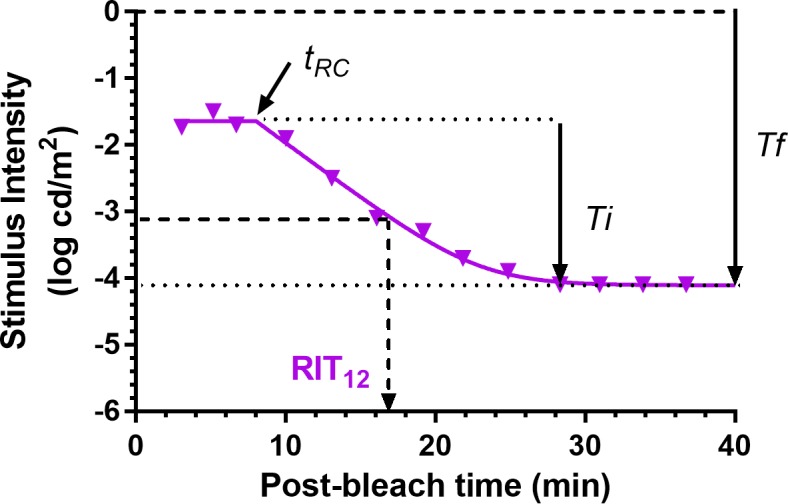
Dark adaptation curve showing the derivation of parameters from Equation A1. Derived parameters were  (log cd/m2), the asymptotic or “final” threshold; Ti (log cd/m2), the elevation in threshold above the asymptote prior to the rod–cone break;
  (min), the time to the rod–cone break. The recovery parameter R (decades/min) describes the rate of rod decay and can be thought of as the curvature of the fit. The black dotted line indicates the criterion stimulus intensity (−3.1 log cd/m2) used for calculation of RIT (Equation A2).
Rod intercept time (RIT), defined as the time to detect a criterion stimulus of 0.005 scotopic cd/m2, has been widely used to assess dark adaptation in AMD.14–17,25–27 Using the scotopic to photopic conversion of 0.16 for the dominant wavelength of the green stimulus (505 nm),28 the equivalent photopic criterion threshold for the DAC is 0.0008 photopic cd/m2 or −3.1 log photopic cd/m2. Rearranging Equation A1 and solving for the time to reach a criterion threshold of −3.1 log photopic cd/m2 gives:
 |
We used Equation A2 to derive RIT from all dark adaptation curves. RIT was measured as the time when the fitted adaptation curve crossed the RIT criterion threshold. If this criterion threshold was not reached during dark adaptation, T was constrained to the pre-bleach scotopic threshold. RIT could not be derived for participants who did not reach criterion threshold.
References
- 1. Hanus J, Zhao F, Wang S. . Current therapeutic developments in atrophic age-related macular degeneration. . 2016; 100: 122– 127. [DOI] [PMC free article] [PubMed] [Google Scholar]
- 2. Mangione CM, Gutierrez PR, Lowe G, Orav EJ, Seddon JM. . Influence of age-related maculopathy on visual functioning and health-related quality of life. . 1999; 128: 45– 53. [DOI] [PubMed] [Google Scholar]
- 3. Scilley K, Jackson GR, Cideciyan AV, Maguire MG, Jacobson SG, Owsley C. . Early age-related maculopathy and self-reported visual difficulty in daily life. . 2002; 109: 1235– 1242. [DOI] [PubMed] [Google Scholar]
- 4. Owsley C, McGwin G, Scilley K, Kallies K. . Development of a questionnaire to assess vision problems under low luminance in age-related maculopathy. . 2006; 47: 528– 535. [DOI] [PubMed] [Google Scholar]
- 5. Bird AC, Phillips RL, Hageman GS. . Geographic atrophy: a histopathological assessment. . 2014; 132: 338– 345. [DOI] [PMC free article] [PubMed] [Google Scholar]
- 6. Curcio CA, Medeiros NE, Millican CL. . Photoreceptor loss in age-related macular degeneration. . 1996; 37: 1236– 1249. [PubMed] [Google Scholar]
- 7. Schaal KB, Freund KB, Litts KM, Zhang Y, Messinger JD, Curcio CA. . Outer retinal tubulation in advanced age-related macular degeneration. Optical coherence tomographic findings correspond to histology. . 2015; 35: 1339– 1350. [DOI] [PMC free article] [PubMed] [Google Scholar]
- 8. Steinmetz RL, Haimovici R, Jubb C, Fitzke FW, Bird AC. . Symptomatic abnormalities of dark adaptation in patients with age-related Bruch's membrane change. . 1993; 77: 549– 554. [DOI] [PMC free article] [PubMed] [Google Scholar]
- 9. Owsley C, Jackson GR, Cideciyan AV,et al. Psychophysical evidence for rod vulnerability in age-related macular degeneration. . 2000; 41: 267– 273. [PubMed] [Google Scholar]
- 10. Jackson GR, Owsley C. . Scotopic sensitivity during adulthood. . 2000; 40: 2467– 2473. [DOI] [PubMed] [Google Scholar]
- 11. Jackson GR, Owsley C, McGwin G. . Aging and dark adaptation. . 1999; 39: 3975– 3982. [DOI] [PubMed] [Google Scholar]
- 12. Owsley C, Jackson GR, White M, Feist R, Edwards D. . Delays in rod-mediated dark adaptation in early age-related maculopathy. . 2001; 108: 1196– 1202. [DOI] [PubMed] [Google Scholar]
- 13. Dimitrov PN, Robman LD, Varsamidis M,et al. Visual function tests as potential biomarkers in age-related macular degeneration. . 2011; 52: 9457– 9469. [DOI] [PubMed] [Google Scholar]
- 14. Jackson GR, Scott IU, Kim IK, Quillen DA, Iannaccone A, Edwards JG. . Diagnostic sensitivity and specificity of dark adaptometry for detection of age-related macular degeneration. . 2014; 55: 1427– 1431. [DOI] [PMC free article] [PubMed] [Google Scholar]
- 15. Jackson GR, Clark ME, Scott IU, Walter LE, Quillen DA, Brigell MG. . Twelve-month natural history of dark adaptation in patients with AMD. . 2014; 91: 925– 931. [DOI] [PubMed] [Google Scholar]
- 16. Flamendorf J, Agrón E, Wong WT,et al. Impairments in dark adaptation are associated with age-related macular degeneration severity and reticular pseudodrusen. . 2015; 122: 2053– 2062. [DOI] [PMC free article] [PubMed] [Google Scholar]
- 17. Owsley C, McGwin G, Clark ME,et al. Delayed rod-mediated dark adaptation is a functional biomarker for incident early age-related macular degeneration. . 2016; 123: 344– 351. [DOI] [PMC free article] [PubMed] [Google Scholar]
- 18. Fraser RG, Tan R, Ayton LN, Caruso E, Guymer RH, Luu CD. . Assessment of retinotopic rod photoreceptor function using a dark-adapted chromatic perimeter in intermediate age-related macular degeneration. . 2016; 57: 5436– 5442. [DOI] [PubMed] [Google Scholar]
- 19. Dimitrov PN, Robman LD, Varsamidis M,et al. Relationship between clinical macular changes and retinal function in age-related macular degeneration. . 2012; 53: 5213– 5220. [DOI] [PubMed] [Google Scholar]
- 20. Laíns I, Miller JB, Park DH,et al. Structural changes associated with delayed dark adaptation in age-related macular degeneration. . 2017; 124: 1340– 1352. [DOI] [PubMed] [Google Scholar]
- 21. Sunness JS, Massof RW, Johnson MA, Finkelstein D, Fine SL. . Peripheral retinal function in age-related macular degeneration. . 1985; 103: 811– 816. [DOI] [PubMed] [Google Scholar]
- 22. Wald G, Zeavin BH. . Rod and cone vision in retinitis pigmentosa. . 1956; 42 4 pt 2: 253– 269. [DOI] [PubMed] [Google Scholar]
- 23. Massof RW, Finkelstein D. . Rod sensitivity relative to cone sensitivity in retinitis pigmentosa. . 1979; 18: 263– 272. [PubMed] [Google Scholar]
- 24. Jacobson SG, Voigt WJ, Parel JM,et al. Automated light- and dark-adapted perimetry for evaluating retinitis pigmentosa. . 1986; 93: 1604– 1611. [DOI] [PubMed] [Google Scholar]
- 25. Jackson GR, Edwards JG. . A short-duration dark adaptation protocol for assessment of age-related maculopathy. . 2008; 1: 7– 11. [DOI] [PMC free article] [PubMed] [Google Scholar]
- 26. Owsley C, Huisingh C, Jackson GR,et al. Associations between abnormal rod-mediated dark adaptation and health and functioning in older adults with normal macular health. . 2014; 55: 4776– 4789. [DOI] [PMC free article] [PubMed] [Google Scholar]
- 27. Owsley C, Huisingh C, Clark ME, Jackson GR, McGwin G. . Comparison of visual function in older eyes in the earliest stages of age-related macular degeneration to those in normal macular health. . 2015; 3683: 1– 7. [DOI] [PMC free article] [PubMed] [Google Scholar]
- 28. Wyszecki G, Stiles WS. . Color Science: Concepts and Methods, Quantitative Data and Formulae. 2nd ed. New York, NY: Wiley-Interscience; 2000. [Google Scholar]
- 29. Ferris FL, Wilkinson CP, Bird A,et al. Clinical classification of age-related macular degeneration. . 2013; 120: 844– 851. [DOI] [PMC free article] [PubMed] [Google Scholar]
- 30. Curcio CA, Messinger JD, Sloan KR, McGwin G, Medeiros NE, Spaide RF. . Subretinal drusenoid deposits in non-neovascular age-related macular degeneration: morphology, prevalence, topography, and biogenesis model. . 2013; 33: 265– 276. [DOI] [PMC free article] [PubMed] [Google Scholar]
- 31. Zhang Y, Wang X, Rivero EB,et al. Photoreceptor perturbation around subretinal drusenoid deposits as revealed by adaptive optics scanning laser ophthalmoscopy. . 2014; 158: 584– 596.e1. [DOI] [PMC free article] [PubMed] [Google Scholar]
- 32. Pumariega NM, Smith RT, Sohrab MA, Letien V, Souied EH. . A prospective study of reticular macular disease. . 2011; 118: 1619– 1625. [DOI] [PMC free article] [PubMed] [Google Scholar]
- 33. Finger RP, Wu Z, Luu CD,et al. Reticular pseudodrusen: a risk factor for geographic atrophy in fellow eyes of individuals with unilateral choroidal neovascularization. . 2014; 121: 1252– 1256. [DOI] [PMC free article] [PubMed] [Google Scholar]
- 34. Dimitrov PN, Guymer RH, Zele AJ, Anderson AJ, Vingrys AJ. . Measuring rod and cone dynamics in age-related maculopathy. . 2008; 49: 55– 65. [DOI] [PubMed] [Google Scholar]
- 35. Lamb TD, Pugh EN. . Dark adaptation and the retinoid cycle of vision. . 2004; 23: 307– 380. [DOI] [PubMed] [Google Scholar]
- 36. Curcio CA, Owsley C, Jackson GR. . Spare the rods, save the cones in aging and age-related maculopathy. . 2000; 41: 2015– 2018. [PubMed] [Google Scholar]
- 37. Thomas MM, Lamb TD. . Light adaptation and dark adaptation of human rod photoreceptors measured from the a-wave of the electroretinogram. . 1999; 518 pt 2: 479– 496. [DOI] [PMC free article] [PubMed] [Google Scholar]
- 38. Davis MD, Gangnon RE, Lee L-Y,et al. The Age-Related Eye Disease Study severity scale for age-related macular degeneration: AREDS Report No. 17. . 2005; 123: 1484– 1498. [DOI] [PMC free article] [PubMed] [Google Scholar]
- 39. Owsley C, McGwin G, Jackson GR, Kallies K, Clark M. . Cone- and rod-mediated dark adaptation impairment in age-related maculopathy. . 2007; 114: 1728– 1735. [DOI] [PubMed] [Google Scholar]
- 40. Rushton WA, Powell DS. . The rhodopsin content and the visual threshold of human rods. . 1972; 12: 1073– 1081. [DOI] [PubMed] [Google Scholar]
- 41. Alpern M, Pugh EN. . The density and photosensitivity of human rhodopsin in the living retina. . 1974; 237: 341– 370. [DOI] [PMC free article] [PubMed] [Google Scholar]
- 42. Jackson GR, McGwin G, Phillips JM, Klein R, Owsley C. . Impact of aging and age-related maculopathy on activation of the a-wave of the rod-mediated electroretinogram. . 2004; 45: 3271– 3278. [DOI] [PubMed] [Google Scholar]
- 43. Lamb TD. . The involvement of rod photoreceptors in dark adaptation. . 1981; 21: 1773– 1782. [DOI] [PubMed] [Google Scholar]
Associated Data
This section collects any data citations, data availability statements, or supplementary materials included in this article.


