 The structure of phosphorene resembles the honeycomb arrangement of graphene, but its layers are buckled and highly anisotropic.
Abstract
Nanomaterials have a high surface-to-mass ratio and their surface properties significantly affect their features and application potential. Phosphorene, a single layer of black phosphorus (BP), was the first homoatomic two-dimensional material to be prepared after the discovery of graphene. The structure of phosphorene resembles the honeycomb arrangement of graphene, but its layers are buckled and highly anisotropic. We studied how this difference affects the surface properties of BP, namely the free surface energy and adsorption affinity of various organic molecules. Using inverse gas chromatography, we measured the total surface free energy of BP powder to be 90 mJ m–2 and showed that it was dominantly determined by dispersion forces, but, unlike on graphene, with a notable contribution from specific acid–base interactions. We further measured adsorption enthalpies of volatile organic compounds on BP and rationalized them using density functional theory calculations. Polar molecules showed an increased affinity due to a significant contribution of dipole–dipole interactions to the molecule–surface bonding, because the buckled surface of BP causes higher diffusion barriers than those on graphene, hinders molecular in-plane motion and supports mutual orientation of molecular dipoles over longer distances, in contrast to graphene.
1. Introduction
Two-dimensional materials have been intensively studied over the last decade. Their unique chemistry and physics leads to their fascinating properties and huge application potential.1–5 Although the development started with graphene and its derivatives (such as graphane, fluorographene, and graphene oxide), it has recently been broadened by the addition of the huge family of transition-metal dichalcogenides, such as MoS2. Very recently, research has also been directed towards inorganic 2D materials, e.g. silicene, germanene and phosphorene.6–8
Phosphorene is a single layer derivative of bulk orthorhombic black phosphorus (BP).9 BP was first prepared by Bridgman10 in 1914 and remained a curiosity in materials science until 2014, when phosphorene became the first homoatomic 2D material to be isolated since the discovery of graphene.6,11 BP has a layered structure with individual layers held together by weak van der Waals forces, which facilitates exfoliation into phosphorene.12 The structure of phosphorene resembles the honeycomb structure of graphene in terms of its connectivity, but it is not planar. Instead, BP layers are buckled, giving rise to anisotropic bond angles and highly anisotropic properties within the basal plane. Unlike graphene, which is a zero band-gap semiconductor, phosphorene is a direct semiconductor exhibiting intrinsic p-type conductivity and a band-gap energy dependent on the number of layers.6,13 The band-gaps of BP and phosphorene are about 0.3–0.5 eV and 1.0–2.0 eV, respectively.14,15 Moreover, the electronic properties of phosphorene can be tuned by its covalent functionalization using nucleophilic reagents.16 The presence of a band-gap, its tunability and p-type conductivity with hole ballistic transport offer several advantages for electronic device construction in comparison with graphene.17,18 In addition, BP devices display carrier mobilities that vastly exceed those typical of a MoS2 transistor.6,19 Therefore, BP bridges the current gap between graphene and 2D semiconductors based on transition metal dichalcogenides, prompting enormous scientific interest in this material.20
BP is sensitive to the surrounding environment. This sensitivity is generally considered a disadvantage because the surfaces of 2D materials are prone to adsorption of various contaminants, which affects the real performance in applications. In contrast to the inert van der Waals nature of many layer-type materials (e.g. graphene and MoS2), which renders them hydrophobic, the reactivity of a BP surface in air is strongly influenced by its interaction with water. Pristine BP is hydrophobic, whereas oxidation by O2 turns the surface progressively hydrophilic.21 On the other hand, this sensitivity opens up applications in analytical chemistry. For example, a vapour sensor based on layered BP has been suggested to selectively detect methanol vapour22 and a field-effect transistor sensor device fabricated using 2D phosphorene nanosheets has been shown to exhibit ultrahigh sensitivity to NO2 in dry air that is dependent on its thickness.23 Therefore, it is desirable to assess the affinity of phosphorene to various molecules and airborne contaminants, such as volatile organic compounds, which are present in chemical labs and also in the daily environment. Thus, surface adsorption on phosphorene is of fundamental interest for its applications.
In this study, we assessed the surface energy and affinity of small molecules to the surface of BP by using inverse gas chromatography (iGC) and used density functional theory (DFT) calculations and molecular dynamics (MD) simulations to interpret the experimentally measured affinities. iGC is a surface characterization technique that can provide useful information about the surface nature, heterogeneity, etc.24–26 One advantage of this method is that the coverage of probe molecules on the surface can be readily controlled. iGC provides averaged information about the complete surface because it is based on the interaction of gas probes, which flow through the bed containing the studied material. Adsorption/desorption events result from the probe–surface interaction and affect the retention of the probe by the sample. Thus, we measured the surface free energy of BP and its dispersive and specific acid–base components from the retention times of n-alkanes and acid–base probes (see Materials and methods for details). We found that the surface energy of BP arises mainly from dispersive interactions but has also a considerable acid–base component, in contrast to other 2D materials, such as graphene and fluorographene, in which acid–base component is negligible. The adsorption enthalpies of non-polar molecules (benzene, dioxane and cyclohexane) were very similar to those measured on graphene, whereas polar molecules (acetonitrile, nitromethane and acetone) exhibited significantly higher affinity to BP than to graphene. We explained this discrepancy by showing that the barrier against surface diffusion of molecules on BP is almost four times higher than the barrier on graphene. Thus the surface potential of BP traps molecules and hinders their in-plane motion, which allows mutual orientation of molecular dipoles and induces a significant contribution of dipole–dipole interactions to the molecule–surface bonding. We modelled the surface behaviour of molecules directly using MD simulations. Molecules on a BP surface formed pronounced cluster chains across individual valleys of BP and were highly aligned with respect to each other. In an analogical simulation on graphene, the molecules formed one large cluster, but there was no preferential orientation of molecules within the cluster, i.e. the molecules interacted as randomly oriented dipoles.
2. Materials and methods
2.1. Theoretical calculations
The projector-augmented wave method, as implemented in the Vienna ab initio simulation package (VASP) suite, was used for the calculations.27,28 The energy cutoff for the plane-wave expansion was set to 400 eV. The interaction energy and forces were calculated by applying the optimized van der Waals functional optB86b-vdW,29 which encompasses both local and non-local electron–electron correlation effects, such as the London dispersive forces.30 The crystal structure of BP has eight atoms in the unit cell and orthorhombic symmetry (space group Cmca). The optB86b-vdW functional yielded lattice constants of this strongly anisotropic structure as a = 3.33 Å, b = 4.35 Å, and c = 10.49 Å, in good agreement with experimental values under standard conditions (a = 3.313 Å, b = 4.374 Å, and c = 10.47 Å).31 This agreement demonstrates the balanced description of covalent and non-covalent bonding in the optB86b-vdW functional, as also observed in our earlier study of various phases of TaS2.32
The surface of single-layer BP (aka phosphorene) was modelled by a 4 × 4 supercell (64 phosphorus atoms). The periodically repeated sheets were separated by at least 16 Å of vacuum, and a 3 × 3 × 1 k-point grid was used to sample the Brillouin zone. The forces between the surface and the molecule were fully relaxed. We tested the influence of dipole–dipole interaction between periodic images of molecules. We found that, first, the dipole corrections in VASP did not change the total energies (the total energies changed less than 1 meV) and, second, that the adsorption energies did not change on changing the size of a supercell (we tested 3 × 3, 4 × 4, 5 × 5 and 6 × 6 supercells). Thermal corrections for the enthalpy were taken from our previous work.30
MD calculations were carried out using the GROMACS 5.0 software33 using the OPLS-AA force field.34 Topologies of individual small molecules were taken from the GROMACS Molecule & Liquid database.35 Intermolecular interactions of phosphorene and graphene were treated using the potentials of Sresht et al.36 and Cheng and Steele,37 respectively, and truncated after 10 Å. Both surfaces were modelled as uncharged and periodic within the x–y plane (with a simulation box size of ∼120 × 100 × 200 Å) and were kept fixed in the centre of the box during the simulation. Periodic boundary conditions were applied in all three dimensions. To simulate the collective behaviour of molecules on the surfaces, 60 molecules were placed randomly into the upper half of the simulation box. The simulations were run with a 2 fs time step in the NVT ensemble at 100 and 300 K. Coordinates were stored for analysis every 20 ps. The total simulation time for cluster creation was 30 ns (the first 2 ns were used for equilibration). Clusters were defined using agglomerative hierarchical cluster analysis with a single-linkage criterion using a maximum cluster distance of 7.9 and 6.5 Å for acetonitrile and nitromethane, respectively.
2.2. Surface energy measurement using iGC
The surface energy was measured using probe solvents, whereby vapours were injected into a silanized glass column and carried through the sample bed. The concentration of each solvent transmitted through the column was recorded as a function of time at a flame ionization detector. The adsorption–desorption behaviour of the probes on a solid surface was evaluated from the retention time, tr. The retention time was used to calculate the net retention volume VN, which is a fundamental thermodynamic property of solid–vapour interactions, using Eqn (1):
 |
1 |
where j is the James–Martin correction factor for pressure drop, m is the mass of sample in the column, F is the carrier gas flow rate, t0 is the dead time (time taken for the non-interacting probe, methane in our case, to traverse the column), and T is the column temperature in K. The VN values can then be used to calculate the surface energy of the material, γ.
The total surface energy of a material, γt, consists of two components, the dispersive (γd) and acid–base surface energies (γab), i.e. γt = γd + γab. The dispersive surface energy of a material originates from the London (dispersion) interactions. We employed the temperature corrected Dorris and Gray method for calculating γd, which uses a series of n-alkanes as probes to measure the free energy of adsorption. The dispersive free energy of one methylene group (ΔGCH2) can be calculated from the slope of the alkane line by plotting the probe adsorption free energies versus carbon number n of the alkane probe:
 |
2 |
where T is the column temperature and ΔGCH2 is related to the work of adhesion of the methylene group, WCH2, which can be calculated from Eqn (3):
| ΔGCH2= –NAaCH2WCH2, | 3 |
where NA is Avogadro's number and aCH2 is the cross-sectional area of an adsorbed methylene group. Using Fowkes relation, WCH2 can be calculated as the geometric mean of the dispersive free surface energy and dispersive surface energy of a methylene group (Eqn (4)):
 |
4 |
where γdCH2 is the dispersive surface energy of a methylene group, which can be calculated as γdCH2 = 35.6 – 0.058t, where t is the temperature in °C.38 In our study, surface free energies were determined at 323 K. Combining Eqn. (2), (3), and (4) yields an equation for γd,ν (Eqn (5)), the isosteric dispersive surface energy of the solid sample:
 |
5 |
Hence, the retention volume was measured for a set of alkane probes and the isosteric surface energy calculated at a given surface coverageν using Eqn (5). This was repeated for a range of coverage values to generate a surface energy profile as a function of coverage. The acid–base component of the surface energy, γab, is associated with specific interactions between a probe and the surface, e.g. hydrogen bonding, and was determined using the van Oss–Good–Chaudhury (vOGC) approach39 with the Della Volpe scale.40 Dichloromethane was used as a monopolar acid probe and ethyl acetate was used as a monopolar basic probe to characterize the basic and acidic properties of the solid surface, respectively.41
2.3. Adsorption enthalpy measurements using iGC
Isosteric (at a given coverage υ) adsorption enthalpies ΔHad were determined using the Langmuir adsorption model42 by measuring partial pressures as a function of temperature T and fitting to Eqn (6):
 |
6 |
where K, υ, p, p0 and R are the equilibrium constant, coverage, pressure, standard pressure and universal gas constant, respectively. The data were fitted for a range of temperatures (listed in Table 1) at intervals of 10 K (i.e. for the range 30–90 °C; partial pressures used for the fit were recorded at 30, 40, 50, 60, 70, 80 and 90 °C).
Table 1. Adsorption enthalpies ΔHad of selected molecules on BP and graphene (G) measured by iGC (over the reported temperature range) and adsorption enthalpies of single molecules on a BP surface estimated from DFT calculations.
| Molecule | Exp. ΔHad on BP [kcal mol–1] | Temp. range [°C] | Calc. ΔHad on BP [kcal mol–1] | Exp. ΔHad on G a [kcal mol–1] |
| 1,4-Dioxane | –11.7 ± 0.6 | 30–90 | –12.1 | –10.8 ± 0.1 |
| Benzene | –11.9 ± 0.1 | 30–90 | –12.2 | –11.9 ± 0.3 |
| Cyclohexane | –11.2 ± 0.6 | 30–90 | –10.5 | –11.4 ± 0.3 |
| Acetone | –12.1 ± 0.2 | 40–90 | –9.3 | –8.2 ± 0.3 |
| Acetonitrile | –10.9 ± 0.1 | 40–90 | –7.2 | –7.6 ± 0.3 |
| Nitromethane | –10.3 ± 0.3 | 30–90 | –7.3 | –6.3 ± 0.1 |
| Tetrachloromethane | –8.2 ± 0.8 | 30–90 | –8.6 |
aiGC-determined values on graphene taken from ref. 30 and 47.
2.4. Experimental setup
Inverse gas chromatography was conducted using a surface energy analyzer, namely an SMS iGC-SEA 2000 instrument (Surface Measurement Systems Ltd, UK). The analyses were performed using 3 mm (internal diameter) silanized glass columns of length 30 cm filled with 686.3 mg of BP powder (ACS Material, LLC, CAS No.: 7723-14-0). Silanized glass wool was used to plug both ends of the columns containing the sample to prevent machine contamination. Injection of solvent vapours was controlled to pass a set volume of eluent through the column to give a pre-determined fractional coverage of the sample in the column. The solvents used for the adsorption measurements were as follows: n-hexane (Merck, for liquid chromatography, LiChrosolv®, ≥98%), heptane (Sigma-Aldrich, puriss. p.a., Reag. Ph. Eur., ≥99% heptane basis (GC)), octane (Sigma-Aldrich, analytical standard ≥99.7% (GC)), ethyl acetate (Lach-Ner, for HPLC, min. 99.8%), dichloromethane (Merck, for liquid chromatography, LiChrosolv®, ≥99.9%), nitromethane (Sigma-Aldrich, for HPLC, Chromasolv, ≥96%), acetone (Merck, for liquid chromatography, LiChrosolv®, ≥99.8%), acetonitrile (Lachner, for HPLC, ≥99.9%), benzene (Sigma-Aldrich, Chromasolv Plus for HPLC, ≥99.9%), cyclohexane (Sigma-Aldrich, for HPLC, ≥99.7%), 1,4-dioxane (Sigma-Aldrich, Chromasolv Plus, for HPLC, ≥99.5%) and carbon tetrachloride (Sigma-Aldrich, Chromasolv, for HPLC, ≥99.9%). Helium was used as the carrier gas at a flow rate of 10 sccm. The column temperature was controlled using the instrument oven with a declared stability of ±0.1 °C. The retention volumes of the probes were calculated from peak centres of mass in primary chromatograms and methane was used for the dead time estimation. Measurements were repeated for different surface coverages νi ranging from 0.25 to 20% of a monolayer. Saturated probe vapours were injected into the column and the injection time was adjusted to achieve the targeted surface coverage. The required injection time was calculated from the targeted surface coverage, known surface area of BP (Kr specific surface area of 2 m2 g–1), adsorbate vapour tension at 50 °C and adsorbate cross-sectional area using the Cirrus Control Software advanced version 1.4.1.0 (Surface Measurement Systems Ltd, UK). Surface thermodynamic properties were calculated using the Dorris and Gray method and the vOGC method with the Della Volpe scale from the primary data using the Cirrus Plus Software advanced version 1.4.1.0 (Surface Measurement Systems Ltd, UK).
2.5. Scanning electron microscopy
A Hitachi SU6600 scanning electron microscope (SEM) with an accelerating voltage of 5 kV was used for recording SEM micrographs of BP. A dry sample was placed on a carbon grid support attached via double-sided conductive carbon tape to an aluminium holder. Electron Dispersive Spectrometry (EDS) was performed at an accelerating voltage of 15 kV for 300 seconds with a NANOTRACE detector and a NORAN System 7 Analyzer (Thermo Fisher Scientific).
3. Results and discussion
3.1. Surface energy
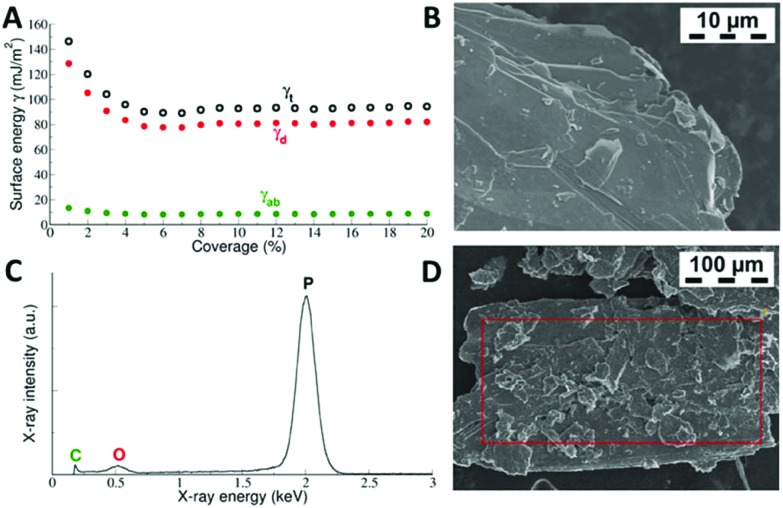
The total surface free energy γt and its dispersive γd and acid–base γab components were found to depend on the surface coverage (Fig. 1). Plots of γ vs. coverage had a slightly concave shape, where the surface energy decreased with increasing probe coverage. At a low surface coverage of 1%, the total surface energy reached a value of 146 mJ m–2, whereas at a surface coverage of 5%, it had decreased to 90 mJ m–2 and then remained fairly constant thereafter. This saturated value of the surface energy translates into the gas-phase exfoliation energy of 180 mJ m–2 for BP, because the exfoliation energy equals twice the surface energy when the same surfaces are created after exfoliation. Similar profiles of surface energy were observed in previous studies of graphite,43 graphite fluoride44 and MoS2.45 The higher surface energy at low coverage was attributed to the fact that at low coverage, the probes adsorbed at sites with high surface energy (high-energy sites). Surface irregularities, e.g. steps, edges, and cavities, usually represent high-energy sites in layered vdW materials,46–48 as can be seen in the SEM micrographs of the studied BP (Fig. 1). Therefore, the surface energies measured at low coverage are likely influenced by intermixing of adsorption on high-energy sites and basal plane adsorption.46 It should be mentioned that although it is possible to make measurements at even higher surface coverage than that used here, we expect that under such conditions, mutual interaction of the probe molecules (i.e. switch to the BET regime) would disrupt the measured surface energy.42
Fig. 1. Panel A: measured total surface free energy and its dispersive and acid–base components of BP as a function of surface coverage. γt denotes the total surface energy, whereas γd is the dispersive and γab the acid–base component. Panel B: SEM micrograph showing a flake of BP having lamellar structure with highly exposed basal plane surfaces and terraces. Panels C and D: EDS spectrum of the red-labelled area, showing that BP dominantly consists of phosphorus and a small amount of oxygen impurities.
The shape of the measured γ vs. coverage curve indicates that (1) the number of high-energy sites on BP is rather low because they influence γ only up to 5% coverage, and (2) their relative energy is rather high because the energy of 146 mJ m–2 at low coverage is higher than the respective energy measured by iGC on graphite.46,49 However, there was a distinct difference when comparing previous iGC experiments on layered materials. On BP, the acid–base component made a notable contribution to the surface free energy, amounting to ∼13% (Fig. 1), although the dispersive component was still dominant. In the case of graphite and graphite fluoride, the acid–base component was essentially zero and the surface free energy originate from dispersive interaction alone. The acid–base component arises from polar interactions beyond dispersion.24 The significant acid–base component on BP can be related to a recent theoretical study by Tománek et al., which demonstrated that the nature of the interlayer binding in BP is richer than simple van der Waals interaction.50 Instead, additional interlayer interaction is associated with significant charge redistribution between the in-layer and interlayer regions caused by the nonlocal correlation of electrons in adjacent layers. It should be noted that Tománek et al. studied the nature of the interlayer interaction in layered BP using quantum Monte Carlo calculations,50 which describe the correlation of electrons explicitly and treat covalent and dispersive interactions on the same footing.
3.2. Adsorption enthalpies of organic molecules
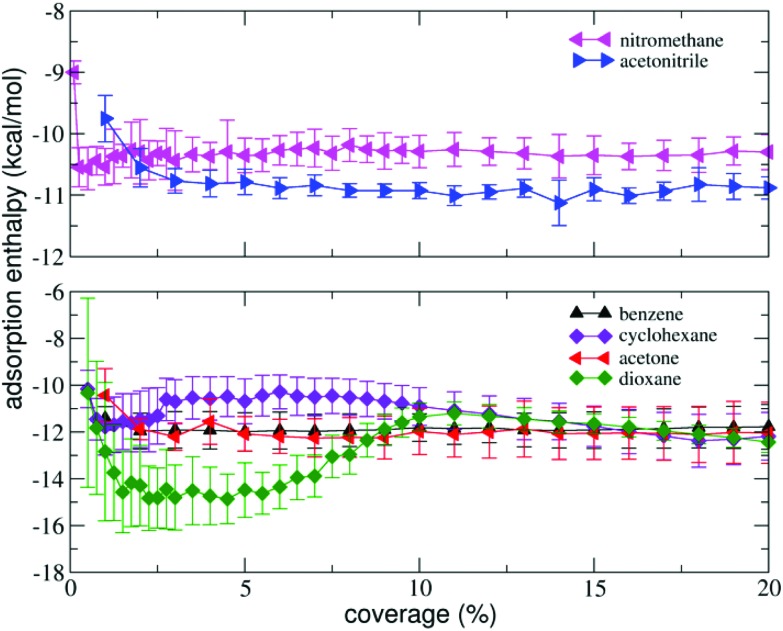
We measured the isosteric adsorption enthalpies of several volatile organic molecules to the surface of BP at coverages ranging from 0.25 to 20% of a monolayer (Fig. 2). The adsorption enthalpies of all molecules except dioxane exhibited weak dependence on the coverage over the entire range of coverages investigated. At very small coverages (0.25 to 1.00%), the adsorption enthalpies were slightly higher than those at larger coverages. This behaviour is similar to that observed in previous studies on graphene nanopowder that found that the adsorption enthalpies saturated rapidly (at coverages <1%).30,42 However, on graphite, a pronounced decrease of the adsorption enthalpies at low coverage was observed.42,49
Fig. 2. Isosteric adsorption enthalpies of volatile organic molecules as a function of surface coverage (in % of a monolayer).
The decrease was reasoned to be due to the adsorption of molecules into high-energy adsorption sites (e.g. steps and cavities46), which were present in the graphite powder in much higher amounts than in graphene nanopowder. In our case, the adsorption profiles (Fig. 2) suggest that the amount of high-energy sites in BP is lower than in graphite.
We further performed DFT calculations to obtain quantitative information about the adsorption energies of molecular monomers to the surface of BP. It should be noted that the calculations represented adsorption to a pristine and clean single layer surface, i.e. a surface without any oxidation. It should be noted that our test calculation for bilayer BP showed only a minor change of the adsorption energy. The magnitude of the adsorption energy was slightly increased for benzene (–15.2 kcal mol–1 compared –14.0 kcal mol–1 for single layer BP) but remained essentially the same for acetonitrile (–8.2 kcal mol–1vs. –8.4 kcal mol–1).
The results are summarized in Table 1 and show that the molecules could be divided into two distinct groups. The first group showed good agreement between theory and experiment and comprised 1,4-dioxane, benzene, tetrachloromethane and cyclohexane. For this group, the calculated and measured adsorption enthalpies agreed within one kcal per mol, which was roughly the expected accuracy of both experiment and theory. Notably, the adsorption enthalpies of these molecules were very similar to those previously measured for adsorption on graphene,47 indicating that they showed purely van der Waals character of bonding. In the second group of molecules (acetone, acetonitrile and nitromethane), there was a larger deviation between theory and experiment. In particular, the magnitudes of the measured adsorption enthalpies of acetone and acetonitrile were significantly higher than the magnitudes of the respective theoretical values and also the magnitudes of the values previously determined for graphene.
3.3. Effect of surface oxidation
A previous study by Ruoff et al.21 revealed that oxidation (by O2) can significantly change the properties of BP, including the chemical composition, electronic transport and (wetting) interaction with aqueous media. O2 adsorbs dissociatively on the BP surface, forming two dissociated chemisorbed O atoms. Calculations of the adsorption energy of a single oxygen atom suggested that the most stable position was in a so-called “lone pair” site, in which the O-orbital directly interacted with the lone electron pair of a surface P atom. In the next most favoured configuration, the O atom occupied an interstitial bridge site in-between two P atoms belonging to the upper and lower sublayers. The oxidation significantly affected adsorption of polar molecules, e.g. water formed one hydrogen bond to the lone pair oxygen (oxygen atom bound to the lone pair site). Therefore, we investigated the possibility of hydrogen bonding between molecules and a lone pair oxygen present on the surface of BP.
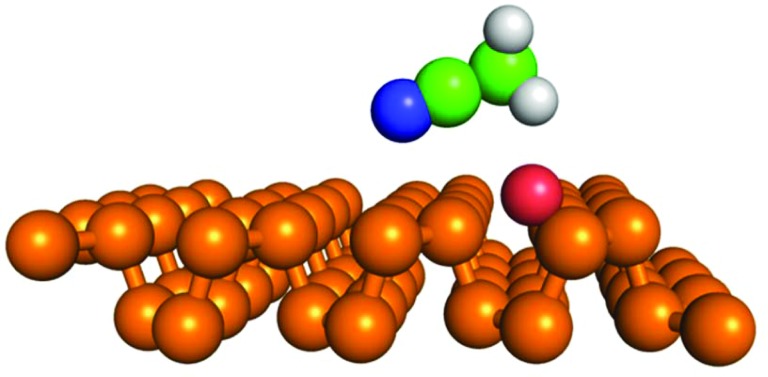
We considered the possibility of hydrogen bonding for acetone and acetonitrile, i.e. the molecules for which the measured adsorption enthalpy most exceeded its calculated value. For acetone, the formation of a hydrogen bond was thermodynamically unfavourable to adsorption onto a clean surface, whereas for acetonitrile, a hydrogen bond was present but the bond was too weak to influence the adsorption enthalpy. Acetonitrile bonded to the lone pair oxygen and the magnitude of the adsorption enthalpy of the resulting bond (–7.8 kcal mol–1) was marginally higher than that of the enthalpy of van der Waals bonding onto a clean surface (–7.2 kcal mol–1). The hydrogen-bonded acetonitrile molecule was oriented along the y direction with its C–N group slightly tilted towards the surface. The length of the C–H···O bond was 3.12 Å (Fig. 3). Nevertheless, the magnitude of the theoretical adsorption enthalpy was still much lower than that measured in the iGC experiment (–10.9 ± 0.1 kcal mol–1).
Fig. 3. Geometry of acetonitrile (N: blue, C: green and H: white spheres) bonded via a hydrogen bond (C–H···O, d(C–O) = 3.12 Å, α(C–H···O) = 131 deg.) to a lone pair oxygen (red sphere) adsorbed on the BP surface (phosphorus atoms are shown as gold spheres).
This type of hydrogen bonding is relevant in other contexts. Pumera et al. have recently reported22 that methanol molecules have a high affinity to a BP surface, which could be utilized in a selective device for methanol sensing based on an electrode modified with BP. We calculated the adsorption enthalpy of methanol on a clean surface of BP, but its value of –5.1 kcal mol–1 did not indicate any particular affinity of methanol towards BP. However, assuming that a lone pair oxygen was present at the surface, the methanol molecule was able to bind to the oxygen via a hydrogen bond and the affinity was significantly increased (–8.3 kcal mol–1). The C–H···O bond length was 2.85 Å, in which the H···O distance was 1.88 Å. This result suggests that surface oxidation of BP may affect the affinity of some molecules and may also complicate interpretation of the surface selectivity of BP-based sensing devices.
3.4. Surface diffusion and dipole–dipole interaction
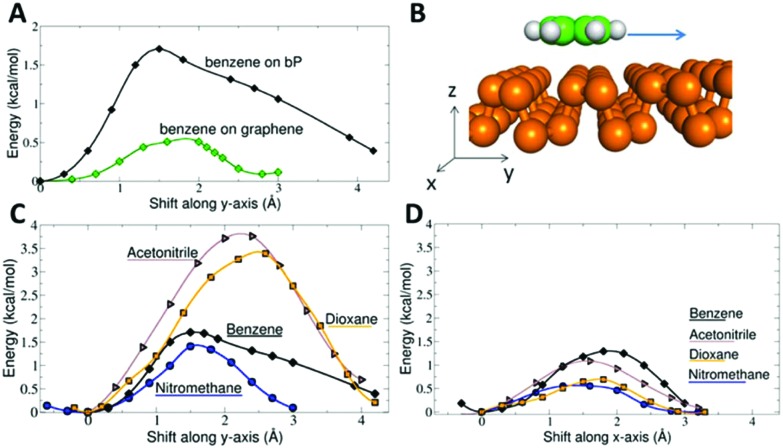
The puckered surface of BP significantly influences the surface diffusion of molecules. The barrier against surface diffusion of benzene was found to be almost four times higher than that on graphene (Fig. 4). The barrier was anisotropic, exhibiting a higher component along the y direction in which the BP structure is puckered. The barrier was around 1.5 kcal mol–1 for benzene and nitromethane, and more than 3 kcal mol–1 for acetonitrile and dioxane. The highest anisotropy occurred for acetonitrile and dioxane: their motion in the y direction was blocked by a barrier almost three times higher than that in the x direction. Note that the thermal energy RT at 300 K is 0.6 kcal mol–1. Thus, thermal motion at room temperature is not sufficient to overcome such diffusion barriers. In contrast, graphene features a very flat surface potential, which translates into a surface diffusion barrier of 0.5 kcal mol–1 for a benzene molecule (Fig. 4A). Our result agrees well with an earlier experimental study measuring frictional damping of the motion of benzene on a graphite surface.51 The observed motion was continuous, atomic-scale Brownian motion with an activation energy of 17 ± 12 meV (0.39 ± 0.28 kcal mol–1). Note that the observation of continuous Brownian motion was rather unique because the usual situation in surface studies is hopping diffusion dominated by corrugation of the energy landscape.51
Fig. 4. Surface diffusion barriers. Panel A compares the surface diffusion of benzene on graphene and single layer BP and shows the shift of the benzene molecule along the y-axis. Panel B shows the anisotropic structure of a single layer of BP puckered along the y-axis. Panels C and D display the surface diffusion barriers on single layer BP along the y and x directions, respectively.
Hence, the surface of BP shows significantly different properties from those of graphene. In contrast to superdiffusive motion on graphene, the molecules adsorbed on BP are trapped in ‘valleys’ created by its puckered structure and their translational as well as rotational degrees of freedom are hindered. Due to the hindered motion, molecules may appear ordered at a local level. Such ordering is particularly important for molecules possessing a dipole moment. Dipole–dipole electrostatic interactions can contribute to the net molecule surface bonding and in so doing increase the surface affinity of polar molecules.
The contribution of dipole–dipole interactions to the bonding on BP explains why the magnitudes of calculated adsorption enthalpies of acetonitrile and nitromethane were lower than the respective experimental values (Table 1). Among the molecules studied, the calculations seemed to underestimate the affinity of the polar molecules (acetonitrile, nitromethane, and acetone) towards BP. Acetonitrile has a large dipole moment of 3.9 D, whereas nitromethane and acetone have dipole moments of 3.5 and 2.9 D, respectively.
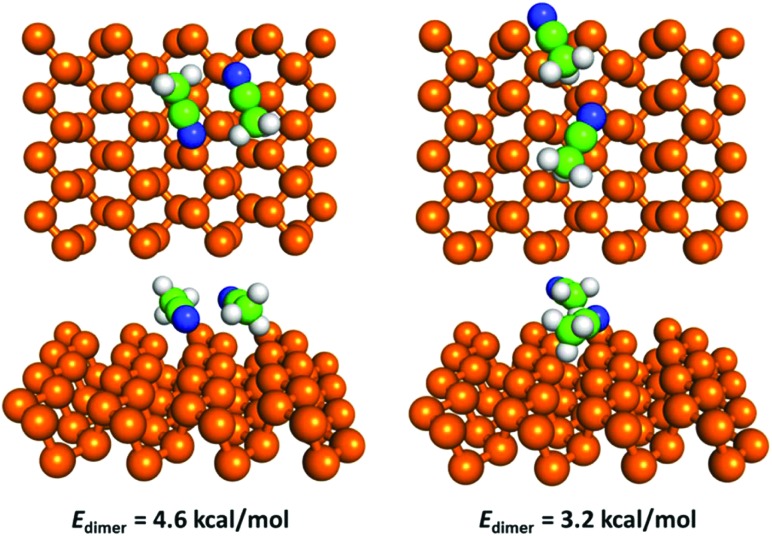
Hence, we modelled the dipole–dipole contribution to bonding of an acetonitrile dimer. We found that acetonitrile can form several dimer configurations on the surface. The most favourable was predicted to be an antiparallel configuration with the two central carbon atoms about 3.38 Å apart and two N···H contacts at a distance of about 2.5 Å (Fig. 5). The dimerization energy Edimer (i.e. energy of the adsorbed dimer compared to the energy of two adsorbed monomers) was 4.6 kcal mol–1 in this configuration. There are no reports of experimental measurements of the interaction energy of an acetonitrile dimer in the literature. However, an elaborate quantum-chemical study reported a dimerization energy of 4.9 kcal mol–1 calculated for an isolated acetonitrile dimer at the MP2 level.52 According to the latter study, the antiparallel configuration was the most favourable for an isolated dimer, and the reported bond distances for the central carbon atoms (3.5 Å) and two N···H contacts (2.6 Å) were in good agreement with our values. The dimer matched well with the surface potential of BP; when we removed the dimer from the surface and relaxed its geometry again, the energy gain (i.e. deformation energy due to surface adsorption) was negligible (<0.1 kcal mol–1).
Fig. 5. Geometry and dimerization energy of the two most favourable configurations of an acetonitrile dimer on the surface of BP.
Therefore, in summary, dipole–dipole interactions of adsorbed polar molecules contribute to the molecule–surface bonding and explain why the magnitude of the calculated adsorption enthalpies of isolated molecules (e.g. –7.2 kcal mol–1 for acetonitrile) were considerably lower than that of the respective measured values (–10.9 kcal mol–1 for acetonitrile). The calculated adsorption enthalpy of acetonitrile in a dimer configuration was –11.3 kcal mol–1, in excellent agreement with the experimental value. It should be noted that we assumed that the difference between the adsorption energy and enthalpy did not depend on the cluster size, i.e. it was the same for the monomer and dimer. In our previous study of clustering of ethanol on graphene, we found that the thermodynamic difference between the adsorption energy and enthalpy did not depend on the cluster size n up to n = 5 because the increase of zero-point energy corrections with n was compensated by the decrease of thermal correction with n arising from the increased rigidity of the clusters.42
The role of dipole–dipole interactions depends on the orientation of the molecular dipole moments with respect to a surface, as derived by Kokalj from an electrostatic model describing the adsorption of polar molecules.53 Adsorbed molecules with dipoles oriented perpendicular to the surface prefer to stay separated owing to repulsive electrostatic interactions.53 In contrast, for dipoles aligned parallel to the surface, as is the case of acetonitrile, nitromethane and acetone on BP, accumulation of molecules on the surface is anticipated, in line with the dimerization of acetonitrile predicted from our calculations.
It remains to be clarified why a similar effect of dipole–dipole interactions was not observed in previous studies of acetonitrile or nitromethane adsorbed on graphene.30,47 As Fig. 4A shows, graphene has a nearly flat surface potential and the surface diffusion barrier is not high enough to hinder thermal motion of the inspected molecules at room temperature. Thus, the molecules can freely move and rotate in two dimensions, and this behaviour was actually observed experimentally as thermally activated Brownian motion.51 Effectively, the molecules on graphene behave like a two-dimensional gas and the dipole–dipole interaction energy from randomly oriented dipoles (i.e. Keesom energy) is very low and does not contribute to the molecule–surface bonding. The clustering of molecules occurs even on graphene42 but only when the dimerization (clustering) energy is comparable to the adsorption energy of a molecule, which is clearly not the case for acetonitrile and nitromethane on BP. So the surface potential of BP, which traps the molecules, hinders their motion and promotes their local ordering, is the reason for the increased molecule–surface interaction of polar molecules.
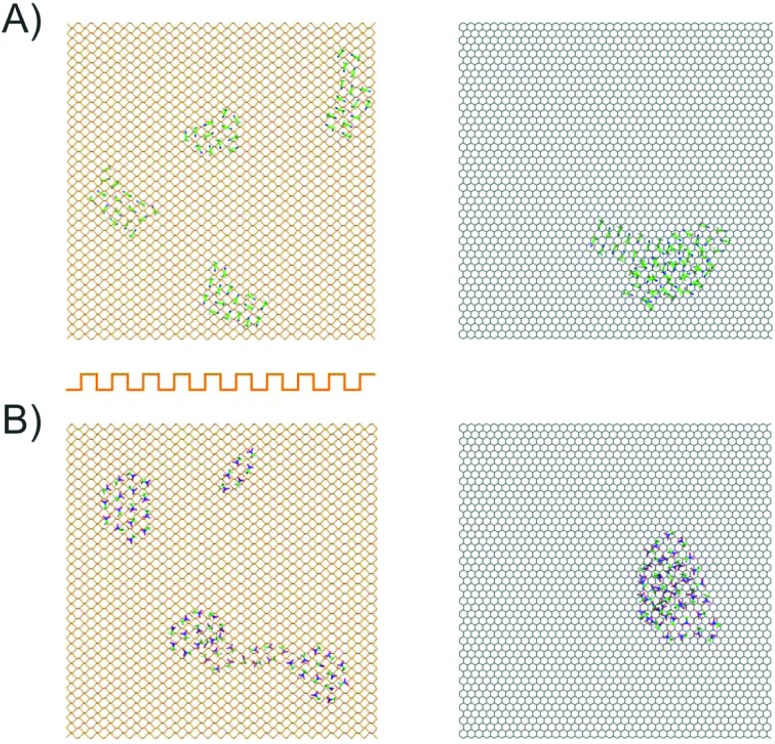
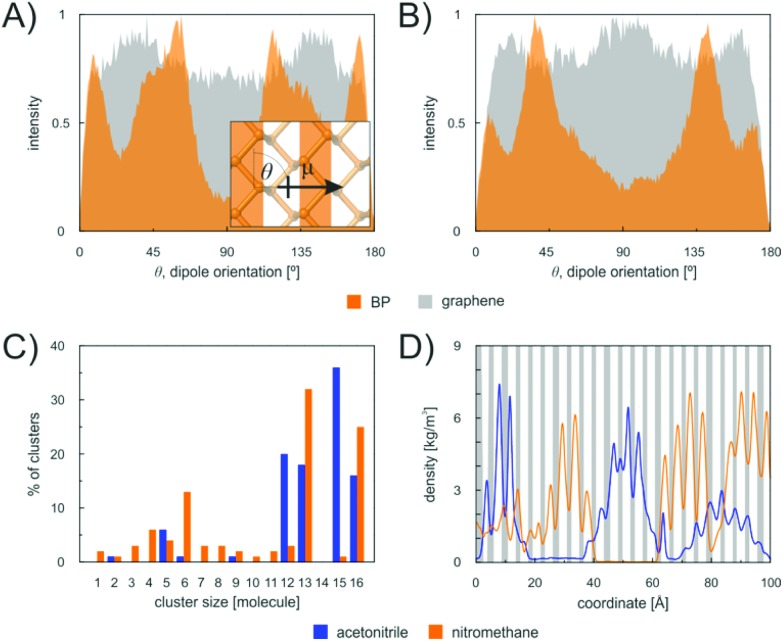
To corroborate this explanation of molecular behaviour, we performed MD simulation of acetonitrile and nitromethane on BP and graphene at a small surface coverage of ∼10%. At 100 K, the molecules on the BP surface formed pronounced cluster chains across the individual valleys of BP (Fig. 6). The molecules were highly aligned with respect to each other. The distribution of the orientation of dipole moments for nitromethane molecules showed one pronounced peak at an angle of 45 degrees (Fig. 7). The distribution obtained for acetonitrile revealed two preferred mutual alignments of the molecules, at 45 degrees and 60 degrees. The orientation of dipole moments coincided with the geometries of molecular dimers obtained from the DFT calculation (Fig. 5). Both acetonitrile and nitromethane formed predominantly large clusters (>12 molecules) with a minor portion of small clusters (of preferentially five and six molecules, respectively). On graphene, the molecules formed one large cluster owing to the ease of movement, but there was no preferential orientation of molecules within the cluster (Fig. 7). Such behaviour supports the idea of dipole–dipole interactions of randomly oriented dipoles on graphene presented above.
Fig. 6. Representative snapshots taken from MD simulations showing acetonitrile (A) and nitromethane (B) clustering on a single-layer BP (left) and graphene (right) surface at 100 K. The orientation (cross-section) of BP is indicated by the orange curve.
Fig. 7. Dipole orientation of acetonitrile (A) and nitromethane (B) molecules on a single layer of BP and graphene. Inset: schematic of the measured angle θ from the top view of the surface. (C) Cluster size distribution. (D) Distribution of the molecules of acetonitrile and nitromethane over the BP surface, indicating increased occurrence of the molecules above the valleys of the surface. The upper segments of the buckled BP are shown in grey.
At 300 K, both acetonitrile and nitromethane were predicted to move vigorously over the surface, forming temporarily small clusters. The preferential orientation of molecules on BP was significantly less pronounced than that at room temperature, indicating that the diffusion barriers were not high enough to hinder thermal motion at 300 K. However, it should be noted that although the diffusion barrier on BP was high enough to resist thermal motion at room temperature according to our DFT calculations (see above), the barrier was calculated for the ideal case (the adsorbed molecule was always in its local minima) and did not take into account the rotational degrees of freedom of the molecule diffusing over the surface.
4. Conclusions
We analyzed the surface properties of BP by iGC and determined the total surface free energy and its dispersive and acid–base components at surface coverages ranging from 1 to 20% of a monolayer. The saturated value of the total surface energy γt was 90 mJ m–2. The surface energy decreased with increasing probe coverage because the probes preferentially filled sites with high surface energy (high-energy sites) prior to adsorption onto the basal plane of BP. Similar behaviour was observed in earlier iGC studies of layered materials, such as graphene, graphite, fluorographene and molybdenum disulfide. Contrary to these materials, BP has a considerable acid–base component to the surface energy, which contributes about 13% to the total surface free energy. This finding agrees well with a recent study which demonstrated that, in addition to the expected van der Waals interaction, there was interlayer interaction due to charge redistribution between the in-layer and interlayer regions of BP.50
We further probed the surface by determining the isosteric adsorption enthalpies of six organic molecules to BP as a function of the surface coverage. The adsorption enthalpies of non-polar molecules (benzene, dioxane, and cyclohexane) were very similar to those measured on graphene, whereas polar molecules (acetonitrile, nitromethane, and acetone) had significantly higher affinity to BP than to graphene. This discrepancy was explained by noting that the barrier against surface diffusion of molecules on BP was predicted to be up to four times higher than the barrier on graphene. Thus, the surface potential of BP traps molecules and hinders their in-plane motion, which allows mutual orientation of molecular dipoles and increases the contribution of dipole–dipole interaction to the molecule–surface bonding.
Conflicts of interest
There are no conflicts to declare.
Acknowledgments
Financial support from the Ministry of Education, Youth and Sports of the Czech Republic via project LO1305 and the Grant Agency of the Czech Republic via project P208/12/G016 is gratefully acknowledged. Funding from the European Union's Horizon 2020 research and innovation programme to M. O. under grant agreement no. 683024 (ERC-CoG) is also gratefully acknowledged. We thank O. Tomanec for microscopy measurements.
References
- Xia F., Wang H., Jia Y. Nat. Commun. 2014;5:4458. doi: 10.1038/ncomms5458. [DOI] [PubMed] [Google Scholar]
- Qiao J., Kong X., Hu Z.-X., Yang F., Ji W. Nat. Commun. 2014;5:4475. doi: 10.1038/ncomms5475. [DOI] [PMC free article] [PubMed] [Google Scholar]
- Wang X., Jones A. M., Seyler K. L., Tran V., Jia Y., Zhao H., Wang H., Yang L., Xu X., Xia F. Nat. Nanotechnol. 2015;10:517. doi: 10.1038/nnano.2015.71. [DOI] [PubMed] [Google Scholar]
- Liu H., Du Y., Deng Y., Ye P. D. Chem. Soc. Rev. 2015;44:2732. doi: 10.1039/c4cs00257a. [DOI] [PubMed] [Google Scholar]
- Sofer Z., Sedmidubský D., Huber Š., Luxa J., Bouša D., Boothroyd C., Pumera M. Angew. Chem. 2016;128:3443. doi: 10.1002/anie.201511309. [DOI] [PubMed] [Google Scholar]
- Liu H., Neal A. T., Zhu Z., Luo Z., Xu X., Tománek D., Ye P. D. ACS Nano. 2014;8:4033. doi: 10.1021/nn501226z. [DOI] [PubMed] [Google Scholar]
- Vogt P., De Padova P., Quaresima C., Avila J., Frantzeskakis E., Asensio M. C., Resta A., Ealet B., Le Lay G. Phys. Rev. Lett. 2012;108:155501. doi: 10.1103/PhysRevLett.108.155501. [DOI] [PubMed] [Google Scholar]
- Bianco E., Butler S., Jiang S., Restrepo O. D., Windl W., Goldberger J. E. ACS Nano. 2013;7:4414. doi: 10.1021/nn4009406. [DOI] [PubMed] [Google Scholar]
- Gusmão R., Sofer Z., Pumera M. Angew. Chem., Int. Ed. 2017;56:8052. doi: 10.1002/anie.201610512. [DOI] [PubMed] [Google Scholar]
- Bridgman P. W. J. Am. Chem. Soc. 1914;36:1344. [Google Scholar]
- Das S., Zhang W., Demarteau M., Hoffmann A., Dubey M., Roelofs A. Nano Lett. 2014;14:5733. doi: 10.1021/nl5025535. [DOI] [PubMed] [Google Scholar]
- Li D., Del Rio Castillo A. E., Jussila H., Ye G., Ren Z., Bai J., Chen X., Lipsanen H., Sun Z., Bonaccorso F. Appl. Mater. Today. 2016;4:17. [Google Scholar]
- Tran V., Soklaski R., Liang Y., Yang L. Phys. Rev. B. 2014;89:235319. [Google Scholar]
- Li L., Yu Y., Ye G. J., Ge Q., Ou X., Wu H., Feng D., Chen X. H., Zhang Y. Nat. Nanotechnol. 2014;9:372. doi: 10.1038/nnano.2014.35. [DOI] [PubMed] [Google Scholar]
- Takao Y., Morita A. Physica B+C. 1981;105:93. [Google Scholar]
- Sofer Z., Luxa J., Bouša D., Sedmidubský D., Lazar P., Hartman T., Hardtdegen H., Pumera M. Angew. Chem., Int. Ed. 2017;56:9891. doi: 10.1002/anie.201705722. [DOI] [PubMed] [Google Scholar]
- Engel M., Steiner M., Avouris P. Nano Lett. 2014;14:6414. doi: 10.1021/nl502928y. [DOI] [PubMed] [Google Scholar]
- Du Y., Liu H., Deng Y., Ye P. D. ACS Nano. 2014;8:10035. doi: 10.1021/nn502553m. [DOI] [PubMed] [Google Scholar]
- Kang K., Xie S., Huang L., Han Y., Huang P. Y., Mak K. F., Kim C.-J., Muller D., Park J. Nature. 2015;520:656. doi: 10.1038/nature14417. [DOI] [PubMed] [Google Scholar]
- Lewis E. A., Brent J. R., Derby B., Haigh S. J., Lewis D. J. Chem. Commun. 2017;53:1445. doi: 10.1039/c6cc09658a. [DOI] [PubMed] [Google Scholar]
- Huang Y., Qiao J., He K., Bliznakov S., Sutter E., Chen X., Luo D., Meng F., Su D., Decker J., Ji W., Ruoff R. S., Sutter P. Chem. Mater. 2016;28:8330. [Google Scholar]
- Mayorga-Martinez C. C., Sofer Z., Pumera M. Angew. Chem., Int. Ed. 2015;54:14317. doi: 10.1002/anie.201505015. [DOI] [PubMed] [Google Scholar]
- Cui S., Pu H., Wells S. A., Wen Z., Mao S., Chang J., Hersam M. C., Chen J. Nat. Commun. 2015;6:8632. doi: 10.1038/ncomms9632. [DOI] [PMC free article] [PubMed] [Google Scholar]
- Ho R., Heng J. Y. Y. KONA Powder Part. J. 2013;30:164. [Google Scholar]
- Mohammadi-Jam S., Waters K. E. Adv. Colloid Interface Sci. 2014;212:21. doi: 10.1016/j.cis.2014.07.002. [DOI] [PubMed] [Google Scholar]
- Lapčík L., Otyepka M., Otyepková E., Lapčíková B., Gabriel R., Gavenda A., Prudilová B. Curr. Opin. Colloid Interface Sci. 2016;24:64. [Google Scholar]
- Blöchl P. E. Phys. Rev. B. 1994;50:17953. doi: 10.1103/physrevb.50.17953. [DOI] [PubMed] [Google Scholar]
- Kresse G., Joubert D. Phys. Rev. B. 1999;59:1758. [Google Scholar]
- Klimeš J., Bowler D. R., Michaelides A. Phys. Rev. B. 2011;83:195131. [Google Scholar]
- Lazar P., Karlický F., Jurečka P., Kocman M., Otyepková E., Šafářová K., Otyepka M. J. Am. Chem. Soc. 2013;135:6372. doi: 10.1021/ja403162r. [DOI] [PubMed] [Google Scholar]
- Brown A., Rundqvist S. Acta Crystallogr. 1965;19:684. [Google Scholar]
- Lazar P., Martincová J., Otyepka M. Phys. Rev. B. 2015;92:224104. [Google Scholar]
- Van Der Spoel D., Lindahl E., Hess B., Groenhof G., Mark A. E., Berendsen H. J. C. J. Comput. Chem. 2005;26:1701. doi: 10.1002/jcc.20291. [DOI] [PubMed] [Google Scholar]
- Jorgensen W. L., Tirado-Rives J. Proc. Natl. Acad. Sci. U. S. A. 2005;102:6665. doi: 10.1073/pnas.0408037102. [DOI] [PMC free article] [PubMed] [Google Scholar]
- van der Spoel D., Maaren V. P. J., Caleman C. Bioinformatics. 2012;28:752. doi: 10.1093/bioinformatics/bts020. [DOI] [PubMed] [Google Scholar]
- Sresht V., Pádua A. A. H., Blankschtein D. ACS Nano. 2015;9:8255. doi: 10.1021/acsnano.5b02683. [DOI] [PubMed] [Google Scholar]
- Cheng A., Steele W. A. J. Chem. Phys. 1990;92:3867. [Google Scholar]
- Shi B., Wang Y., Jia L. J. Chromatogr., A. 2011;1218:860. doi: 10.1016/j.chroma.2010.12.050. [DOI] [PubMed] [Google Scholar]
- Van Oss C. J., Good R. J., Chaudhury M. K. Langmuir. 1988;4:884. [Google Scholar]
- Volpe C. D., Siboni S. J. Colloid Interface Sci. 1997;195:121. doi: 10.1006/jcis.1997.5124. [DOI] [PubMed] [Google Scholar]
- Das S. C., Larson I., Morton D. A. V., Stewart P. J. Langmuir. 2011;27:521. doi: 10.1021/la104135z. [DOI] [PubMed] [Google Scholar]
- Karlický F., Otyepková E., Banáš P., Lazar P., Kocman M., Otyepka M. J. Phys. Chem. C. 2015;119:20535. [Google Scholar]
- Ferguson A., Harvey A., Godwin I. J., Bergin S. D., Coleman J. N. 2D Mater. 2017;4:015040. [Google Scholar]
- Lazar P., Otyepková E., Karlický F., Čépe K., Otyepka M. Carbon. 2015;94:804. [Google Scholar]
- Otyepková E., Lazar P., Luxa J., Berka K., Čépe K., Sofer Z., Pumera M., Otyepka M. Nanoscale. 2017;9:19236. doi: 10.1039/c7nr07342a. [DOI] [PMC free article] [PubMed] [Google Scholar]
- Lazar P., Otyepková E., Banáš P., Fargašová A., Šafářová K., Lapčík L., Pechoušek J., Zbořil R., Otyepka M. Carbon. 2014;73:448. [Google Scholar]
- Otyepková E., Lazar P., Čépe K., Tomanec O., Otyepka M. Appl. Mater. Today. 2016;5:142. [Google Scholar]
- Karlický F., Otyepková E., Lo R., Pitoňák M., Jurečka P., Pykal M., Hobza P., Otyepka M. J. Chem. Theory Comput. 2017;13:1328. doi: 10.1021/acs.jctc.6b01130. [DOI] [PMC free article] [PubMed] [Google Scholar]
- Ferguson A., Caffrey I. T., Backes C., Coleman J. N., Bergin S. D. Chem. Mater. 2016;28:6355. [Google Scholar]
- Shulenburger L., Baczewski A. D., Zhu Z., Guan J., Tománek D. Nano Lett. 2015;15:8170. doi: 10.1021/acs.nanolett.5b03615. [DOI] [PubMed] [Google Scholar]
- Hedgeland H., Fouquet P., Jardine A. P., Alexandrowicz G., Allison W., Ellis J. Nat. Phys. 2009;5:561. [Google Scholar]
- Cabaleiro-Lago E. M., Hermida-Ramon J. M., Pena-Gallego A., Martinez-Nunez E., Fernandez-Ramos A. J. Mol. Struct.: THEOCHEM. 2000;498:21. [Google Scholar]
- Kokalj A. Phys. Rev. B. 2011;84:045418. [Google Scholar]


