Summary
This article describes a simple method of measuring the number of viral genomes within viral factories. For this purpose, we use three DNA viruses replicating in the cytoplasm of the infected cells: wild-type African swine fever virus (ASFV)-Georgia 2007, culture-adapted type ASFV-BA71V, and Vaccinia virus (VV). The measurements are conducted in three steps. In the first step, after DNA staining, we evaluate Integrated Optical Density (IOD) of total DNA for each viral factory. The second step involves the calculations of the mass of DNA in the viral factories in picograms (pg). And, in the third step, by dividing the mass of DNA within viral factory by the weight of a single viral genome, we obtain the number of viral genomes within the factory.
Keywords: DNA virus, Feulgen staining, viral factory, virus quantification
Introduction
There are a number of methods that can be used for the evaluation of the virus concentration, number of viruses, or viral activity. The quantification of viral activity is called a virus titration. There are many ways of getting the virus titration: determine the ability of the virus to agglutinate red blood cells (RBC), cause the formation of cell loss in vitro, infect mice or other animals, infect chicken embryo, and so forth. For quantification of viruses, quantitative real-time PCR (qPCR) is a powerful tool, as it can quantify the amount of viral DNA or RNA present in a given sample. Also, direct counting of viral particles in solution can be done by transmission electron microscopy. ELISA evaluated the binding between viral particles and/or viral antigens to antibodies.1,2
It is obvious that some of these techniques require specialized equipment, some of these techniques are time-consuming, and some are useful for viral activity measurements, but not for virus number. Development of a sensitive, accurate, and simple method to detect changes in virus genome amount must address the problems and limitations associated with the foregoing technologies.
During the replication cycle of some DNA viruses,3,4 the formation of foci arises in the cytoplasm in which synthesis of viral nucleic acids, proteins, and virion assembly takes place. These assembles are viral factories that can be localized in the cytoplasm or in the nucleus of infected cells visualized under the light microscope.5
Estimating the number of viral genome copies within viral factories is an essential indicator for testifying the abilities of the replication cycle of DNA viruses. One of the promising approaches is the use of direct quantification of the viral DNA amount in viral factories. The aim of this work is to quantify and estimate the number of viral particles, copies of viral genomes within viral factories with the help of the Feulgen technique,6,7 and the method applicable for DNA viruses, producing viral factories in cytoplasm.
We emphasize that this quantification technique could be useful for the application of cytoplasm replicating DNA viruses.
Materials and Methods
Cells
Primary bone marrow cell (PBMC) culture was prepared from the thighs of 5 healthy piglets. The initial cell number was 106 cells/ml. Cells were cultivated in Roswell Park Memorial Institute (RPMI) 1640 (Sigma-Aldrich, Germany) medium supplemented with 10% FBS, L-glutamine, and antibiotics in 37C incubator with CO2 atmosphere.
Vero cells were maintained in MEM supplemented with 10% FBS and 0.8 mg/ml Geneticin (G418; Invitrogen; Thermo Fisher Scientific, Waltham, MA).
HeLa cells were maintained in DMEM supplemented with 10% FBS and 2% Penicillin/Streptomycin.
Viruses
In this study, we used wild-type African swine fever virus (ASFV)-Georgia 2007 distributed in the Republic of Georgia and the Republic of Armenia; the virus can only infect pigs in vivo and primary cells freshly isolated from pigs.8 Infectious titer of wild-type ASFV-Georgia 2007 was determined by the hemadsorption method described earlier.9 For this purpose, only wild-type ASFV-Georgia 2007 sensitive cell must be used, cells that are capable of adhering erythrocytes (usually porcine leukocytes) on their surface membrane upon infection. Therefore, to titrate wild-type ASFV-Georgia 2007, porcine leukocytes were infected in ten-fold dilution in 96-well plates. Infection was allowed until the characteristic rosette formation representing hemadsorption of erythrocytes around infected cells was formed. Then hemadsorption units (HADU)/ml were counted.
For experimental samples, infection with wild-type ASFV-Georgia 2007 was performed on primary bone marrow lymphoid cells by adding virus to the culture during cultivation. At 24 hr post-infection (hpi), cells were fixed and stained for further analyses. The titer of virus used for each experiment was 104 HADU/ml.
ASFV-BA71V is Vero cell-culture adapted wild-type ASFV-Georgia 2007 that was a kind gift from Prof. Yolanda Revilla. For investigation purposes, Vero cells were infected at a multiplicity of infection (MOI) of 0.5 tissue culture infectious dose (TCID)50/cell, fixed, and stained at 12 hpi, then analyzed.
Vaccinia virus (VV) samples were kindly provided by Prof. Wen Chang’s laboratory (IMB Academia Sinica; Taipei, Taiwan). In brief, HeLa cells were infected with the VV strain (VV hr CP77-GFP)10 at an MOI of 5 PFU/cell; at 6 hpi, cells were fixed and further analyzed. Infection time points of each virus were chosen according to previous studies. For wild-type ASFV-Georgia 2007, it was conducted at 24 hpi, for ASFV-BA71V at 12 hpi.11,12 For the VV strain, we know that the range of 2–8 hr post-infection is an optimal time to have viral factory,10 therefore, we chose the 6 hpi time point.
Staining Techniques
All cells either uninfected or infected were fixed and stained with Feulgen-Naphthol Yellow protocol described earlier.13 In brief, DNA hydrolyses were performed in 5N HCl, 60 min at 22С. After being rinsed in sulfite and distilled water, the samples were then put directly into a solution of 0.1% Naphthol Yellow S in 1% acetic acid (pH 2.8) for 30 min, thereafter were de-stained with 1% acetic acid 3 times for 0.5 min, then samples were dehydrated 3 times with tert-butanol, treated with xylol for 5 min.
Image Cytometry
The content of DNA in each sample was defined by computer-equipped microscope-photometer SMP 05 (OPTON, Germany), and images were collected at 575 nm wavelength. Quantity of DNA first was defined by image cytophotometry in conventional units (C.U.) described below.
Cytometric quantification of the DNA-staining of nuclear human cell Integrated Optical Density (IOD) is equivalent to human DNA content. For the quantification of DNA IOD, values were evaluated by comparison with those from cells with the known DNA content. Therefore, the DNA content is expressed in a “c” scale in which 1c is half (haploid) of the nuclear DNA content of cells from a normal (non-pathological) diploid population in G0/G1 cell cycle phase. Non-stimulated human lymphocytes (from healthy volunteers) were used as standards.14
The DNA amount within viral factory was calculated by routine image spectrophotometry measuring at least 300 viral factories for each case, which are detected as separate Feulgen positive formation in cytoplasm of infected cells. IOD evaluated from infected cell viral factories was compared with human diploid standard IOD. All experiments were repeated 3 times, and the average summarized data are presented.
Results
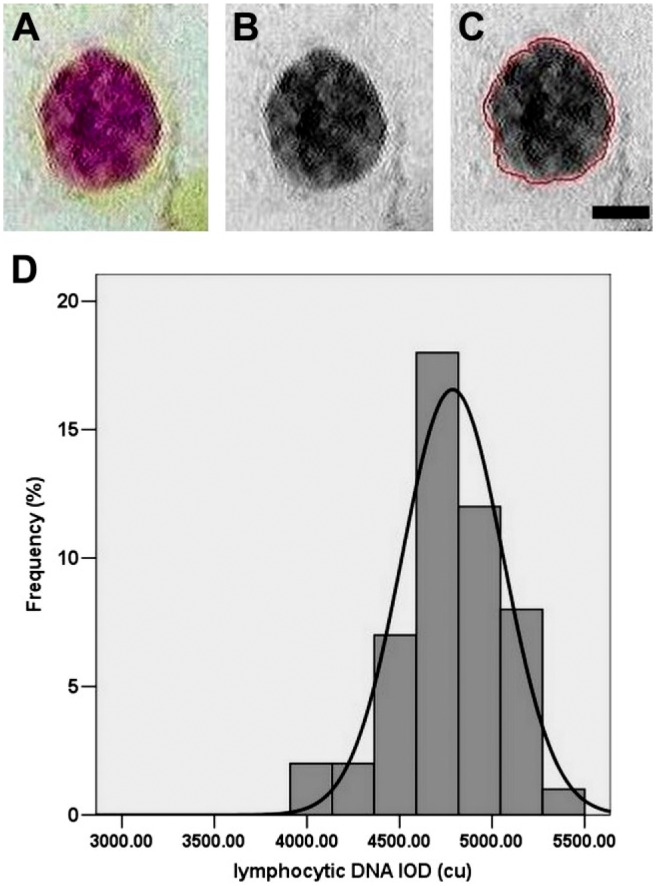
In an attempt to measure the viral genome within viral factories, we performed experiments using three known DNA viruses that replicate in the cytoplasm of infected cells, and their viral factories are formed at the appropriate time points of post-infection and are clearly visible under microscopic investigations. As a control for image cytophotometry or for DNA amount, we intended to do measurements in human diploid lymphocytic cells. Steps and distribution frequency of standard IOD values on human diploid cells are shown in Fig. 1A, B, and C, where Fig. 1A is after Feulgen staining (color), Fig. 1B is converted to gray scale to avoid the Naphthol yellow contamination, and Fig. 1C is marked clear nuclear for DNA evaluation. Then, we measured the distribution frequency and the mass of human diploid cells in IOD values as shown in Fig. 1D. This date will be used further for comparing with viral IODs in viral factories. The DNA distribution histogram peaks were performed based on measurements of 2000 lymphocytes. Statistical differences are calculated (p<0.05) from randomly distributed events in the frequency distribution, as described earlier.14
Figure 1.

Distribution frequency of standard IOD values on human diploid cells. (A, B, and C) Sequential steps for implementing image cytophotometry measurements (A) after Feulgen staining. (B) Converted to gray scale to avoid the Naphthol yellow contamination. (C) Mark the clear nuclear for DNA evaluation. (D) Significant local maximum of the DNA histogram peak. Images are obtained from image photocytometry. Scale bar = 5 µm. Abbreviation: IOD, Integrated Optical Density.
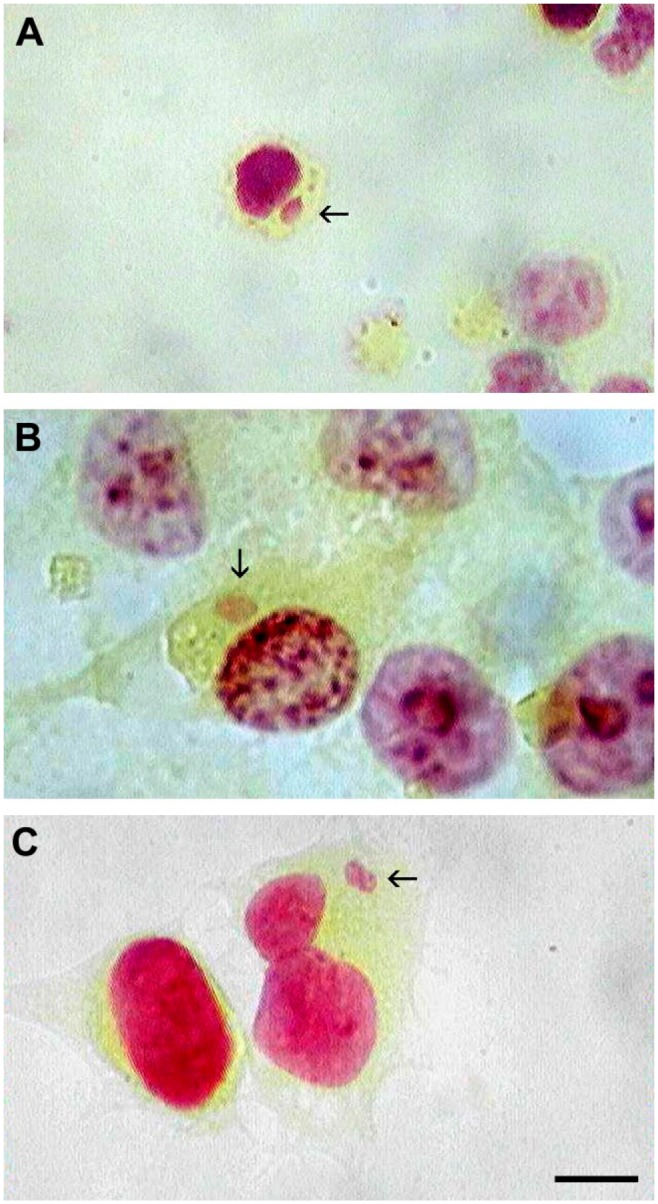
Swine primary bone marrow lymphoid cells, Vero and HeLa cells, were infected with wild-type ASFV-Georgia 2007, ASFV-BA71V, and VV, respectively. At indicated time points of post-infection (ASFV-Georgia 2007: 24 hpi; ASFV-BA71V: 12 hpi; and VV: 6 hpi), cells were fixed and stained with Feulgen technique as described in section “Materials and Methods” and Fig. 1. As expected, DNA positive viral factories were clearly visible only in the cytoplasm of infected cells. Representative images from each sample are shown in Fig. 2A, B, and C. It is worth mentioning that infection time points for each virus were chosen based on previously described observations.10,11,14
Figure 2.

Feulgen-stained DNA of viral factories. (A) Wild-type ASFV-Georgia 2007 viral factory from infected lymphocyte. (B) Culture adapted ASFV-BA71V viral factory from infected Vero cell. (C) Vaccinia virus viral factory from infected HeLa cell. Images are obtained from image photocytometry. Scale bar = 10 µm. Abbreviation: ASFV, African swine fever virus.
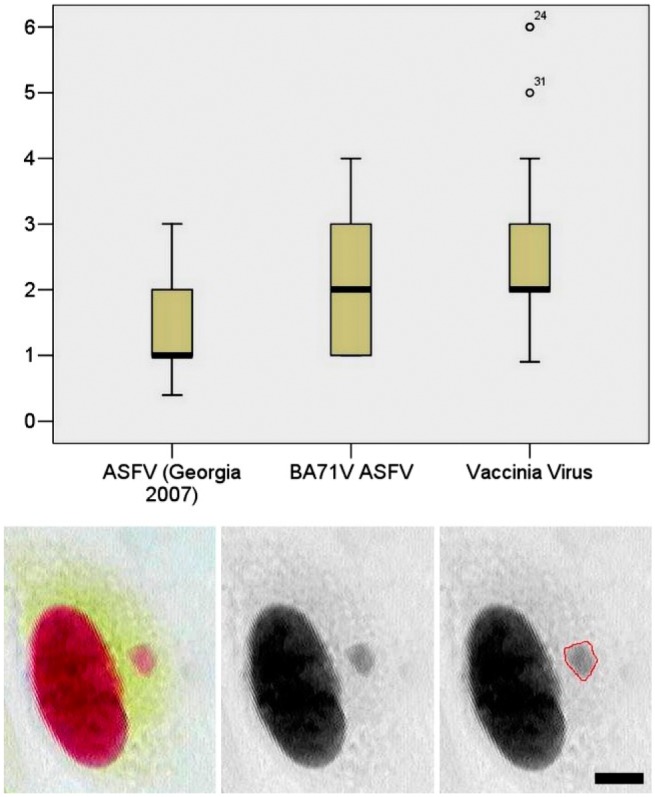
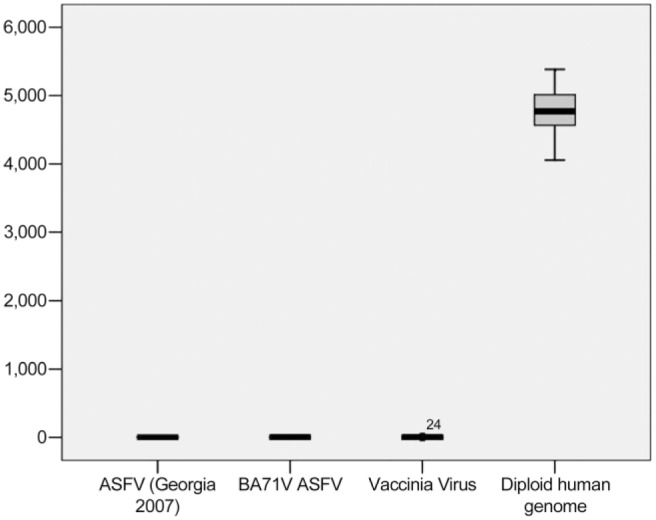
To evaluate the IODs of viral factories for each virus sample, 300 viral factories were analyzed, the average of which is presented in Fig. 3. Image cytophotometry example for the step measurement of VV viral factory is shown in Fig. 3, which was performed similar to Fig. 1A, B, and C. The comparison of IODs from human diploid cells with the IODs of viral factories is presented in Fig. 4.
Figure 3.

IODs of viral factories of wild-type ASFV-Georgia 2007, culture-adapted ASFV-BA71V, and VV. Below is the representative image of step measurements for VV viral factories measured by image cytophotometry, as described above for Fig. 1. Scale bar = 5 µm. Abbreviations: IOD, Integrated Optical Density; ASFV, African swine fever virus; VV, Vaccinia virus.
Figure 4.

The comparison of IODs collected from viral factories to human diploid standards. Abbreviation: IOD, integrated optical density; ASFV, African swine fever virus.
Now, we suggest a formula of how to evaluate the mass of DNA of viral factory (Mvf):
and the number of viral genome single copies (VGSC) of DNA:
Here, Mvf is the mass of DNA of viral factory in picograms (pg); Mhd is the mass of DNA of human diploid cell (pg); Mvf iod is the mass of DNA of viral factory evaluated in integrated optical density; Mhd iod is the mass of DNA of human diploid cell evaluated in integrated optical density; VGSC is the number of single DNA copies of viral genome; Msc is mass of single DNA copy of viral genome (pg). Because Mhd is a known quantity and we have calculated Mhd iod and Mvf iod, one can calculate the value of Mvf from the above formula. Our results are depicted in Table 1.
Table 1.
Measurements of Diploid Human Genome and Viral Factories.
| Diploid Human Genome Mean ± SDa | Viral Factories Mean ± SDb | Viruses | Number Genome Within Factoryc | |
|---|---|---|---|---|
| IOD measurements | 47.86 ± 1.34 | 1.48 ± 0.19 | ASFV-Georgia 2007 | 1176 ± 59 |
| Mass of DNA pg | 6.5 ± 0.18 | 0.2 ± 0.01 | ||
| IOD measurements | 47.86 ± 1.34 | 2.34 ± 0.57 | ASFV-BA71V | 2133 ± 533 |
| Mass of DNA pg | 6.5 ± 0.18 | 0.32 ± 0.08 | ||
| IOD measurements | 47.86 ± 1.34 | 2.74 ± 0.71 | VV | 1267 ± 308 |
| Mass of DNA pg | 6.5 ± 0.18 | 0.37 ± 0.09 |
Abbreviations: IOD, Integrated Optical Density; pg, picograms; ASFV, African swine fever virus; VV, Vaccinia virus.
Data obtained from at least 2000 normal human lymphocytes.
Data obtained from at least 300 ASFV factories. Data obtained from at least 300 VV factories.
Description in the text.
Considering the available information on human15 and viral genomes,16–18 one can obtain the mass of human diploid cell, which is equal to 3 × 109 bp × 2 (diploid) × 650 an average MW/bp × 1.66 × 10⁻¹² pg (weight in Dalton) = 6.5 pg15; the wild-type ASFV-Georgia 2007 DNA mass, which is equal to 102 × 106 × 1.66 × 10−12 pg (weight in Dalton) = 0.00017 pg16; because the ASFV-BA71V DNA sequence has about 10% deletion in the genome (170 kb) compared with its wild-type backbone,17 its weight will be approximately 0.00015 pg and the content of DNA per VV particle was determined to be 2.92 × 10⁻¹⁰ μg or approximately 0.000292 pg.18
Following our results, the average mass of IOD for wild-type ASFV-Georgia 2007 viral factory is 0.2 pg, and if average mass of wild-type ASFV-Georgia 2007 DNA genome is 0.00017 pg, then we obtain an average number of wild-type ASFV-Georgia 2007 genomes within the viral factory of 1176 ± 59.
The average mass of IOD for ASFV-BA71V factories in Vero cells being 0.32 pg, and the average viral particle mass being 0.00015 pg, we obtain a genome within the viral factory of 2133 ± 533.
Finally, as the average mass IOD for VV is 0.37 pg, and the known average mass of the DNA of 1 viral particle is 0.000292 pg, we obtain the content of the genomes within the VV factory as 1267 ± 308. These results are summarized in Table 1.
Discussion
In normal cell populations, the DNA content of the diploid cells is a constant value, independent of nuclear size, as well as their IOD in Feulgen-stained nuclei.19 But also it is known that DNA packing compactness, fixation, and being embedded by different techniques can have an influence on the stoichiometry of the Feulgen-Schiff method.20,21 Determined differences in chromophore yield of 10–20% were found in the nuclei of cells with different states of compactness of their chromatin described in hyper-compact nuclei, for example, from chicken erythrocytes.20 This problem can be solved using identical and simultaneous conditions for fixation and staining of samples prepared to obtain the cellular standards and the viral factories. Using normal lymphocytes as a standard solves this problem. If image cytometry works properly, a coefficient of variation usually does not exceed 5%.6,7
Virus quantification plays an important role in almost all research investigations in the field of virology. The most commonly used methods for virus quantification and titration are plaque assay, biological titration, and TCID50 determination, transmission electron microscopy, and so forth. Some of these methods have been developed to help determine virus titers. Some other methods that are available provide more accurate and reliable tools to measure virus number; however, they are expensive and highly time-consuming.22
Although more modern methods, including qPCR and ELISA, are more frequently used, there are still significant drawbacks associated with all of these assays.
According to Heider and Metzner,1 all methods for determination of virus concentrations may be grouped into four categories: (1) determining levels of infectivity, (2) measuring the presence or function of viral proteins, (3) detecting the presence of viral nucleic acid within the viral genome, and (4) counting physical viral particles. The established virus quantification methods are based on infectivity, or viral protein abundance. However, some information is ultimately presented: the number of viruses per volume. The process of inferring this information gives rise to inherent differences when comparing results with other types of information. For example, infectious titers, whether measured by plaque assays or by biological titration, will always give lower concentration than methods based on the presence of nucleic acid, protein, or viral particles.1 This is explained by the level of functional validity of virus particles associated with the measurement parameters.
We suggest an alternative experimental process and a simple method to evaluate the viral genome copies within viral factories during the replication cycle of viruses. Therefore, we think that we will also be able to evaluate the activity of the replication for the DNA viruses in different conditions such as under the treatment of pharmacological agents. Of course, our method cannot be used for viruses of unknown genome sizes. This is a partial limitation for the use of the method. But as sequencing of virus genomes goes on, this limitation will be gradually overcome. As shown by Brookes et al.,22 in vivo data for ASFV, the virus factory area, and particle number were similar to those obtained in in vitro results. VV levels of infection titers in vivo and in vitro in susceptible systems were also almost similar.23 Therefore, we can assume the possibility of successful application of the technique for in vivo conditions. We believe that our assay can be helpful as an alternative way for the quantification of cytoplasm replicated DNA viruses in cell culture models as well as in in vivo experiments. Use of our method for virus quantification is promising not only for a quantitative measurement of viral genomes, but also in the assessment of the replication activity of the virus under the influence of different agents.
Acknowledgments
We would like to thank Prof. Wen Chang for providing Vaccinia virus samples and Prof. Yolanda Revilla for providing African swine fever virus (ASFV) BA71V virus samples.
Footnotes
Competing Interests: The author(s) declared no potential conflicts of interest with respect to the research, authorship, and/or publication of this article.
Author Contributions: All authors have contributed to this article as follows: ZAK suggested an idea, designed the formula, and conducted the experiment with wild-type African swine fever virus (ASFV); RAI analyzed and conducted the experiments with Vaccinia virus, prepared the manuscript, and provided the technical writing and revision of the manuscript; LOA, ASA, and LAH conducted the works with cytophotometry; HSZ conducted the experiment with ASFV-BA71V; EMK prepared the manuscript; and all authors have read and approved the manuscript as submitted.
Funding: The author(s) disclosed receipt of the following financial support for the research, authorship, and/or publication of this article: The sponsors had no input in the study, design, collection, analysis, or interpretation of the data or in the decision of submitting the article.
Contributor Information
Zaven A. Karalyan, Laboratory of Cell Biology and Virology, Institute of Molecular Biology NAS RA, Yerevan, Armenia; Department of Medical Biology, Yerevan State Medical University, Yerevan, Armenia.
Roza A. Izmailyan, Laboratory of Cell Biology and Virology, Institute of Molecular Biology NAS RA, Yerevan, Armenia
Liana O. Abroyan, Laboratory of Cell Biology and Virology, Institute of Molecular Biology NAS RA, Yerevan, Armenia
Aida S. Avetisyan, Laboratory of Cell Biology and Virology, Institute of Molecular Biology NAS RA, Yerevan, Armenia
Lina A. Hakobyan, Laboratory of Cell Biology and Virology, Institute of Molecular Biology NAS RA, Yerevan, Armenia
Hovakim S. Zakaryan, Laboratory of Cell Biology and Virology, Institute of Molecular Biology NAS RA, Yerevan, Armenia
Elena M. Karalova, Laboratory of Cell Biology and Virology, Institute of Molecular Biology NAS RA, Yerevan, Armenia
Literature Cited
- 1. Heider S, Metzner C. Quantitative real-time single particle analysis of virions. Virology. 2014;462–463:199–206. [DOI] [PMC free article] [PubMed] [Google Scholar]
- 2. Sedlak RH, Jerome KR. Viral diagnostics in the era of digital polymerase chain reaction. Diagn Microbiol Infect Dis. 2013;75:1–4. [DOI] [PMC free article] [PubMed] [Google Scholar]
- 3. Pan IC, Shimizu M, Hess WR. Replication of African swine fever virus in cell cultures. Am J Vet Res. 1980;41(9):1357–67. [PubMed] [Google Scholar]
- 4. Condit RC, Moussatche N, Traktman P. In a nutshell: structure and assembly of the vaccinia virion. Adv Virus Res. 2006;66:31–124. [DOI] [PubMed] [Google Scholar]
- 5. Risco C, Fernández de, Castro I. Virus morphogenesis in the cell: methods and observations. Subcell Biochem. 2013;68:417–40. [DOI] [PMC free article] [PubMed] [Google Scholar]
- 6. Böcking A. DNA measurements: when and why? In: Wied GL, Keebler CM, Rosenthal DL, Schenck U, Somrak TM, Vooijs GP. editors. Compendium on quality assurance, proficiency testing and workload limitations in clinical cytology. Chicago: Tutorials of Cytology; 1995. p. 170–88. [Google Scholar]
- 7. Motherby H, Pomjanski N, Kube M, Boros A, Heiden T, Tribukait B, Böcking A. Diagnostic DNA-flow-vs.-image-cytometry in effusion cytology. Anal Cell Pathol. 2002;24(1):5–15. [DOI] [PMC free article] [PubMed] [Google Scholar]
- 8. Rowlands RJ, Michaud V, Heath L, Hutchings G, Oura C, Vosloo W, Dwarka R, Onashvili T, Albina E, Dixon L. African swine fever virus isolate, Georgia. Emerg Infect Dis. 2008;14:1870–4. [DOI] [PMC free article] [PubMed] [Google Scholar]
- 9. Enjuanes L, Carrascosa AL, Moreno MA, Vinuela A. Titration of African swine fever (ASF) virus. J Gen Virol. 1976;32;471–7. [DOI] [PubMed] [Google Scholar]
- 10. Hsiao JC, Chao CC, Young MJ, Chang YT, Cho EC, Chang W. A poxvirus host range protein, CP77, binds to a cellular protein, HMG20A, and regulates its dissociation from the vaccinia virus genome in CHO-K1 cells. J Virol. 2006;80(15):7714–28. [DOI] [PMC free article] [PubMed] [Google Scholar]
- 11. Brookes SM, Dixon LK, Parkhouse RM. Assembly of African swine fever virus: quantitative ultrastructural analysis in vitro and in vivo. Virology. 1996;224(1):84–92. [DOI] [PubMed] [Google Scholar]
- 12. Hakobyan A, Arabyan E, Avetisyan A, Abroyan L, Hakobyan L, Zakaryan H. Apigenin inhibits African swine fever virus infection in vitro. Arch Virol. 2016;161(12):3445–53. [DOI] [PubMed] [Google Scholar]
- 13. Gaub J, Auer G, Zetterberg A. Quantitative cytochemical aspects of a combined Feulgen-Naphthol Yellow S staining procedure for the simultaneous determination of nuclear and cytoplasmic proteins and DNA in mammalian cells. Exp Cell Res.1975;92:323–32. [DOI] [PubMed] [Google Scholar]
- 14. Haroske G, Dimmer V, Meyer W, Kunze KD. DNA histogram interpretation based on statistical approaches. Anal Cell Pathol. 1997;15:157–74. [DOI] [PMC free article] [PubMed] [Google Scholar]
- 15.https://www.neb.com/tools-and-resources/usage-guidelines/nucleic-acid-data.
- 16. Enjuanes L, Carrascosa AL, Viñuela E. Isolation and properties of the DNA of African swine fever (ASF) virus. J Gen Virol. 1976;32:479–92. [DOI] [PubMed] [Google Scholar]
- 17. Rodríguez JM, Moreno LT, Alejo A, Lacasta A, Rodríguez F, Salas ML. Genome sequence of African swine fever virus BA71, the virulent parental strain of the nonpathogenic and tissue-culture adapted BA71V. PLoS ONE. 2015;10:e0142889. doi: 10.1371/journal.pone.0142889. [DOI] [PMC free article] [PubMed] [Google Scholar]
- 18. Cabrera CV, Esteban M. Procedure for purification of intact DNA from vaccinia virus. J Virol. 1978;25:442–5. [DOI] [PMC free article] [PubMed] [Google Scholar]
- 19. Gurley AM, Hidvegi DF, Bacus JW, Bacus SS. Comparison of the Papanicolaou and Feulgen staining methods for DNA quantification by image analysis. Cytometry. 1990;11(4):468–74. [DOI] [PubMed] [Google Scholar]
- 20. Duijndam WA, van Duijn P. The influence of chromatin compactness on the stoichiometry of the Feulgen-Schiff procedure studied in model films. II. Investigations on films containing condensed or swollen chicken erythrocyte nuclei. J Histochem Cytochem. 1975;23(12):891–900. [DOI] [PubMed] [Google Scholar]
- 21. Schulte E. The influence of embedding on the stoichiometry of the pararosaniline-Feulgen stain in histological material. Acta Histochem Suppl. 1990;38:255–8. [PubMed] [Google Scholar]
- 22. Brookes SM, Dixon LK, Parkhouse RM. Assembly of African swine fever virus: quantitative ultrastructural analysis in vitro and in vivo. Virology. 1996;224(1):84–92. [DOI] [PubMed] [Google Scholar]
- 23. Fang Q, Yang L, Zhu W, Liu L, Wang H, Yu W, Xiao G, Tien P, Zhang L, Chen Z. Host range, growth property, and virulence of the smallpox vaccine: vaccinia virus Tian Tan strain. Virology. 2005;335(2):242–51. [DOI] [PubMed] [Google Scholar]


