Abstract
Introduction
The present study aimed to evaluate the accuracy of time-resolved-computed tomographic angiography (TR-CTA) on a 128-slice CT scanner vis-à-vis cerebral digital subtraction angiography (DSA) in defining the morphological and haemodynamic characteristics of cerebral arteriovenous malformation (AVM).
Methods
Twenty-one patients (age range 10–46, mean 24.8 years) with clinical suspicion of AVM and three patients (age range 23–35, mean 24.3 years) with diagnosed AVM who were on follow-up underwent DSA and TR-CTA, on average 1.5 days apart. Three independent neuroradiologists analysed both studies in a blinded fashion based on the following parameters: AVM location, arterial feeder territories, venous drainage pattern, nidus flow characteristics, venous outflow obstruction, arterial feeder enlargement, external carotid artery feeder, location of aneurysm if any, leptomeningeal and transdural recruitment, neoangiogenesis, and pseudophlebitic pattern.
Results
The TR-CTA correctly demonstrated AVM in all 21 positive cases. It concordantly detected location (21/21), venous drainage pattern (21/21), nidus flow characteristics (21/21), and the venous outflow obstruction (9/9). However, discordance was seen in the demonstration of the arterial feeder (2/45) (p = 0.49), arterial enlargement (13/17) (p = 0.103), external carotid artery feeder (0/1), aneurysmal location (3/5) (p = 0.40), leptomeningeal recruitment (1/3) (p = 0.40), neoangiogenesis (0/4) (p = 0.028) and in the pseudophlebitic pattern (2/5) (p = 0.167) demonstration.
Conclusions
The results suggest that TR-CTA can provide the important features of cerebral AVM which are required in patient management.
Keywords: Cerebral AV malformation, multi-detector row CT, TR-CTA, 4D-CTA
Introduction
Cerebral arteriovenous malformation (AVM) is a complex vascular pathology with multi-pronged treatment options in the form of conservative treatment, endovascular embolisation, stereotactic radiosurgery, open surgery or a combination of these. For adequate diagnosis and treatment of cerebral AVM, a safe and accurate diagnostic work-up is essential to provide detailed angioarchitecture and haemodynamic characterisation including exact location, dimension of nidus, arterial feeders, and draining veins with emphasis to assess factors predictive of haemorrhage including small nidus size, deep nidus location, single deep venous drainage, associated arterial aneurysm, impaired venous drainage, and high intranidal pressure.1 Catheter angiography is currently the gold standard but it is invasive in nature and carries a low but definite risk of complications. Also, irrespective of the treatment options chosen, almost all patients require multiple follow-up angiographies to see the response of the therapy. Among non-invasive options, computed tomography angiography (CTA) and magnetic resonance angiography (MRA) may diagnose the lesion and provide simultaneous visualisation of the nidus, arterial and venous anatomy.2 Their major drawback, however, is the lack of information of the flow (or the dynamic information) and the accurate sizing of the nidus because they are one-time acquisitions and capture only one phase of the flow dynamics.3–5 Today, CTA has a limited role in the characterisation of intracranial AVMs.4 The major use of MRA today is in the evaluation of the AVM nidus during radiosurgery planning and in following up of radiosurgical patients.5 Time-resolved (TR)-MRA, which has been evaluated lately, has significantly inferior spatial and temporal resolution in comparison with digital subtraction angiography (DSA).6 With technical advancements in CT, TR-CTA or four-dimensional computed tomography angiography (4D-CTA) is emerging as a technique with benefits of both the non-invasive nature of CTA and dynamic acquisition of DSA. The datasets generate cross-sectional images, which provide additional diagnostic information as well. TR-CTA appears to be a promising alternative to DSA for TR imaging. Sub-millimetre spatial and sub-second temporal resolution possible with TR-CTA is unmatchable with TR-MRA.6–11 Use of TR-CTA in stroke,9,13 dural arteriovenous fistulas (AVFs)11and arteriovenous vascular malformations12–15 is currently under evaluation.
Cerebral DSA aids in the accurate analysis of the nidus angioarchitecture and identification and distinction of feeding arteries and draining veins in cerebral AVMs because of its high temporal and spatial resolution. However, it is an invasive examination and is associated with a small but real risk of major complications (≤1.3%), including mortality (<0.1%).3 These concerns become much higher in patients with AVM as multiple catheter examinations (pre- and post-treatment) are usually required.
We undertook a study to compare results of TR-CTA and DSA evaluations of cranial AVMs to determine if the two methods identify the same crucial features of AVMs required in patient management.
Materials and methods
Patient selection and data collection
This was a prospective study conducted over 18 months’ duration after obtaining approval from our institutional research ethics committee. The patients with suspected cerebral AVM or follow-up AVM patients were evaluated both with TR-CTA and DSA. All patients older than 18 years of age referred for imaging in untreated or follow-up cases of cerebral AVM were included. Exclusion criteria were: patient age younger than 18 years, refusal of consent, known allergy to iodinated contrast agents, and renal failure. A written informed consent was obtained from all the patients.
DSA imaging protocol
The DSA was performed on a biplane system (Allura Xper FB 20/10; Philips Medical Systems) with a matrix of 1024 × 1024, by an experienced neuroradiologist using the Seldinger technique and femoral artery route. Multiple projections (anteroposterior, lateral and both oblique) were recorded. The digital magnification views were obtained for assessment of nidus architecture, arterial feeders, and outflow vasculature. The frame rate of six frames/second (for the first four seconds) followed by two frames/second was maintained for all patients.
4D CTA imaging protocol
The study planning was performed on a lateral topogram. The volumetric CT data were acquired by means of shuttle mode scanning,6 consisting of continuous helical acquisition with the table moving smoothly to and fro to cover the desired scan range. With an eight-second delay after the start of contrast injection, 20 consecutive spiral scans were obtained in multiphasic mode at 1.5/1.25-second temporal resolution (100/84 mm in the z-axis). The first 15 scans were continuous; however, the last five scans had a time gap to make the scan cycle 5.0/4.5 seconds each. The parameters of the study were 80 kV, 200 mAs, rotation time 0.3 seconds (using maximum pitch of 0.5) and collimation of 128 × 0.6 mm. Total scan time was 55 seconds (Table 1).
Table 1.
Detailed time-resolved computed tomographic angiography acquisition protocol for 128-row MDCT.
| Parameters | 128-Row MDCT |
|---|---|
| Acquisition mode | Cine Dynamic Multi 4D |
| Beam collimation | 76 mm (0.6 mm × 128) |
| Scan time | 1.3 sec |
| 4D range | 84 mm 1.25 sec or 100 mm 1.5 sec |
| Scan cycles and time | 20 cycles in biphasic mode for 41.20/43.80 First 15 cycles with cycle time 1.25/1.5 sec Next 5 cycles with cycle time 5.00/4.5 sec |
| Rotation time | 0.28 sec |
| Tube voltage | 80 kV |
| Tube current | 200 mAs |
| Sampling field of view | 20 cm(head filter) |
| Detector slice | 128 × 0.6 mm |
| Reconstruction filter | Low-frequency H20 smooth |
| Start of scan | 8 sec after start of contrast injection |
| End of scan | 50 sec after start of scan |
| Iodinated contrast medium | Iohexol (Omnipaque, Amersham Health Inc, Princeton, NJ, USA) |
| Iodine concentration | 300 mgl/ml |
| Volume | 50 ml |
| Flow rate | 5 ml/sec |
| Saline flush | Yes |
MDCT: multi-detector row computed tomography; sec: second; 4D: four-dimensional; kV: kilovolt; mAs: milliampere-second.
Angiographic evaluation
Both the TR-CTA and DSA examinations were scored using the same scoring sheet. The items scored included presence or absence of a shunt, the Spetzler–Martin grading parameters (size, eloquence of the location, presence of deep venous drainage), and additional angioarchitecture features of cerebral AVMs routinely reported in our institution. These included, for the arterial component: feeding arteries, presence of dural supply, arterial enlargement, flow-related aneurysms and presence of a transfer of the watershed (i.e. indirect supply to an arterial territory via leptomeningeal collaterals); for the nidus: the nidus type (micro-brain AVM (bAVM) or fistula versus macro-bAVM) and flow volume; and for venous component: evaluation of the stagnation of contrast material, venous outflow obstruction and the presence of venous pouches.
Data evaluation
The data of both the DSA and TR-CTA studies were anonymised and transferred to a dedicated workstation. There it was read and reported by a panel of three neuroradiologists (authors VG, CA and RS). The readers had 17, 8 and 3 years’ experience, respectively. If the readers did not agree on a certain finding in any case, re-examination of the finding was undertaken collectively and a consensus was reached. For each patient, the readers were blinded to the CTA/DSA results at the time of reading the scans. Subsequently, a standardised scoring sheet was filled out for each diagnostic study.
All statistical analysis and graphs were evaluated using SPSS, version 15. The sensitivity, specificity, and positive and negative predictive values of TR-CTA with respect to arterial feeders, neighbouring/distal vessels, and early draining vein was calculated. The agreement between the two modalities of TR-CTA and DSA for requisite data to arterial feeders, nidus size and venous drainage etc. was performed by using the nonparametric tests of significance. The Wilcoxon signed-rank test was applied for significance of difference in size of AVM nidus by the two modalities. Fisher’s exact probability test was applied for significance of difference between tests for discordance in the demonstration of the arterial feeder, arterial enlargement, aneurysmal location, leptomeningeal and transdural recruitment, neoangiogenesis and pseudophlebitic pattern demonstration. Statistical significance was set at p < 0.05 for all calculations.
Results
Over a period of 18 months, 24 consecutive patients with cerebral AVM were studied, of whom 15 were males and nine were females with a mean age (±SD) of 24.8 (±9.7) years. Haemorrhage at presentation was found in 18/24 (74%) patients. Seventeen patients had intraparenchymal bleeding (15 supratentorial and two infratentorial location) and one isolated ventricular haemorrhage. The prominent presenting symptoms were headache (67%), vomiting (62.5%), loss of consciousness (33%), weakness (12%), numbness (8.3%), visual symptoms (8.3%) and seizures (21%).
Both studies were carried within nine days of each other in all cases. The mean interval between the studies was 1.5 days. In 19 cases DSA was performed prior to TR-CTA. Of the 24 patients included, 21 patients had a cerebral AVM and these patients were included in the evaluation. The remaining three patients were being evaluated following radiosurgical ablation and had no residual nidus at the time of examination.
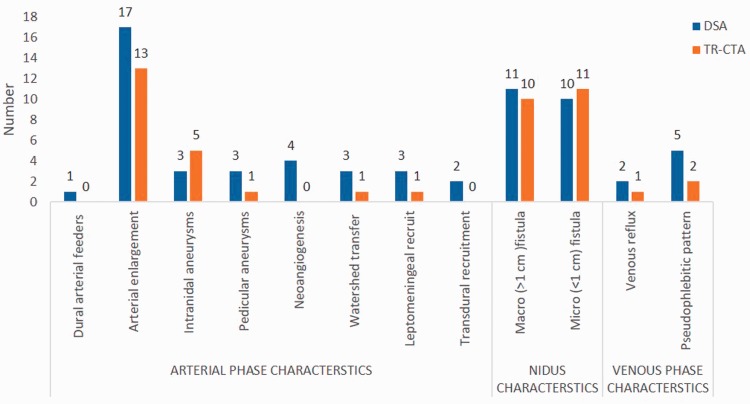
The detailed scoring for each feature that was evaluated is given in Table 2 and Figure 1.
Table 2.
Summarised comparison with analysis of AVM characteristic depiction on DSA and TR-CTA.
| Modality |
||||||||
|---|---|---|---|---|---|---|---|---|
| Features | DSA | TR-CTA | Sensitivity | Specificity | PPV | NPV | p value | |
| 1 | Shunt detection (n = 21) AVM | 18 | 18 | 100 | 100 | 100 | 100 | NA |
| AV fistula | 03 | 03 | 100 | 100 | 100 | 100 | NA | |
| 2 | Location (n = 21): - Supratentorial - Infratentorial | 19 02 | 19 02 | 100 100 | 100 100 | 100 100 | 100 100 | NA |
| 3 | Early venous filling (n = 21) | 21 | 21 | 100 | 100 | 100 | 100 | NA |
| 4 | Nidus size(n = 21): - <1 cm - 1–3 cm - >3 cm | 5.1 cm3 5 8 5 | 4.3 cm3 6 7 5 | 100 87.5 100 | 92.86 100 100 | 83.3 100 100 | 100 90.9 100 | 0.016c |
| 5 | Arterial feedersa (n = 44): - Anterior circulation - Posterior circulation | 44 34 10 | 42 33 09 | 95.45 97.06 90.0 | 100 100 100 | 100 100 100 | 0.49 | |
| 6 | Dural artery supply (n = 21) | 01 | 00 | 0.00 | 100.00 | – | 97.78 | 1 |
| 7 | Arterial enlargementa (n = 44) | 17 | 13 | 76.4 | 100 | 100 | 87.5 | 0.103 |
| 8 | Flow-related aneurysm(s)b (n = 6): - Intranidal - Pedicular | 03 03 | 05 01 | 100 33.3 | 33.3 100 | 60 100 | 100 60 | 0.40 |
| 9 | Neoangiogenesis (n = 21) | 04 | 00 | 0.00 | 100.00 | – | 80.95 | 0.028c |
| 10 | Watershed transfer(n = 21) | 03 | 01 | 33.3 | 100 | 100 | 90 | 0.40 |
| 11 | Leptomeningeal recruit (n = 21) | 03 | 01 | 33.3 | 100 | 100 | 90 | 0.40 |
| 12 | Transdural recruit (n = 21) | 02 | 00 | 0.00 | 100.00 | – | 90.48 | ND |
| 13 | Nidus type (n = 21) - Macro (>1 cm) - Micro (<1 cm) | 11 10 | 10 11 | 90.91 100 | 100.00 90.9 | 100 90.9 | 90.9 100 | |
| 14 | Nidus flow (n = 21) -High flow -Low flow | 18 03 | 100 100 | 100 100 | 100 100 | 100 100 | 100 100 | NA |
| 15 | Venous drainage (n = 21) - Superficial - Deep - Mixed | 16 07 05 | 16 07 05 | 100 100 100 | 100 100 100 | 100 100 100 | 100 100 100 | NA |
| 16 | Venous reflux (n = 21) | 2 | 1 | 50.0 | 100 | 100 | 95.0 | 1 |
| 17 | Pseudophlebitic pattern (n = 21) | 5 | 2 | 40.0 | 100 | 100 | 84.2 | 0.167 |
| 18 | Venous ectasia/aneurysm (n = 21) | 4 | 4 | 100 | 100 | 100 | 100 | NA |
AVM: arteriovenous malformation; DSA: digital subtraction angiography; TR-CTA: time-resolved computed tomography angiography; PPV: positive predictive value; NPV: negative predictive value; NA: not applicable; ND: non-definable.
n = 44 total feeders considered for calculation. bn = 6 total number of aneurysms considered for calculation.
Statistically significant difference (in bold).
Figure 1.
Bar chart summarising discrepancies of time-resolved-computed tomographic angiography (TR-CTA) in characterisation of arteriovenous malformation in comparison with digital subtraction angiography (DSA).
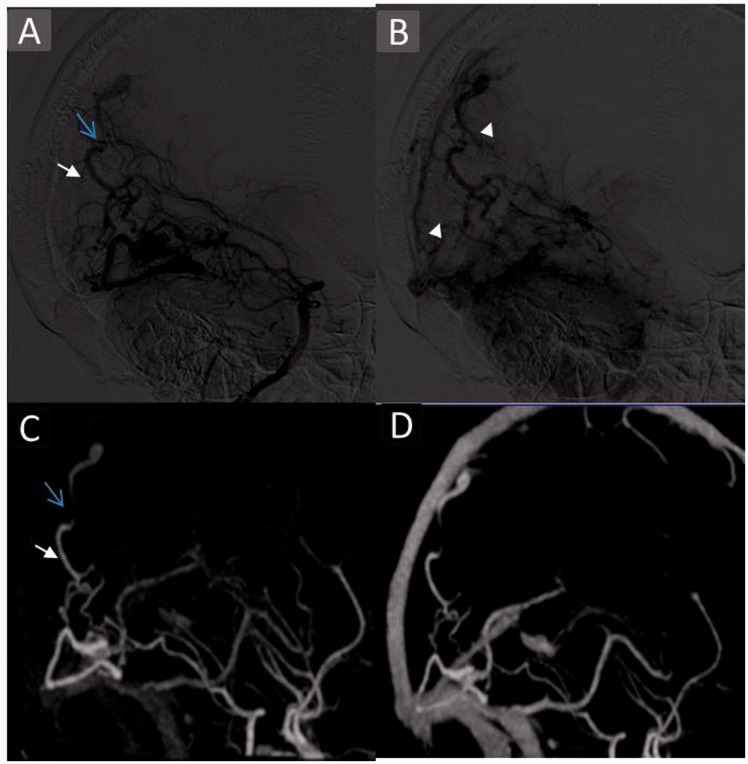
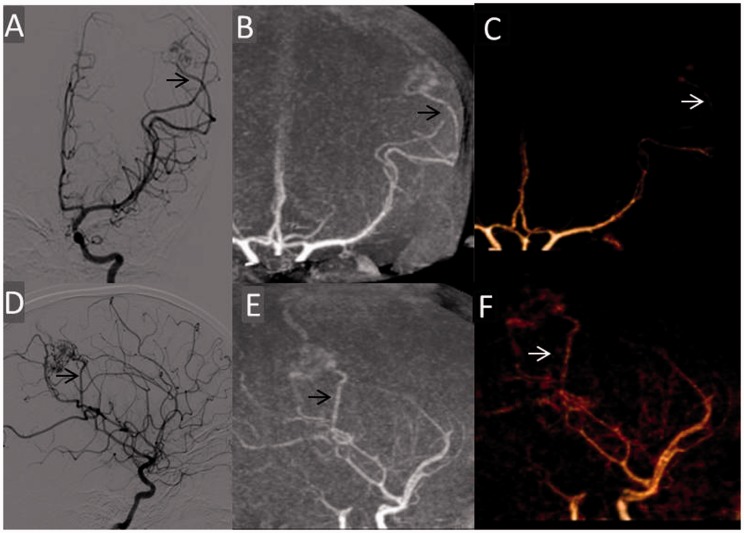
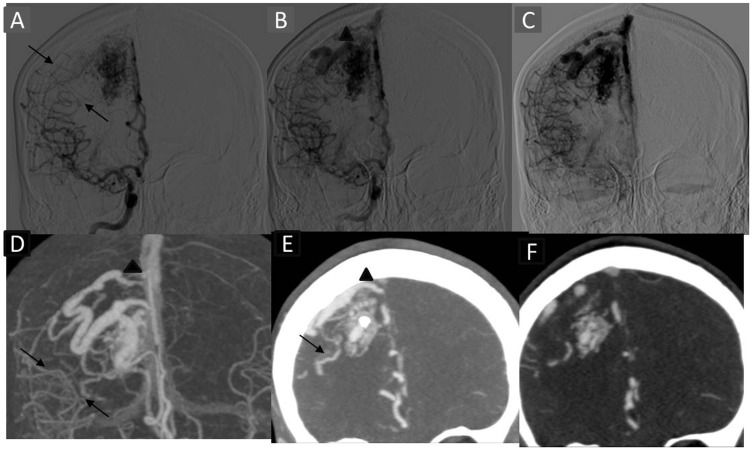
TR-CTA generated comparable angiographic phases when compared to the catheter angiography – early arterial, late arterial, nidal, parenchymal, early and late venous phase with good spatial resolution. A cardinal feature of AVM, early venous filling, was also recognised by TR-CTA in all cases. The fully concordant depiction of location, arterial territories of visualised feeders (Figures 2 and 3), venous drainage pattern (Figures 2 and 4), nidus flow characteristics, and venous outflow obstruction in all of our study cases are proof of its good spatial and temporal resolution. All 21 patients with AVM (18 with nidus and three direct fistulas) were correctly detected and graded with TR-CTA. There was discordance in Spetzler–Martin grading in two patients, which was due to under-sizing of AVMs with TR-CTA, with one Grade 2 lesion being classified as Grade 1 and another Grade 4 lesion as Grade 3. In addition, the sub-classification of small bAVM into micro-bAVM (<1 cm, including pial fistulas) versus macro-bAVMs (>1 cm) was not agreed on in one case (p = 0.75).
Figure 2.
Case showing concordant depiction of deep venous drainage, venous stenosis and discordant depiction of pseudophlebitic pattern with TR-CTA. An 18-year-old female patient with a history of seizures and visual complaint with Grade 4 AVM. Left VA angiogram serial venous phase runs ((a) and (b)) showing deep venous drainage into the straight sinus, venous stenosis (blue arrow) and pseudophlebitic pattern (arrowhead) better on delayed images. MIP reconstruction of TR-CTA in corresponding phases ((c) and (d)) concordantly depicting venous stenosis (arrow) and deep venous drainage (arrow). Pseudophlebitic pattern is not depicted on TR-CTA. TR-CTA: time-resolved-computed tomographic angiography; AVM: arteriovenous malformation; VA: vertebral artery; MIP: maximum intensity projection.
Figure 3.
Case showing corresponding angiographic phases and concordant depiction of arterial feeder and its subtle enlargement with TR-CTA. A 10-year-old female presented with haemorrhage in the left parietal lobe with Grade 3 AVM. Left internal carotid angiogram early arterial phase films (a) AP and (d) lateral view depicting arterial feeders from central rolandic (arrow) and anterior parietal branches of the MCA. MIP and VR AP ((b) and (c)) and lateral ((e) and (f)) projections of TR-CTA in corresponding phase concordantly depicting the arterial feeders (arrow). However, arterial enlargement was not read with TR-CTA. TR-CTA: time-resolved-computed tomographic angiography; AVM: arteriovenous malformation; AP: anteroposterior; MCA: middle cerebral artery; MIP: maximum intensity projection; VR: volume-rendered.
TR-CTA concordantly detected territories of all 43 arterial feeders visualised. It correctly identified nidal flow characteristics. There was full agreement in venous drainage depiction including depiction of site and grade of venous stenosis, venous ectasia, aneurysm and pouches in all patients (Figures 2–4).
Figure 4.
Case showing concordant depiction of watershed transfer venous drainage and stenosis with TR-CTA. Right ICA angiogram AP view early, mid- and late arterial phases ((a)–(c)) depicting watershed transfer from right MCA territory in the late arterial phase (arrows). MIP reformat of TR-CTA in late arterial phase (d) and thin coronal MIP of cross-sectional images in late phase ((e) and (f)) depicting the leptomeningeal vessels. Note is made of calcification in the nidus in thin MIP images. It underlines the value of cross-sectional images. The venous stenotic segment (arrowhead) is concordantly visualised. TR-CTA: time-resolved-computed tomographic angiography; ICA: internal carotid artery; AP: anteroposterior; MCA: middle cerebral artery; MIP: maximum intensity projection.
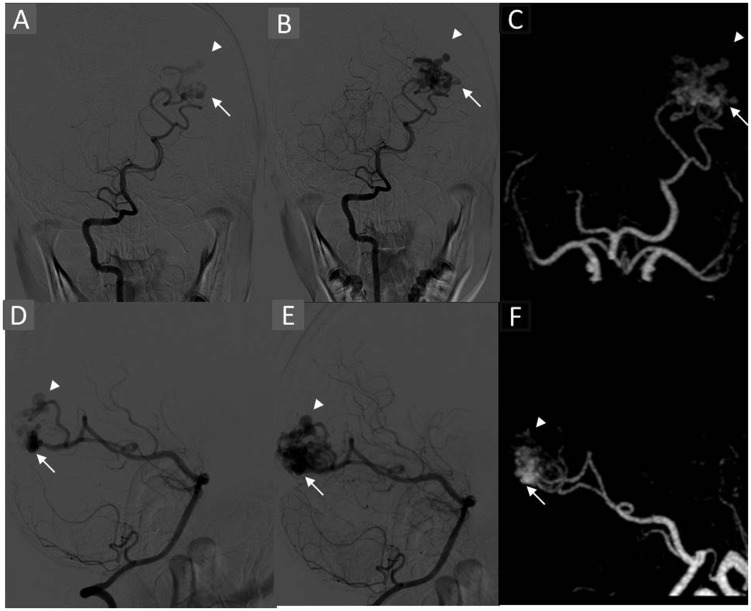
TR-CTA correctly demonstrated all the aneurysms which were subsequently seen on DSA. However, exact localisation was imprecise in two cases in which two distal pedicular aneurysms were read as intranidal (Figure 5). The results were not statistically significant (p = 0.40). No remote aneurysm was seen arising from the arterial pedicle unrelated to the AVM supply.
Figure 5.
Case showing discordance in localisation of aneurysms. A 14-year-old male presented with visual symptoms, left occipital haemorrhage, and had Grade 3 AVM. Right VA angiogram early films AP (a) lateral (d) depicting arterial feeders from the calcarine artery with haemodynamic flow alteration and two distal pedicular aneurysms, two intranidal aneurysms 4.8 × 2 mm (arrowhead) and 3 × 1.8 mm (arrow) and mid-arterial phase depicting nidus with aneurysms. MIP AP (c) and lateral (f) of 4D-CTA in early arterial phase depicting nidus along with aneurysms. These were classified as intranidal due to poor temporal resolution of the TR-CTA. AVM: arteriovenous malformation; VA: vertebral artery; AP: anteroposterior; MIP: maximum intensity projection; 4D: four-dimensional; CTA: computed tomographic angiography; TR-CTA: time-resolved-computed tomographic angiography.
The TR-CTA undersized the lesions when compared to DSA. The median size of the nidus was 5.1 cm3 on DSA and 4.3 cm3 on TR-CTA, and this difference was statistically significant (p = 0.016).
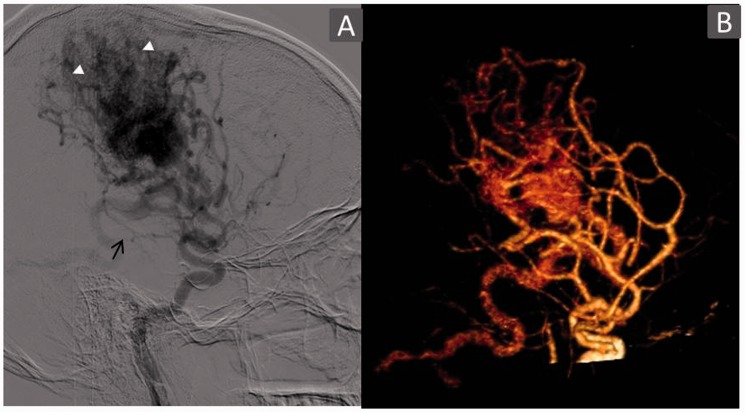
TR-CTA was unable to detect the arterial feeder from the anterior choroidal artery in one case (Figure 6) and the posterior cerebral artery (PCA) splenial branch in another. Also, the dural supply from the internal maxillary artery through its dural branches in one case was not visualised due to limited coverage. Subtle arterial enlargements were also missed. Further, it did not demonstrate neoangiogenesis, watershed transfer, and leptomeningeal and transdural recruitment in two of three cases. Also, TR-CTA was unable to identify venous reflux in one and pseudophlebitic pattern in two cases.
Figure 6.
Case showing discordance in arterial feeder detection and neoangiogenesis. A 26-year-old male patient with large diffuse right frontoparietal Grade 4 AVM. Right internal carotid angiogram arterial phase films (a) lateral view depicting arterial feeders from the anterior choroidal artery (arrow) and enlarged feeders from the MCA with neoangiogenesis (arrowhead). TR-CTA VR (b) lateral view failed to identify this choroidal feeder (arrow) and sprouting vessels – neoangiogenesis. This is due to poor spatial resolution and crowding of vasculature with TR-CTA. AVM: arteriovenous malformation; MCA: middle cerebral artery; TR-CTA: time-resolved-computed tomographic angiography; VR: volume rendered.
The average TR-CTA radiation dose calculated was 4.57 mSv.
Discussion
This study was designed to assess the capability of TR-CTA in providing morphological and temporal information of AVMs and to determine its potential to replace catheter angiography for the diagnosis and/or follow-up of cerebral AVMs.
CTA and MRA are widely available and depict AVM morphology well. Dynamic non-invasive imaging with TR-MRA has poor spatial and temporal resolution when compared to DSA.2,6
In our study 4D-CTA demonstrated early venous filling in all 21 cases (18 AVMs and three AVFs), independent of nidus size. Also, an accurate distinction between the territories of the feeding artery could be made when a shunt was detected by 4D-CTA. It was fully concordant in depiction of flow characteristics, venous drainage, site and grade of venous stenosis and venous ectasia/pouches. Thus, our study corroborates the finding of previous studies11–16 (described later) with TR-CTA appearing sufficiently accurate to diagnose cerebral AVMs and their characterisation.
However, limitations of TR-CTA became apparent when finer angioarchitecture details were evaluated. The detailed evaluation suffered from impaired spatial resolution, temporal resolution and signal-to-noise ratio in comparison with DSA leading to non-depiction of the anterior choroidal artery feeder (Figure 6) and arterial dilatations of four feeders. Moreover, non-selectivity of the vessel opacification eliminates its ability to isolate certain vessels, making it difficult to determine the nature of certain vessels and their relationship as depicted by its inability to visualise the PCA splenial branch feeder, neoangiogenesis in all four cases, watershed transfer and leptomeningeal and transdural recruitment in one case, venous reflux in one case and a pseudophlebitic pattern (Figure 2). Similarly, a discrepancy was observed in aneurysmal detection (6/8) as well as their localisation with TR-CTA diagnosing as intranidal five aneurysms which in fact were only three, the other two being pedicular on DSA (Figure 5). Also, it diagnosed one pedicular aneurysm instead of five on DSA. This points to inadequacy in detecting and characterising aneurysms in close proximity to the nidus or intranidally.
The statistically significant difference in size measurements of the nidus on two modalities was likely due to use of maximum intensity projection (MIP)/volumetric rendering technique (VRT) images for size evaluation in TR-CTA in comparison with two-dimensional images of DSA. Non-depiction of dural artery supply from the internal maxillary artery through the dural branches was due to the limited coverage area, which should not be a limitation with 320-slice or higher scanners.
Previous studies documented similar conclusions as Willems et al.,12 who documented similar results with 4D-CTA correctly identifying all lesions, distinguishing low-flow from high-flow lesions and detecting dural transosseous feeders, venous narrowing and venous pouches. Wang et al.15 concluded after analysing 17 cases that 4D-CTA has a value like that of DSA in the diagnosis and assessment of AVM. It was fully consistent with DSA for AVM location, size and vascular structures and had a similar ability to DSA to distinguish the main feeding arteries in all cases. Veendrick et al.14 analysed 23 studies on a 320-slice CT in 18 patients and concluded diagnostic information and treatment planning using 4D-CTA was superior to DSA in 61%, equal in 22% and inferior to DSA in 17%. However, eight of the 23 4D-CTA scans were recalculated to 10 frames per second (fps), which is better than standard 2-fps 4D-CTA. The average effective dose of the 4D-CTA was 10.17 mSv, which is significantly higher compared to our study’s 4.57 mSv. Such a high frame rate acquisition is not possible with a 128-slice CT. Biswas et al.16 in a retrospective analysis of 33 pairs of investigations (DSA and 4D-CTA) performed primarily for suspicion of AVM/dAVF reported similar sensitivity, specificity, positive predictive value and negative predictive value for detection of AVM/dAVF, at 77%, 100%, 100% and 87%, respectively. Due to good agreement despite differences in temporal and spatial resolutions, they suggested, 4D-CTA may obviate the need for DSA in a selected subgroup of patients.
Similar discrepancies were also seen in a study of 17 patients by Willems et al.12 4D-CTA disagreed with DSA in only one case, in which deep venous drainage was missed. Further 4D-CTA underestimated the nidus size in four small lesions, misinterpreted a feeding vessel in one case, indirect feeding through pial collaterals in three cases and oversaw mild arterial enlargement in two cases. Wang et al.15 documented similar discrepancies in one patient in identification of smaller and specific arterial branches.
Thus, our study corroborates the findings of previous studies11–16 and confirms the superiority of DSA as the gold standard. Although the differences were statistically insignificant in most of the cases except size and depiction and neoangiogenesis, the implications of such discrepancies are variable ranging from none to significant alteration in treatment strategy. A few of these limitations may be overcome by higher slice number, wider detector array and higher computational power. A complete evaluation of axial cross-sectional images decreases many errors like measurement and vessel characterisation; however, it is time consuming. It also depicts few anatomical/pathological details not directly visible on the MIP/VRT or in DSA imaging, such as calcification (Figure 4), haemorrhage and ventricular dilatation, and may aid in planning surgical approach. We recommend analyses of TR-CTA cross-sectional images as a problem-solving approach in a TR fashion to recognise the nidus and its character and to distinguish it from surrounding feeders.
TR-CTA with repeated acquisitions give essentially a dataset which is like the dataset of conventional CT perfusion, with the difference of limited spatial resolution as compared to present-day whole-brain CT perfusion. But since the major perfusion abnormalities in cerebral AVMs are near the nidus, this dataset can be adequate in assessing perfusion abnormalities like arterial steal and venous congestion. Thus, it has potential to provide information of microcirculation characteristics as well. The microcirculation of surrounding tissues may be impaired by venous hypertension or vascular steal phenomena which have implications for risk estimation and treatment planning.17 Kim and Krings18 studied three different patterns of perfusion abnormalities (‘functional’ arterial steal, ‘ischemic’ arterial steal and venous congestion) in patients with bAVM for different pathologic mechanisms and their correlation with different clinical symptoms. The aim of the present study was different, thus this assessment was not performed. However, in future with faster imaging protocols there will be an increase in the temporal resolution of the dynamic CTA studies, and simultaneous evaluation of microcirculation changes in the form of perfusion CT can be performed from the same dataset.
Limitations of our study
We used toggling-table technique or shuttle mode scanning in our study with a 128-slice machine to enable extended coverage. Although acquisition by continuous volume is the best method, it requires a wide detector for whole-brain coverage. A major drawback of our study is limited z-axis coverage of 10 cm, which is insufficient to cover the full anatomy as depicted by missed external carotid artery feeders in one case. A 100% sensitivity of TR-CTA is not likely a true representation as most of the lesions were high flow and chances of missing these lesions was low. Chances of errors are greater when slow-flow AVMs/AVF are analysed. Moreover, our study included only three negative cases that also resulted in a biased sample of treated patients.
Conclusion
In our study TR-CTA not only detected all lesions but was sufficiently accurate in classifying and identifying major angioarchitecture features such as arterial feeders, associated aneurysms, nidus characteristics and venous drainage pattern. Although a few finer angioarchitecture and haemodynamic details were missed or misinterpreted, the potential of TR-CTA in the assessment of AVMs appears promising. We suggest a judicious approach to change imaging protocols and recommend its use in previously defined AVM follow-up cases and in those cases for which conservative management is planned.
Funding
This research received no specific grant from any funding agency in the public, commercial, or not-for-profit sectors.
Conflict of interest
The authors declared no potential conflicts of interest with respect to the research, authorship, and/or publication of this article.
References
- 1.da Costa L, Wallace MC, Ter Brugge KG, et al. The natural history and predictive features of haemorrhage from brain arteriovenous malformations. Stroke 2009; 40: 100–105. [DOI] [PubMed] [Google Scholar]
- 2.Rieger J, Hosten N, Neumann K, et al. Initial clinical experience with spiral CT and 3D arterial reconstruction in intracranial aneurysms and arteriovenous malformations. Neuroradiology 1996; 38: 245–251. [DOI] [PubMed] [Google Scholar]
- 3.Saleh RS, Lohan DG, Villablanca JP, et al. Assessment of craniospinal arteriovenous malformations at 3T with highly temporally and highly spatially resolved contrast-enhanced MR angiography. AJNR Am J Neuroradiol 2008; 29: 1024–1031. [DOI] [PMC free article] [PubMed] [Google Scholar]
- 4.Görzer H, Heimberger K, Schindler E. Spiral CT angiography with digital subtraction of extra and intracranial vessels. J Comput Assist Tomogr 1994; 18: 839–841. [DOI] [PubMed] [Google Scholar]
- 5.Schwartz RB. Helical (spiral) CT in neuroradiologic diagnosis. Radiol Clin North Am 1995; 33: 981–995. [PubMed] [Google Scholar]
- 6.Krings T, Hans F. New developments in MRA: Time-resolved MRA. Neuroradiology 2004; 46(Suppl 2): S214–S222. [DOI] [PubMed] [Google Scholar]
- 7.Klingebiel R, Siebert E, Diekmann S, et al. 4-D Imaging in cerebrovascular disorders by using 320-slice CT: Feasibility and preliminary clinical experience. Acad Radiol 2009; 16: 123–129. [DOI] [PubMed] [Google Scholar]
- 8.Brouwer PA, Bosman T, van Walderveen MA, et al. Dynamic 320-section CT angiography in cranial arteriovenous shunting lesions. AJNR Am J Neuroradiol 2010; 31: 767–770. [DOI] [PMC free article] [PubMed] [Google Scholar]
- 9.Frölich AMJ, Schrader D, Klotz E, et al. 4D CT angiography more closely defines intracranial thrombus burden than single-phase CT angiography. AJNR Am J Neuroradiol 2013; 34: 1908–1913. [DOI] [PMC free article] [PubMed] [Google Scholar]
- 10.Christian AT, Jürgen G, Vianney L, et al. Intracranial arteriovenous malformation: Time-resolved contrast-enhanced MR angiography with combination of parallel imaging, keyhole acquisition, and k-space sampling techniques at 1.5 T. Radiology 2008; 246: 871–879. [DOI] [PubMed] [Google Scholar]
- 11.Willems PW, Brouwer PA, Barfett JJ, et al. Detection and classification of cranial dural arteriovenous fistulas using 4D-CT angiography: Initial experience. AJNR Am J Neuroradiol 2011; 32: 49–53. [DOI] [PMC free article] [PubMed] [Google Scholar]
- 12.Willems PW, Taeshineetanakul P, Schenk B, et al. The use of 4D-CTA in the diagnostic work-up of brain arteriovenous malformations. Neuroradiology 2012; 54: 123–131. [DOI] [PMC free article] [PubMed] [Google Scholar]
- 13.Kortman HG, Smit EJ, Oei MT, et al. 4D-CTA in neurovascular disease: A review. AJNR Am J Neuroradiol 2015; 36: 1026–1033. [DOI] [PMC free article] [PubMed] [Google Scholar]
- 14.Veendrick P, Mann R, Van der Vleuten, C, et al. 4D-CTA for the evaluation of arteriovenous malformations – A pilot study. In: Abstract Archives of the RSNA, 2014 (ed. Radiological Society of North America), Chicago, IL, USA, 3 December 2014, paper no. SSM25-01.
- 15.Wang H, Ye X, Gao X, et al. The diagnosis of arteriovenous malformations by 4D-CTA: A clinical study. J Neuroradiol 2014; 41: 117–123. [DOI] [PubMed] [Google Scholar]
- 16.Biswas S, Chandran A, Radon M, et al. Accuracy of four-dimensional CT angiography in detection and characterisation of arteriovenous malformations and dural arteriovenous fistulas. Neuroradiol J 2015; 28: 376–384. [DOI] [PMC free article] [PubMed] [Google Scholar]
- 17.Salomon EJ, Barfett J, Willems PW, et al. Dynamic CT angiography and CT perfusion employing a 320-detector row CT: Protocol and current clinical applications. Klin Neuroradiol 2009; 19: 187–196. [DOI] [PubMed] [Google Scholar]
- 18.Kim DJ, Krings T. Whole-brain perfusion CT patterns of brain arteriovenous malformations: A pilot study in 18 patients. AJNR Am J Neuroradiol 2011; 32: 2061–2066. [DOI] [PMC free article] [PubMed] [Google Scholar]


